 |
 |
| Anim Biosci > Volume 33(1); 2020 > Article |
|
Abstract
Objective
In the present study, an liquid chromatography/mass spectrometry (LC/MS) metabolomics approach was performed to investigate potential biomarkers of milk production in high- and low-milk-yield dairy cows and to establish correlations among rumen fluid metabolites.
Methods
Sixteen lactating dairy cows with similar parity and days in milk were divided into high-yield (HY) and low-yield (LY) groups based on milk yield. On day 21, rumen fluid metabolites were quantified applying LC/MS.
Results
The principal component analysis and orthogonal correction partial least squares discriminant analysis showed significantly separated clusters of the ruminal metabolite profiles of HY and LY groups. Compared with HY group, a total of 24 ruminal metabolites were significantly greater in LY group, such as 3-hydroxyanthranilic acid, carboxylic acids, carboxylic acid derivatives (L-isoleucine, L-valine, L-tyrosine, etc.), diazines (uracil, thymine, cytosine), and palmitic acid, while the concentrations of 30 metabolites were dramatically decreased in LY group compared to HY group, included gentisic acid, caprylic acid, and myristic acid. The metabolite enrichment analysis indicated that protein digestion and absorption, ABC transporters and unsaturated fatty acid biosynthesis were significantly different between the two groups. Correlation analysis between the ruminal microbiome and metabolites revealed that certain typical metabolites were exceedingly associated with definite ruminal bacteria; Firmicutes, Actinobacteria, and Synergistetes phyla were highly correlated with most metabolites.
Conclusion
These findings revealed that the ruminal metabolite profiles were significantly different between HY and LY groups, and these results may provide novel insights to evaluate biomarkers for a better feed digestion and may reveal the potential mechanism underlying the difference in milk yield in dairy cows.
Nutritional requirements plays an important role in dairy cowsŌĆÖ productivity, it is necessary to find an effectively digested feed and to maintain healthy physiological functions for efficient milk production. Interestingly, our previous study revealed that the compositions and structures of ruminal bacterial communities between high-yield (HY) and low-yield (LY) dairy cows were significantly different, which advanced the understanding underlying regulation response to the different milk yield [1]. Although the rumen microbial population has an explicit relationship with volatile fatty acids (VFAs), amino acids as well as fatty acids, ruminal metabolites can comprehensively reflect rumen digestive and systemic health [2]. However, the nutrient metabolism in the ruminal system between dairy cows having different ability in milk production remains unclear. Therefore, further research exploring the metabolic profile is necessary to elucidate the mechanism of metabolic regulation of dairy cows.
Metabolomics is an innovative global assessment and quantitatively measures the small endogenous metabolites in biological sample using high-throughput techniques, such as nuclear magnetic resonance [3], liquid chromatography/mass spectrometry (LC/MS) [4], gas chromatographyŌĆōmass spectrometry [5] and gas chromatography time-of-flight/mass spectrometry (GC-TOF/MS) [6]; moreover, in recent years, metabolomics approaches have been widely utilized for their high resolution and detection sensitivity for ruminal metabolite biomarkers. Most previous studies employed interesting metabolomics applications to reveal the impact of diet on animal health and performance [7], to investigate potential metabolite biomarkers of disease or physiology [4,8] and to examine diet-induced metabolic alterations in the ruminal microbial metabolic profile and their effects on milk production-related traits in ruminants [5,9,10]. Thus, the identification and integrative analysis of ruminal metabolites may facilitate the comprehensive characterization of metabolic mechanisms at the molecular and cellular levels in response to internal or external stimuli.
Therefore, it is interesting whether differences in the milk yields of cows were directly associated with their ruminal bacterial metabolomics. The objective of this study was to illustrate the metabolic mechanisms underlying the differences between high and low milk production, especially the rumen bacterial community, by examining the metabolite profiles of ruminal fluid in dairy cows.
The experimental procedures were approved by the Animal Care Committee, Beijing University of Agriculture (Beijing, China). The experiment was designed as previously described [1]. Briefly, sixteen Holstein lactating dairy cows were divided into two groups according to the characteristics of parity (2.6 ┬▒0.4), average body weight (670┬▒24 kg), average dry mater intake (24.2┬▒2.7 kg/d), number of lactation days (114.6┬▒7.5), and these cows were assigned to either HY or LY group (31.90 ┬▒1.76 kg/d and 19.30┬▒1.76 kg/d, respectively; n = 8). The experiment was conducted over 21 days, with the first 14 days serving as an adaptation period. Cows were individually housed in tethered stalls in a barn with good ventilation and were fed and milked using a pipeline milking system three times per day at 0630, 1400, and 2000 h. The methods of samples collection and analysis were described in our previous study [1].
The rumen fluid samples were thawed at room temperature. Samples (100 ╬╝L) were used for metabolomics analysis. L-2-chlorophenylalanine (10 ╬╝L, 0.3 mg/mL), added, mixed and shaken for 10 s. Then, 300 ╬╝L of methanol-acetonitrile (2:1, v/v) added, mixed and shaken for 60 s. The solution was ultrasonically extracted on ice for 5 min, incubated at ŌłÆ20┬░C for 30 min and then centrifuged for 15 min at 3,850 g at 4┬░C. Two hundred microliters of supernatant was used for LC/MS analysis.
The LC/MS was carried out using an Ultimate 3000-Velos Pro system equipped with a binary solvent delivery manager and a sample manager, coupled with an LTQ Orbitrap mass spectrometer equipped with an electrospray interface (Thermo Fisher Scientific, Sunnyvale, CA, USA). The LC was an Acquity BEH C18 column (100 mm├Ś2.1 mm i.d., 1.7 ╬╝m; Waters, Milford, MA, USA). Separation was achieved with solvent B (acetonitrile) and solvent A (aqueous 0.1% (v/v) formic acid) with the following gradient at a flow rate of 0.40 mL/min: 5% BŌĆō25% B over 0ŌĆō1.5 min; 25% BŌĆō100% B over 1.5ŌĆō10.0 min; 100% BŌĆō100% B over 10.0ŌĆō13.0 min; 100% BŌĆō5% B over 13.0ŌĆō13.5 min; and 13.5ŌĆō14.5 min holding at 5% B. The injection volume was 3.0 ╬╝L, and the column temperature was set at 45.0┬░C. The mass spectrometric data were collected using an LTQ Orbitrap mass spectrometer equipped with an electrospray ionization source operating in either positive or negative ion mode. The capillary and source temperatures were set at 350┬░C, with a desolvation gas flow of 45 L/h. Centroid data were collected from 50 to 1,000 m/z with a 30,000 resolution.
The quality control (QC) sample was prepared by mixing aliquots of all samples into a pooled sample. Then, the QC sample was analysed using the same method as the experimental samples. The QC samples were injected at regular intervals (every 10 samples) throughout the analytical run to provide a set of data to assess repeatability.
The positive and negative data were combined to obtain a combined dataset that was imported into the SIMCA-P+ 14.0 software package (Umetrics, Ume├ź, Sweden). Principle component analysis (PCA) [11] and (orthogonal) partial least squares discriminant analysis ((O)PLS-DA) were carried out to visualize the metabolic alterations among experimental groups after mean centring and unit variance scaling. The variable importance in the projection (VIP) ranks the overall contribution of each variable to the (O)PLS-DA model, and those variables with VIP>1.0 are considered relevant for group discrimination. In this study, the default 7-round cross-validation was applied, and one-seventh of the samples were excluded from the mathematical model in each round to guard against overfitting. Significant differences in the metabolites of the two groups were analysed using the Wilcoxon rank-sum test. A heatmap of the key metabolites analyze in this process with methods similar to those previously published [12]. The correlation matrix between metabolites and ruminal bacterial species was generated using Spearman correlation coefficient and visualized by using R language.
Data describing the ruminal parameters and performance of the experimental cows have been reported in TongŌĆÖs prior study [1]. Briefly, the ruminal pH was similar in both HY and LY groups. Compared with LY group, the proportion of propionate (p = 0.08) and total VFA concentration (p<0.05) in HY group were increased, whereas the acetate to propionate ratio (p = 0.06) and the proportion of acetate (p = 0.06) in HY group showed decreasing trends. In addition, the dry matter intake was higher in HY group than LY group (p = 0.03). Compared with LY group, milk production, 4% fat-corrected milk yield and energy-corrected milk yield were significantly increased in HY group. However, there was an increasing trend in milk fat content (p = 0.08) and milk protein content (p<0.01) in LY group compared to HY group. No differences were observed in milk lactose content and somatic cell count between LY and HY groups.
In total, 10,544 practicable peaks that were unique and non-overlapping were obtained from the rumen fluid samples. After strict QC and identification, 366 metabolites were differentially detected in LY and HY groups. These metabolites were mainly glycerophosphoethanolamines, fatty acids, amino acids, peptides, carbohydrates and pyrimidines.
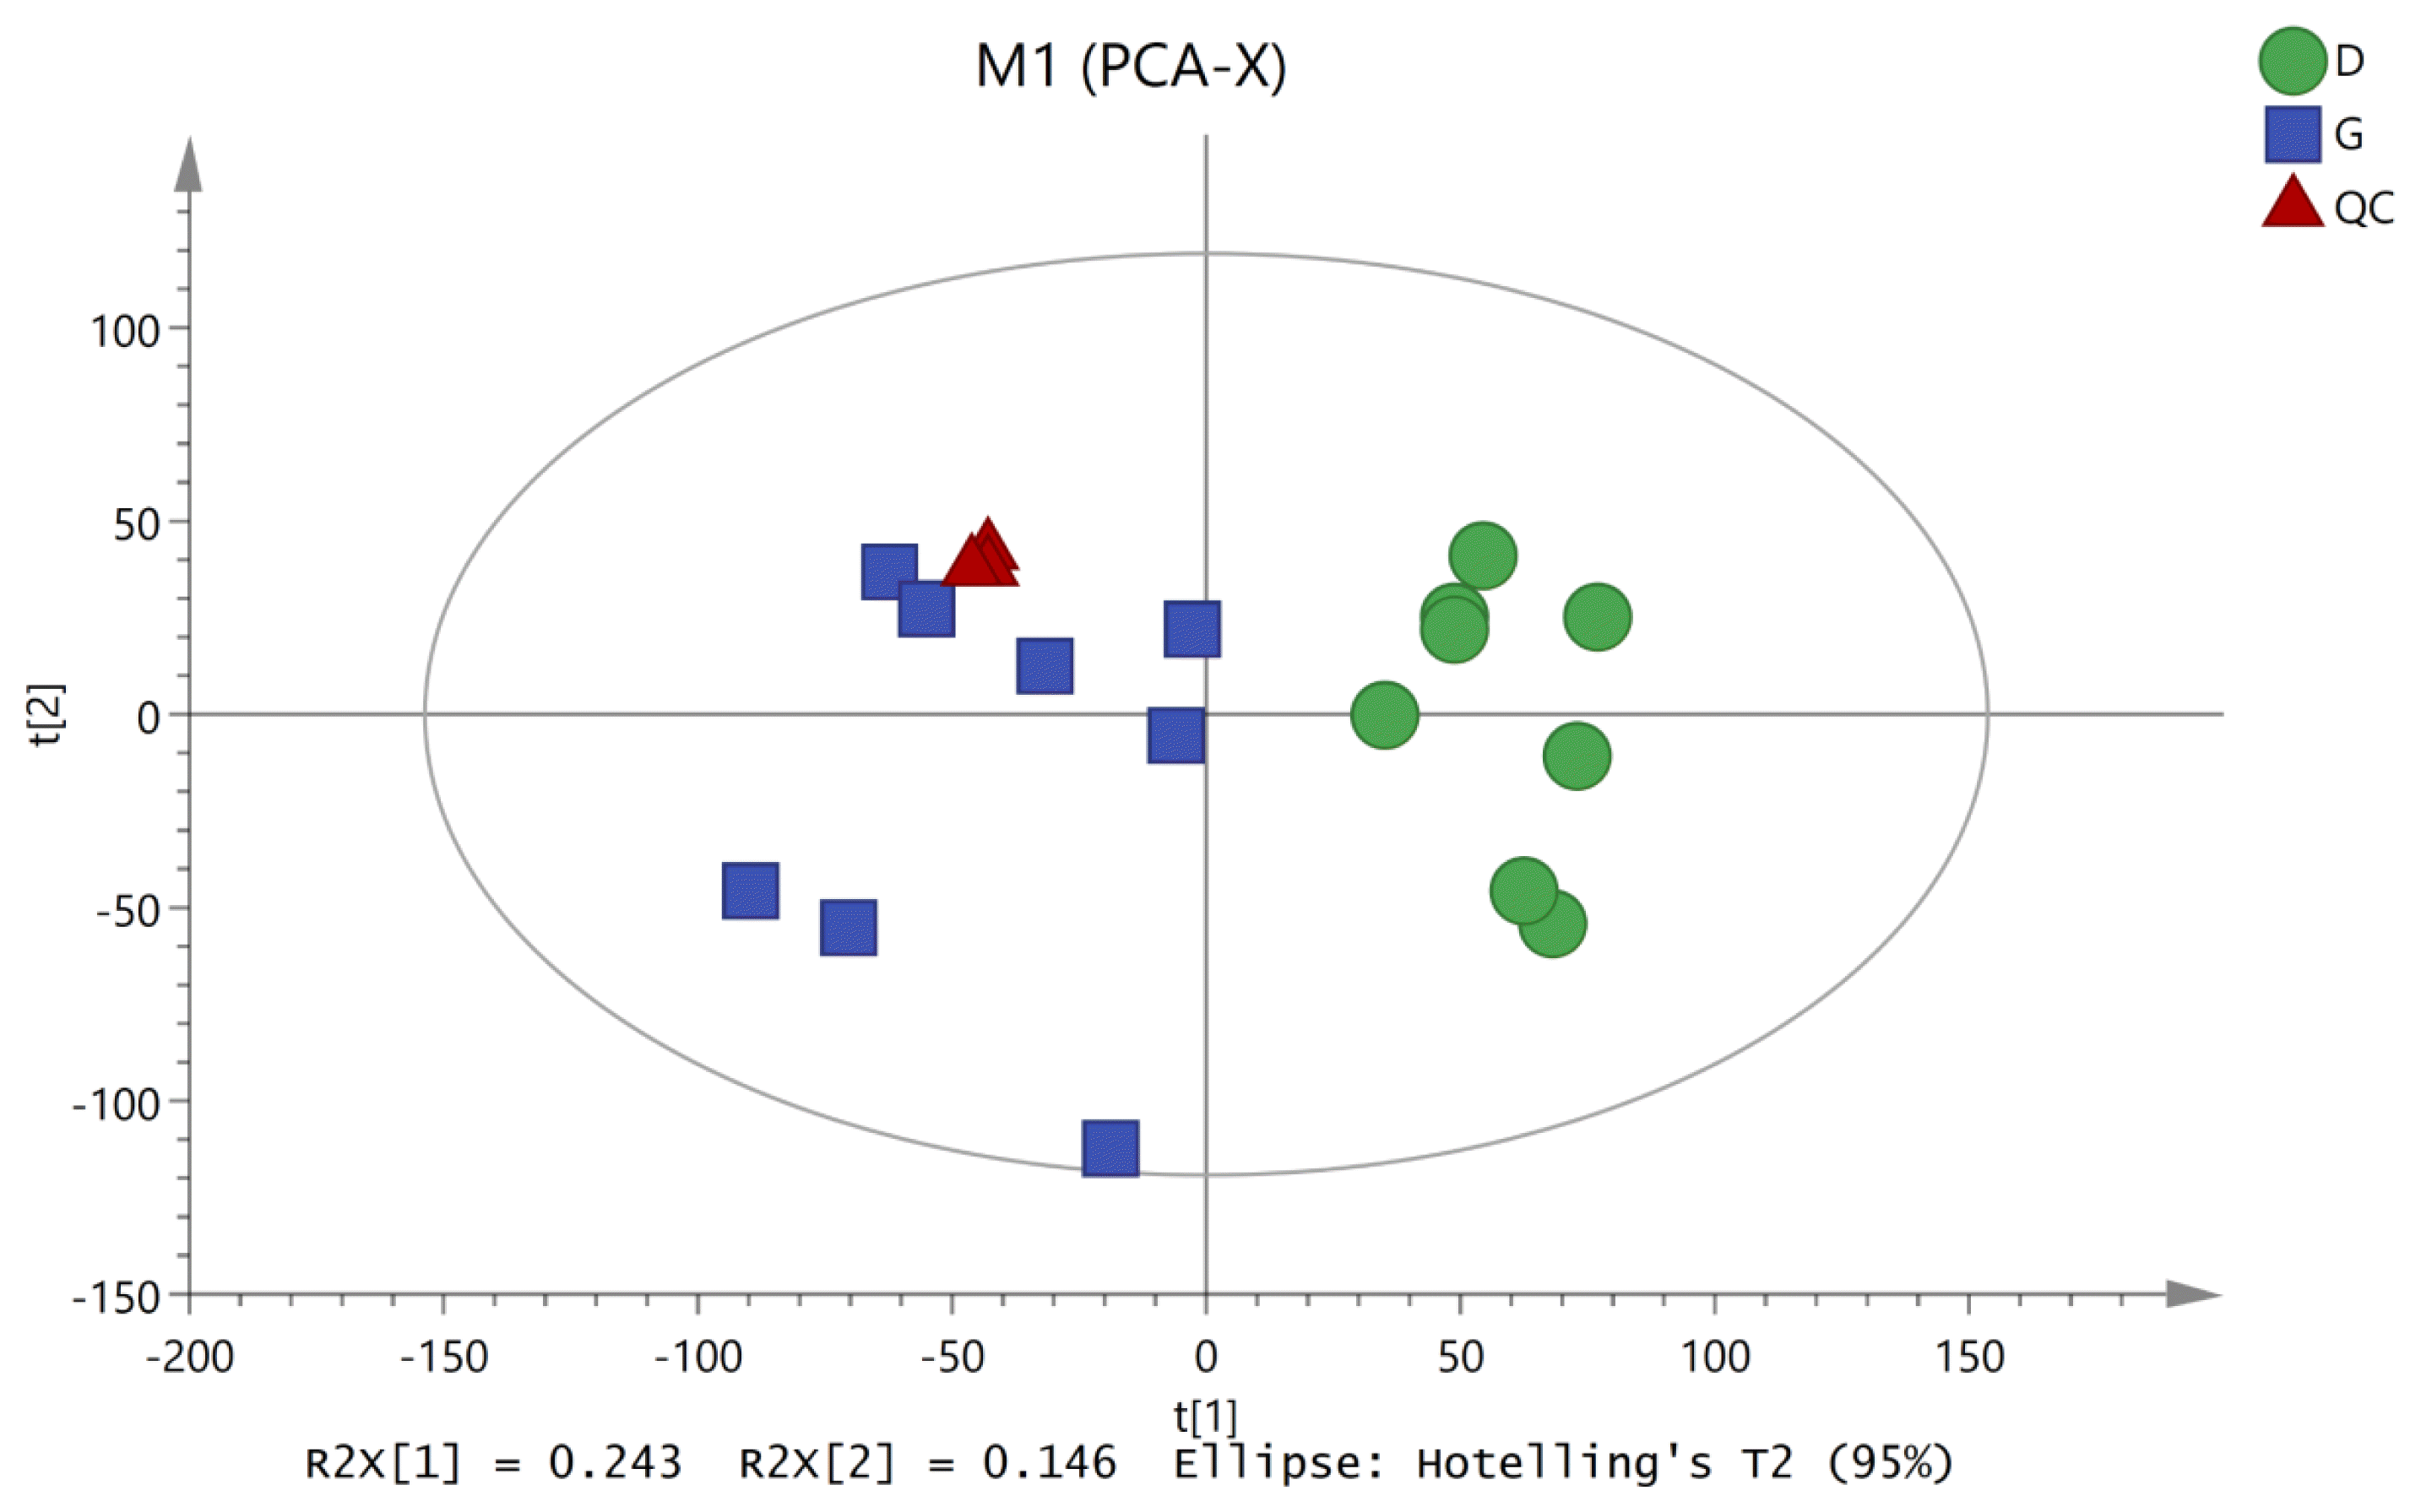
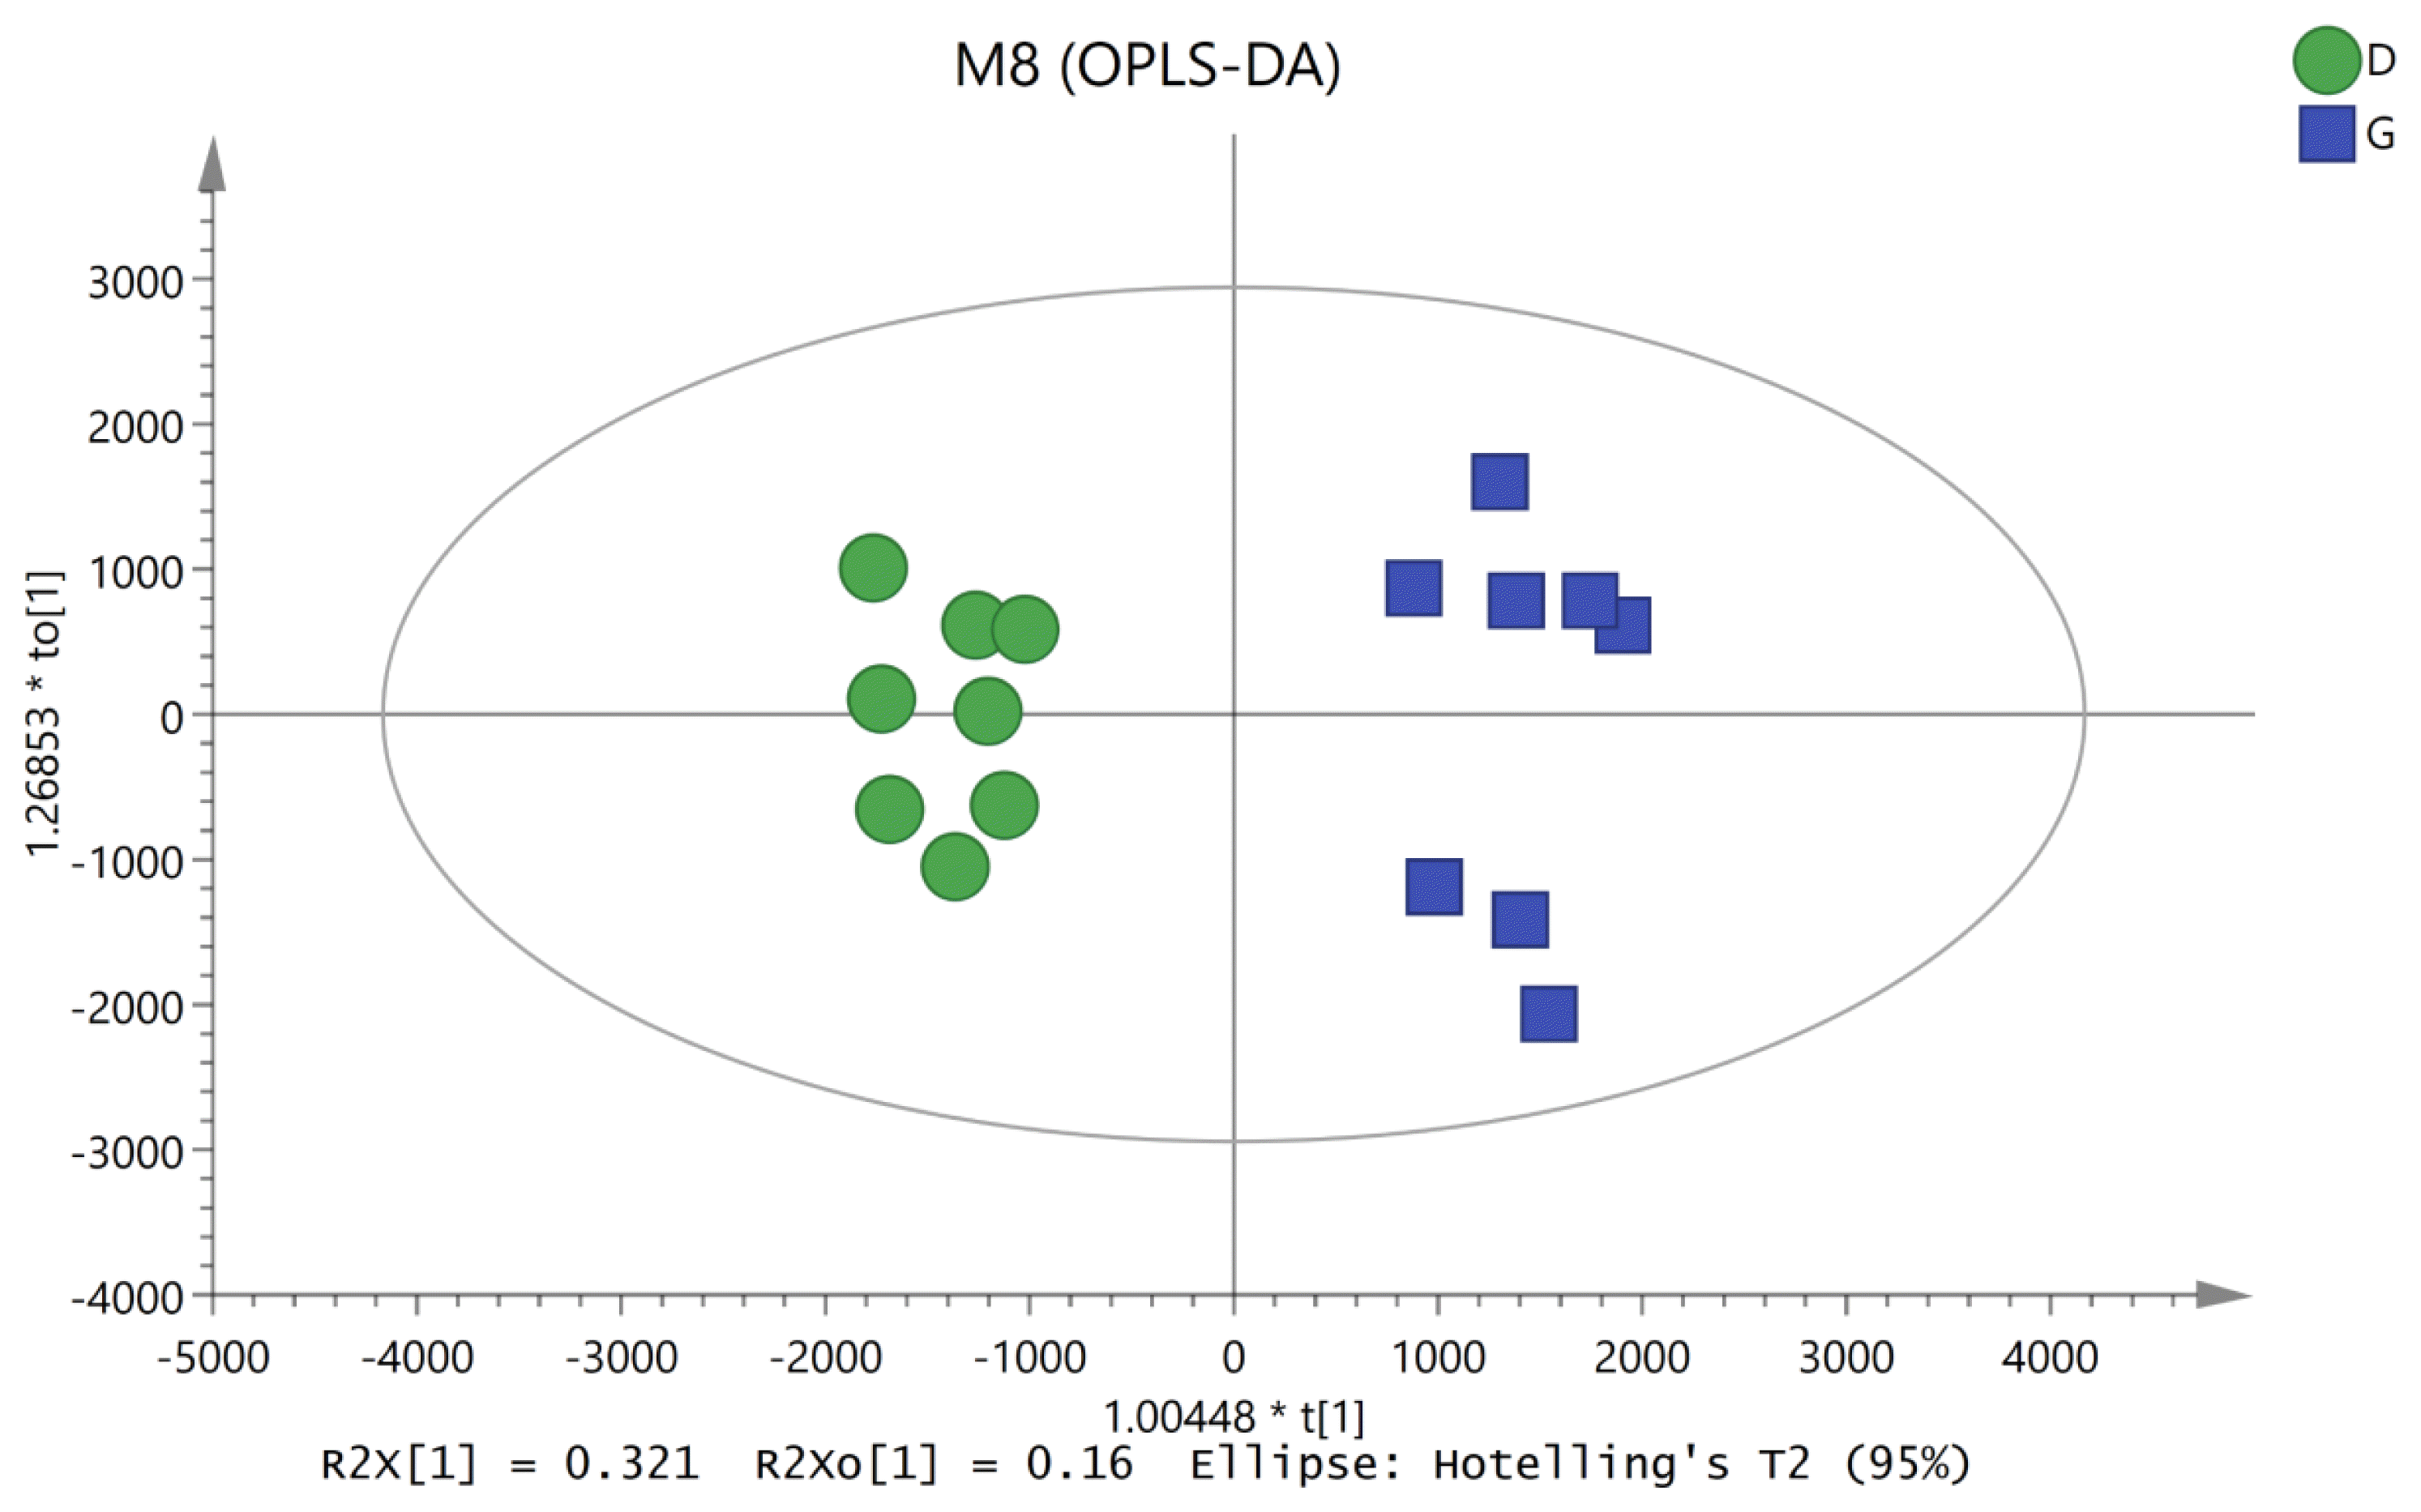
To characterize the variations in the metabolic profiles of HY and LY dairy cows, PCA and OPLS-DA were conducted. As presented on the PCA score plots (Figure 1), HY and LY groups were clearly separated; PCA 1 and PCA 2 accounted for 25.8% and 15.9% of the total variation, respectively. Furthermore, in our study, the PCA of the LC/MS data showed that all the QC samples obtained in the positive and negative ion modes mostly overlapped in the same area, which indicated that this model was stable, reproducible and consistent for all the samples. As shown in Figure 2, not surprisingly, OPLS-DA model presented that the rumen fluids of HY and LY dairy cows had significantly different and distinct metabolite compositions. Both PCA and OPLS-DA indicated that metabolites found in the rumen fluid samples of HY and LY dairy cows were markedly distinct.
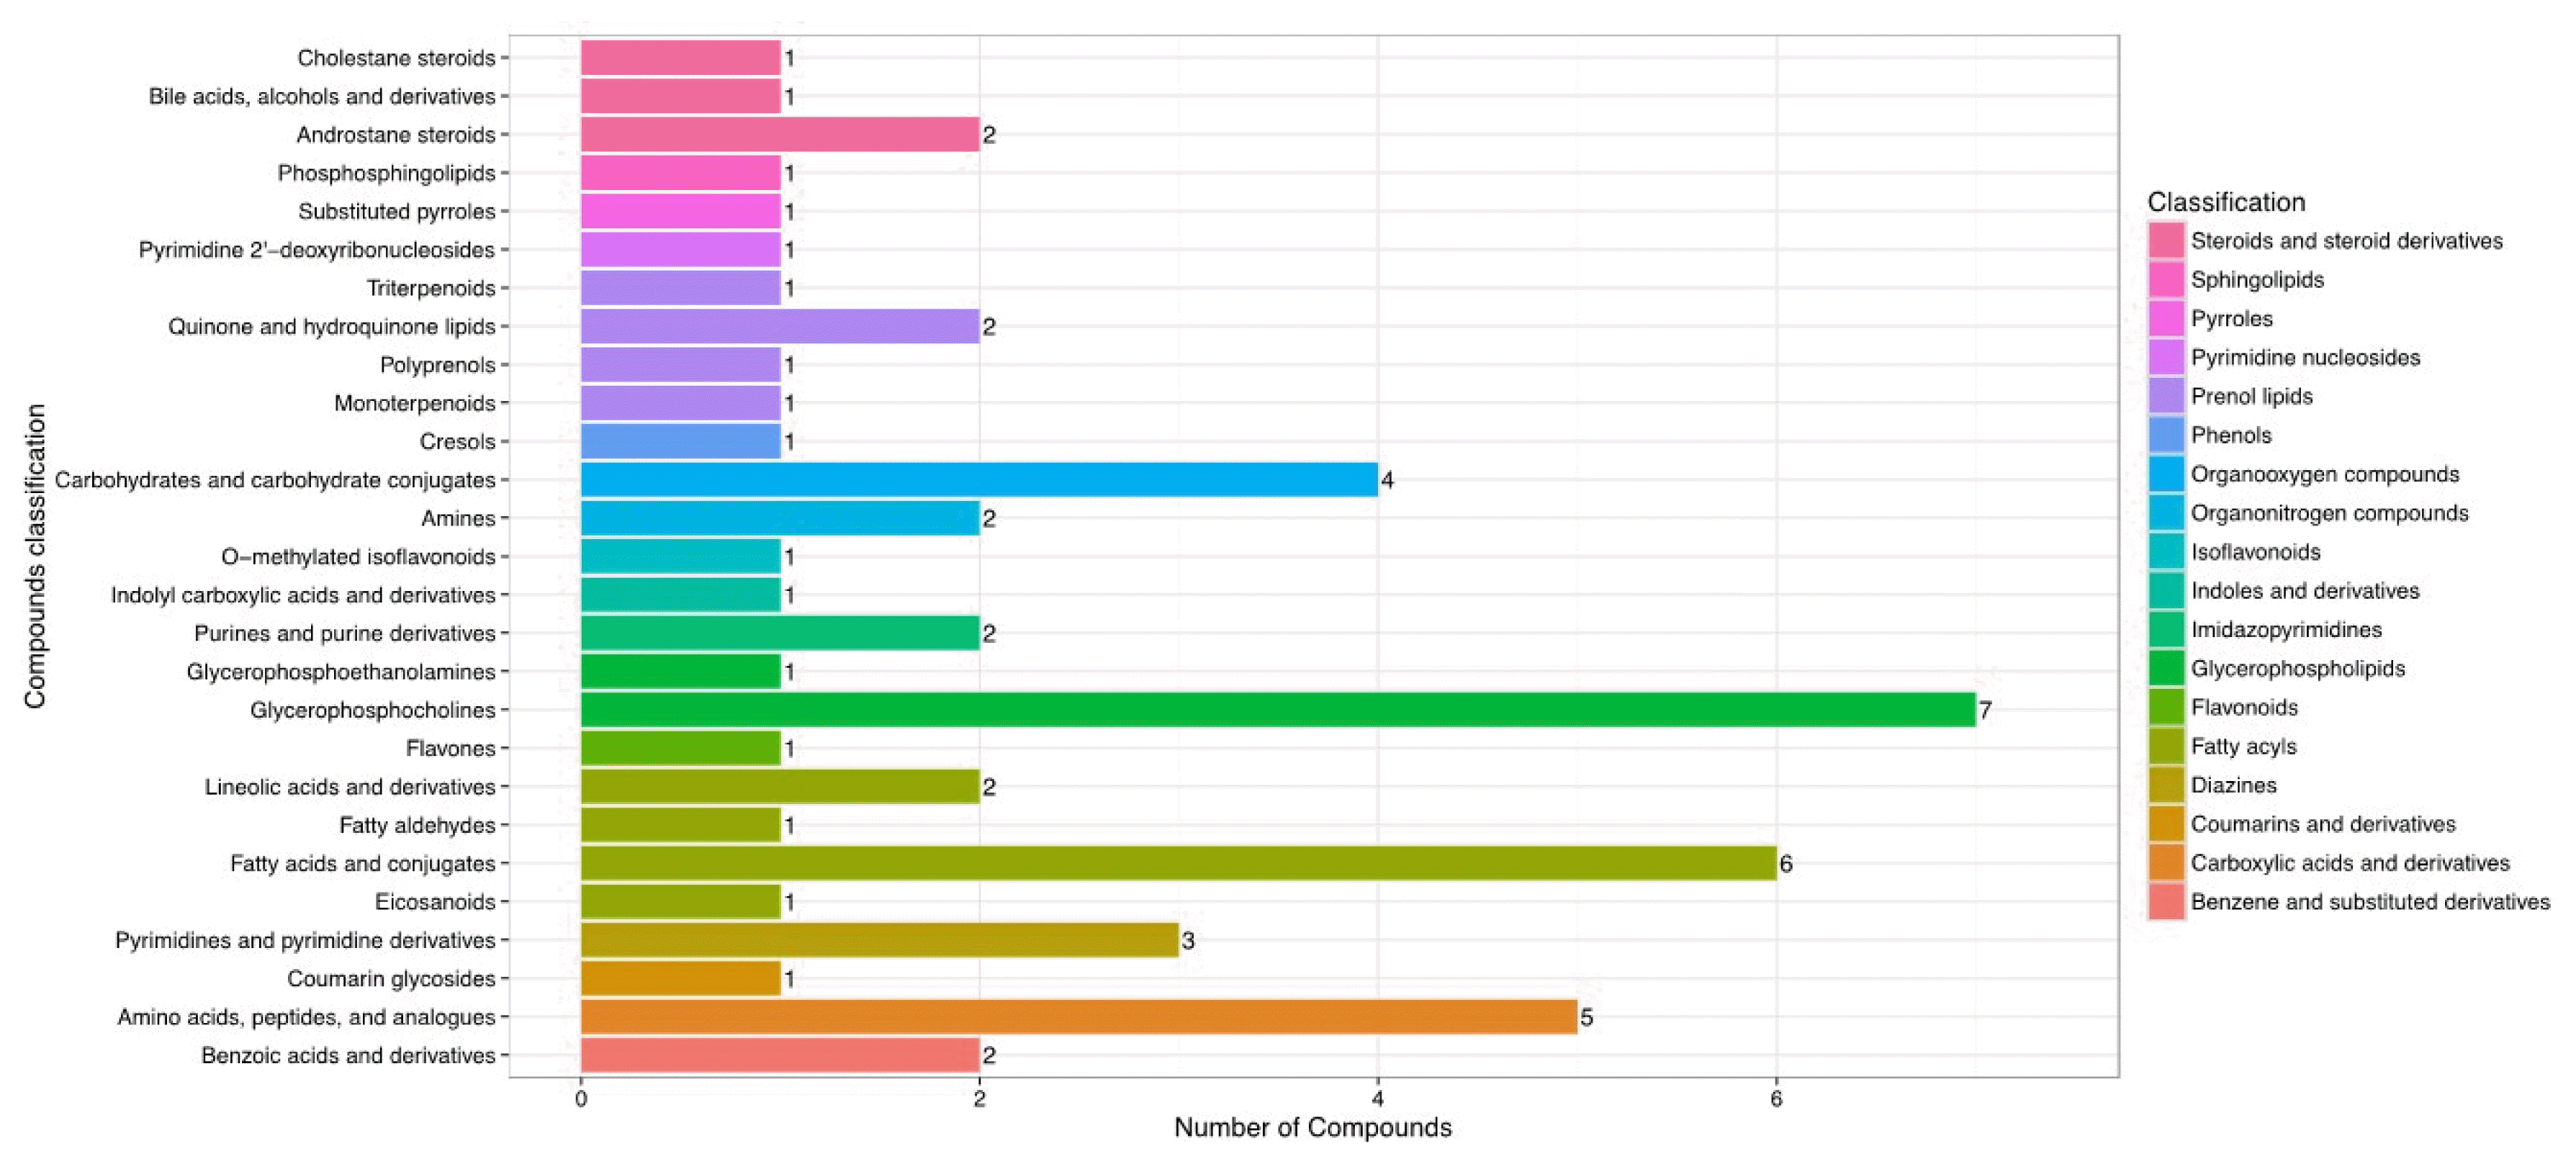
After the results of statistical analysis and the VIP value obtained from OPLS-DA were considered, 54 significantly different metabolites (p<0.05 and VIP>1) between the rumen fluids of HY and LY dairy cows were identified, as shown in Table 1. These identified metabolites were diverse and included the following: benzene and substituted derivatives; carboxylic acids and derivatives; coumarins and derivatives; diazines; fatty acyls; glycerophospholipids; indoles and derivatives; organooxygen compounds; pyrimidine nucleosides; steroids and steroid derivatives. As shown in Figure 3, each class of compound had multiple differentially abundant metabolites in the rumen fluids of HY and LY dairy cows.
Compared with HY group, 24 ruminal metabolites were significantly increased in LY group, such as 3-hydroxyanthranilic acid, carboxylic acids, carboxylic acid derivatives (L-isoleucine, L-valine, L-tyrosine, L-lysine, dimethylglycine), diazines (uracil, thymine, cytosine), palmitic acid, and imidazopyrimidines. The remaining 30 metabolites were decreased in LY group, such as gentisic acid, caprylic acid, myristic acid, linoleic acid, and glycerophospholipids (p<0.05). Interestingly, remarkable alterations in the content of carboxylic acids, carboxylic acid derivatives, coumarins, coumarin derivatives, diazines, imidazopyridines, indoles, indole derivatives, organonitrogen compounds, phenols, and pyrroles in LY and HY groups were observed in the present study. Specifically, the pyrrole metabolites and fluvastatin levels were increased by 6.06-fold (p<0.01) in LY group compared with HY group.
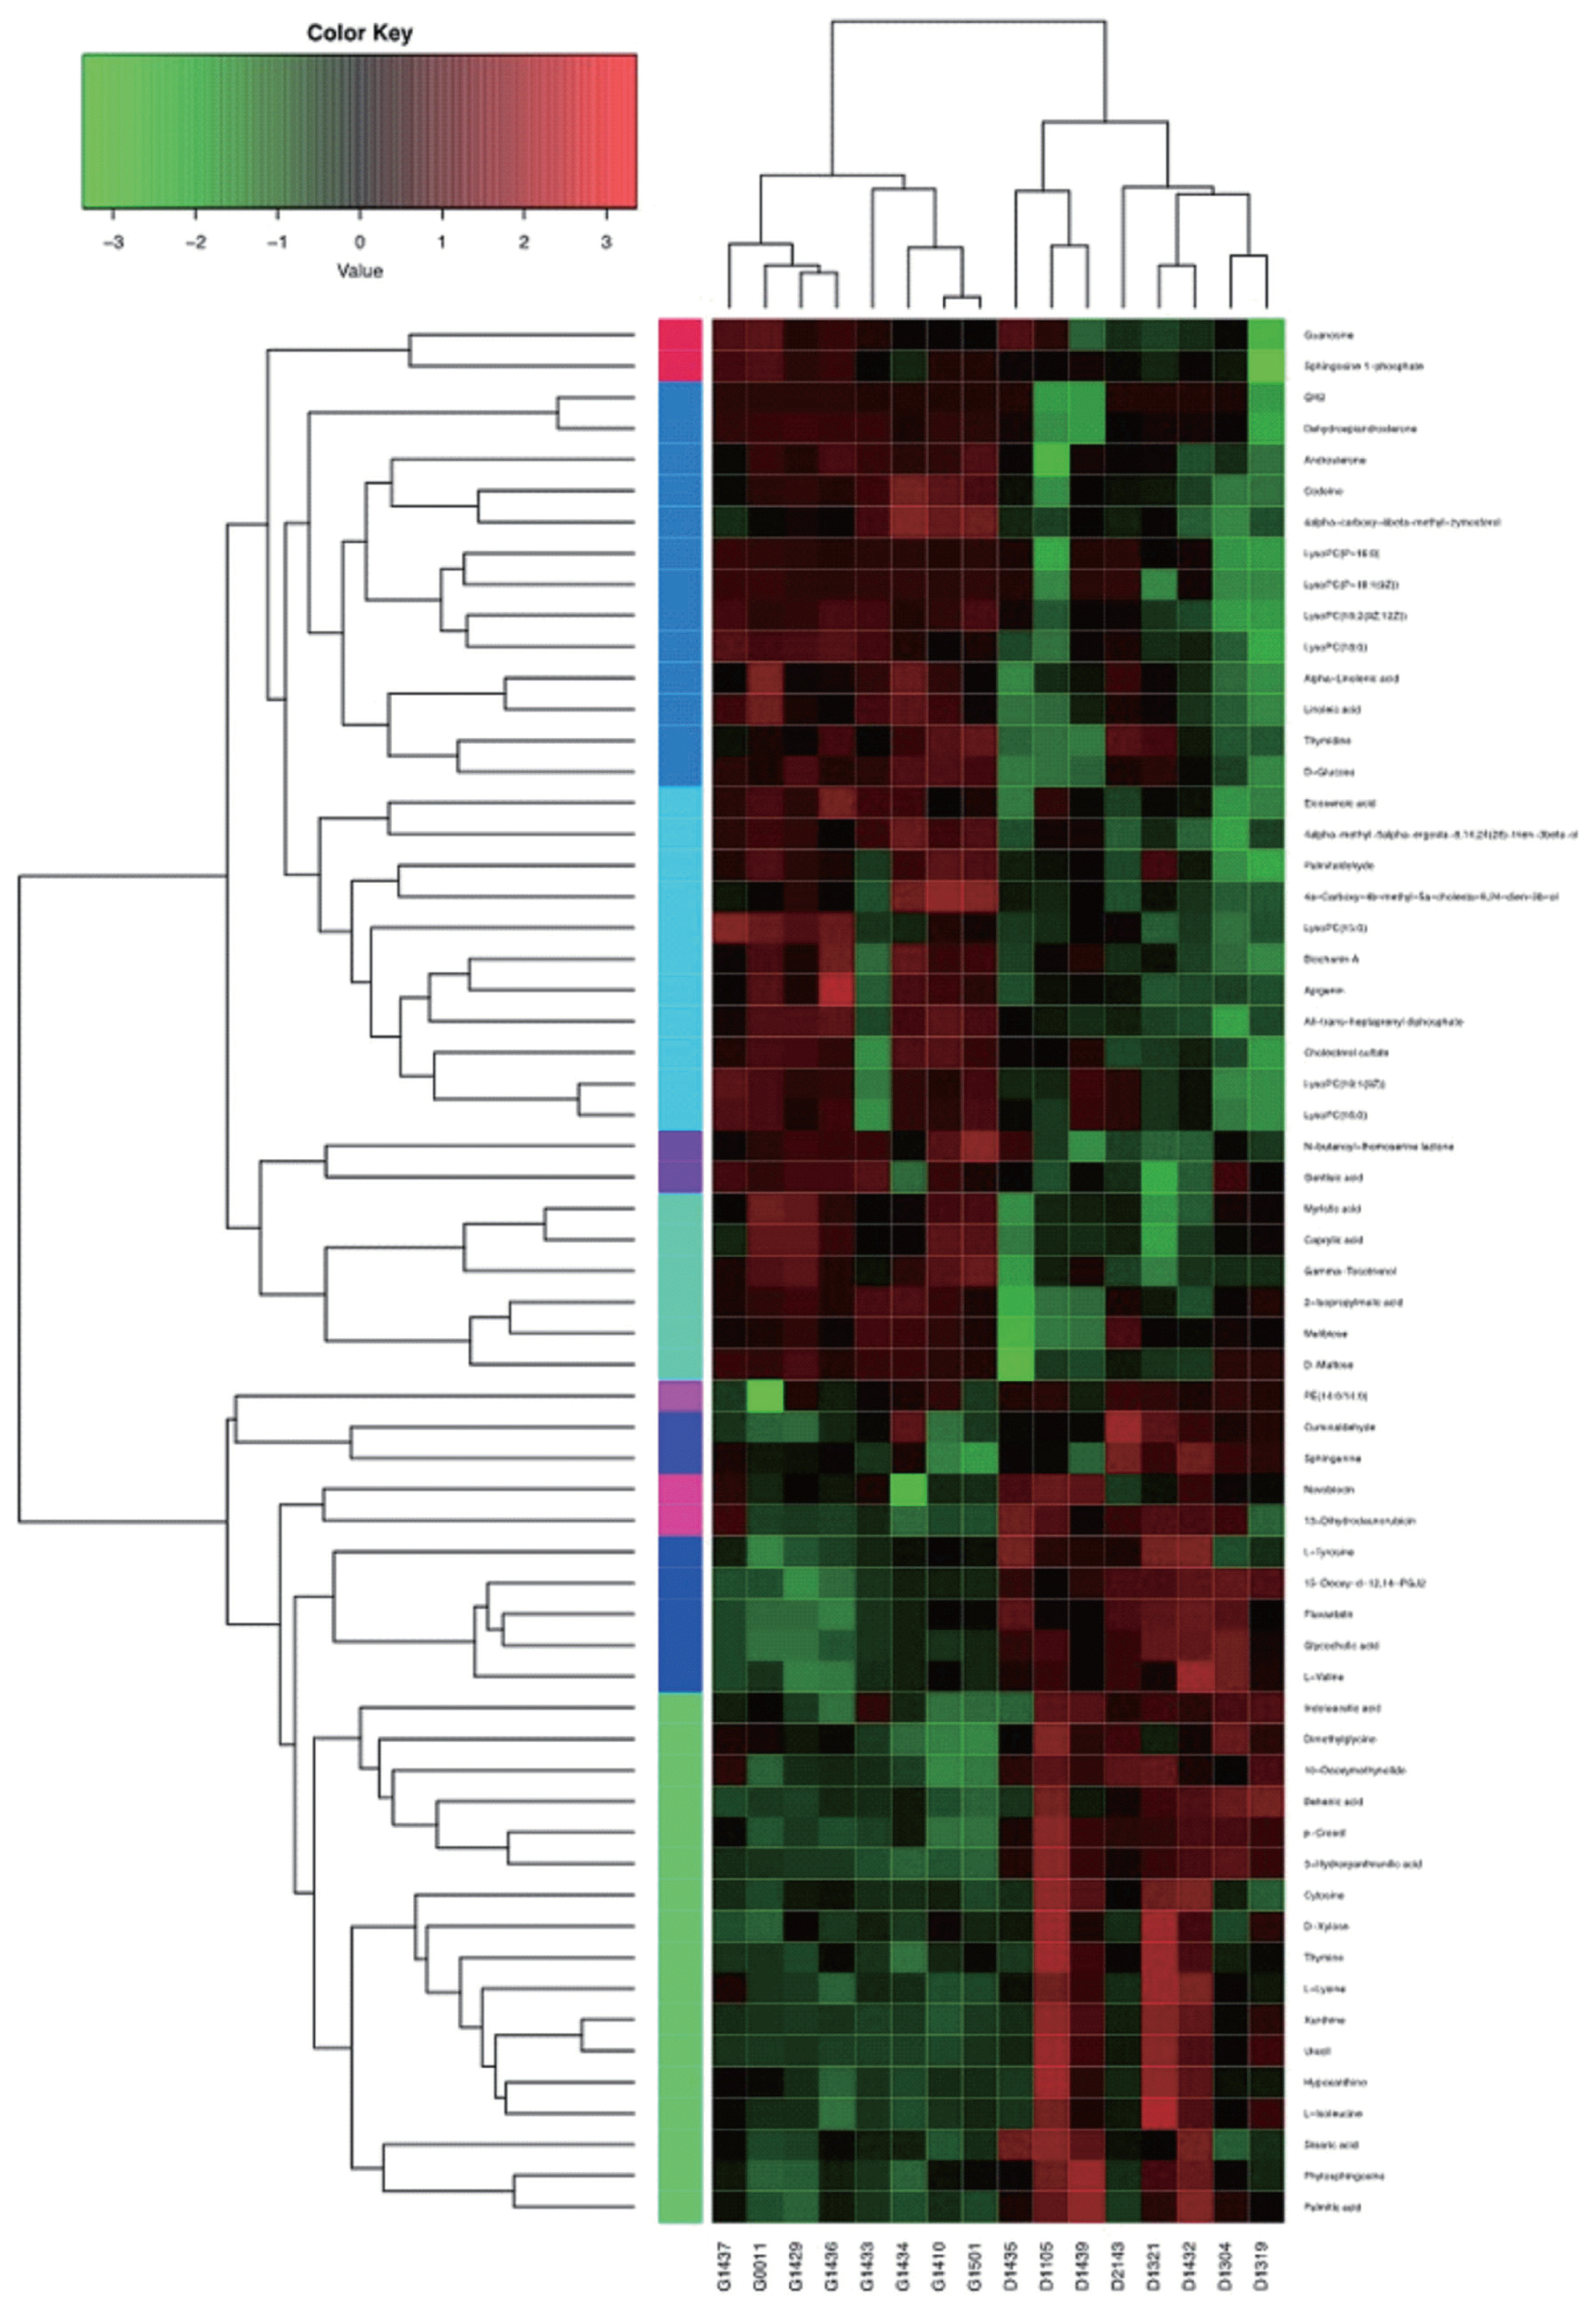
As shown in Figure 4, hierarchical clustering analysis (HCA) shows significantly changed metabolite responses to different milk yields in dairy cows, which provides a further understanding of the metabolites that differ between HY and LY dairy cows. In the present study, HCA revealed that the significantly increased metabolites in LY group compared with HY group were mainly gathered into two subclusters. As shown in the lower part of Figure 4, compared with HY group, the metabolites either increased or decreased in LY group were separated clearly and significantly different subclusters were located. One subcluster consisted of the significantly upregulated metabolites in LY group compared with HY group, such as 3-hydroxyanthranilic acid, L-lysine, thymine and uracil. The other subcluster consisted of the remarkably upregulated metabolites from HY group, including glycerophospholipids, prenol lipids, and organooxygen compounds.
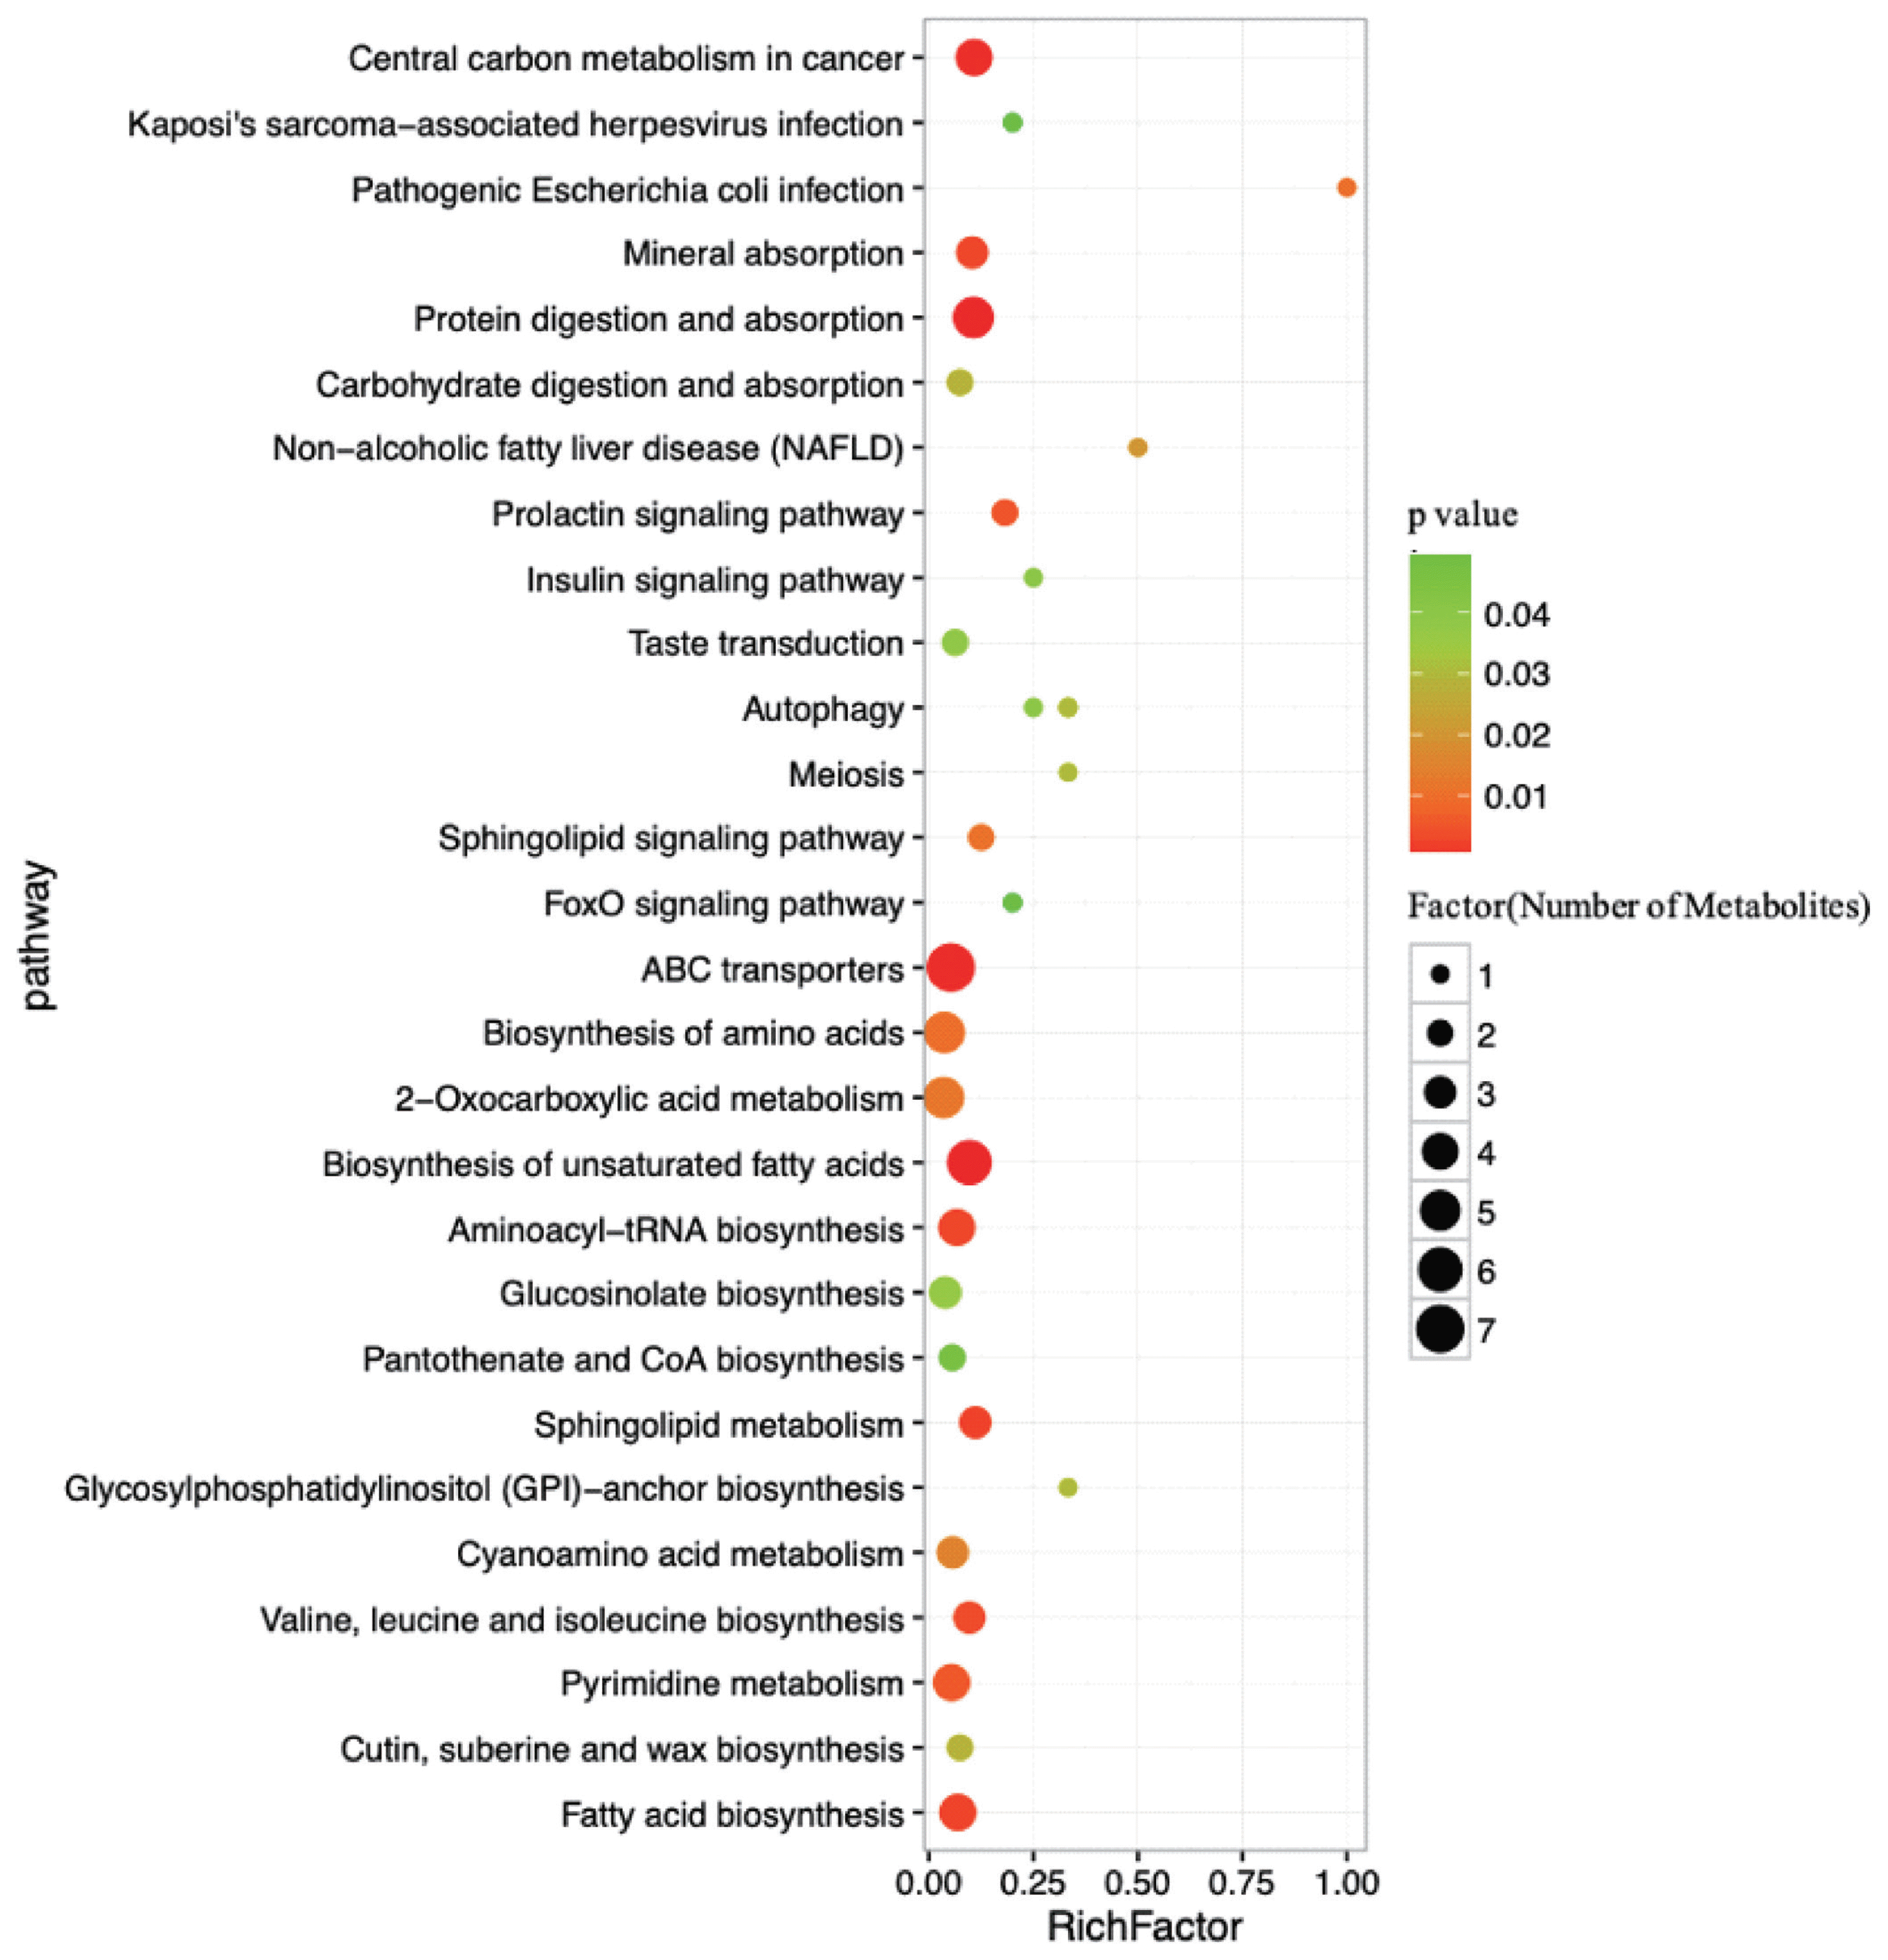
To further understand how multiple pathways alternated in response to HY and LY milk production, analysis of the functions of the pathways association with differential metabolites was subjected to the Kyoto encyclopedia of genes and genomes (KEGG). The dramatically impacted pathways identified with this enrichment analysis are shown in Table 2. ABC transporters, 2-oxocarboxylic acid metabolism, biosynthesis of amino acids, biosynthesis of unsaturated fatty acids and protein digestion and absorption were determined to be the main pathways that were different between HY and LY in the present study.
As determined by pathway topology analysis and as shown in Figure 5, 13 main metabolic pathways were enriched in our study, including the followings: ABC transporters; biosynthesis of unsaturated fatty acids; protein digestion and absorption; 2-oxocarboxylic acid metabolism; biosynthesis of amino acids; fatty acid biosynthesis; aminoacyl-tRNA biosynthesis; pyrimidine metabolism; cyanoacetic acid metabolism; glucose-inolate biosynthesis; sphingolipid metabolism; valine, leucine and isoleucine biosynthesis; and mineral absorption. Among these metabolic pathways, protein digestion and absorption, ABC transporters and biosynthesis of unsaturated fatty acids were the three most impacted pathways between the two groups, as determined by the richness factor values.
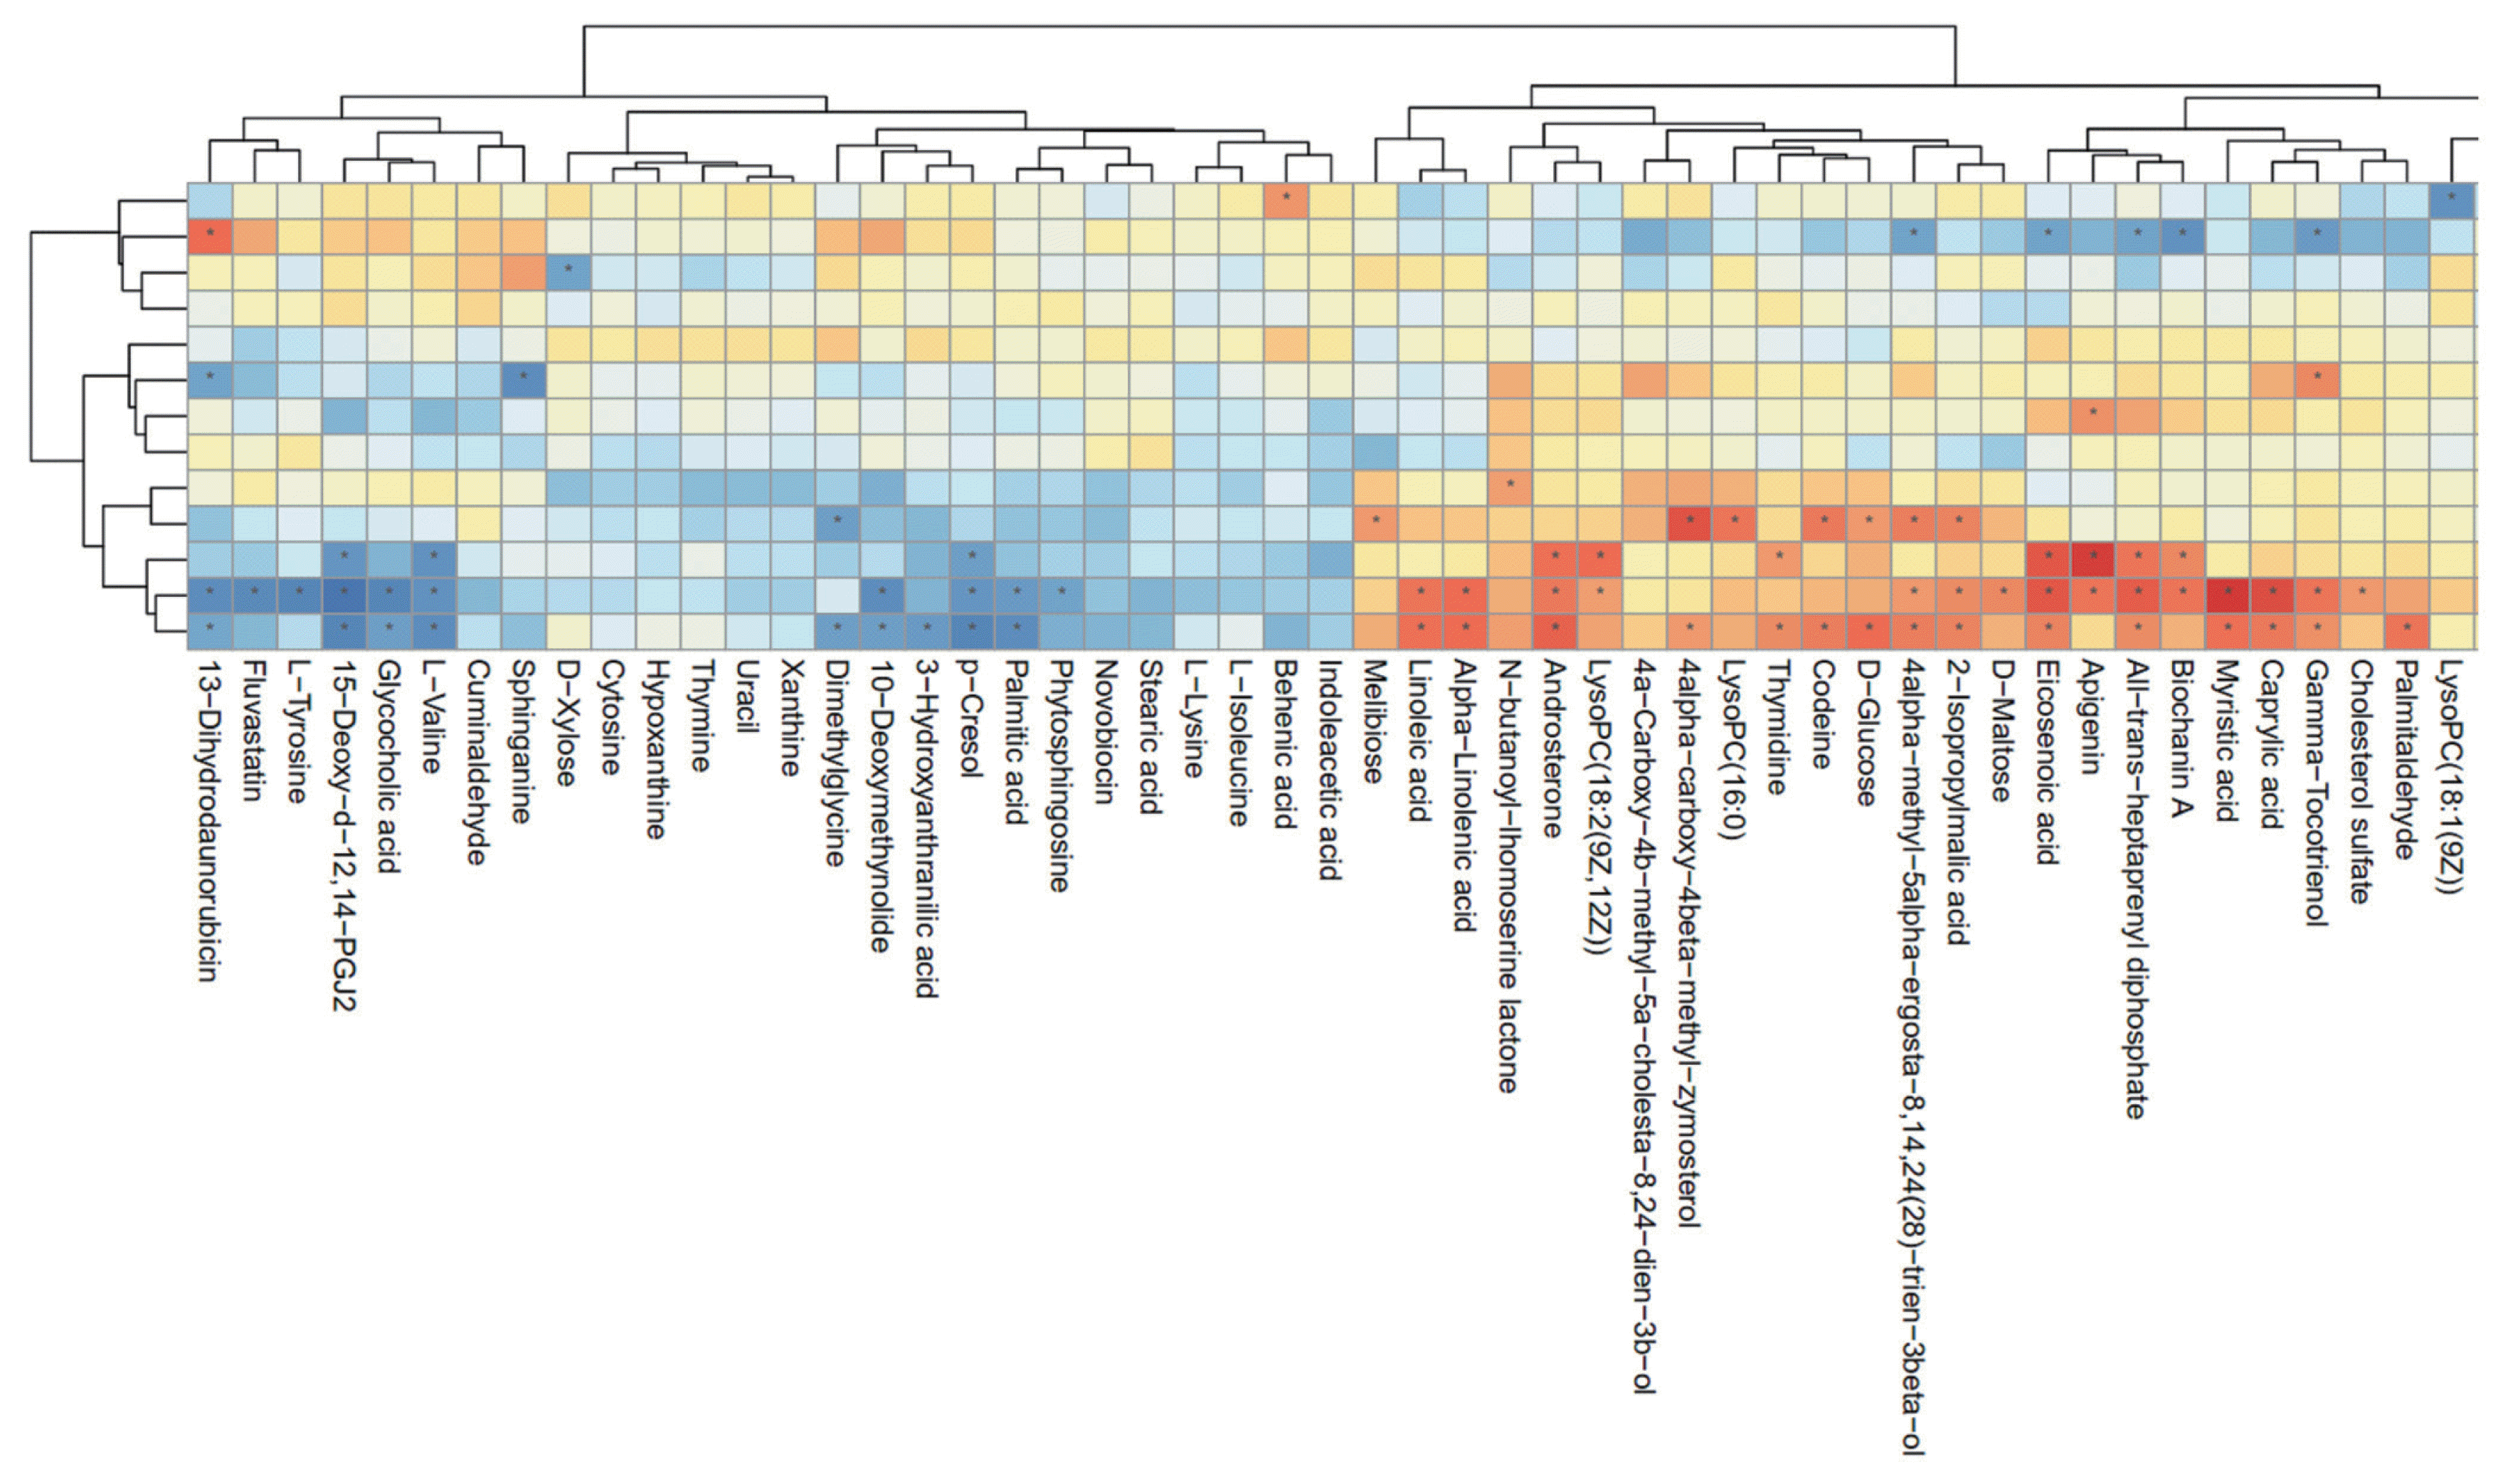
For further understanding of the functional correlation between the perturbations in the ruminal microbiome and metabolites as a result of different levels of milk production, Spearman correlation coefficient analysis was conducted in the present study. Clear correlations were identified between the perturbed ruminal microbiome and altered metabolite profiles (r>0.5 or <ŌłÆ0.5, p<0.05). Figure 6 shows that several definite metabolites were greatly correlated with specific ruminal bacteria, which established the functional correlation between the microbiome and metabolites in rumen. It was found that Firmicutes, Actinobacteria, and Synergistetes phyla were highly correlated with most metabolites. Additionally, Bacteroidetes phylum was significantly correlated with only D-xylose, Saccharibacteria was significantly correlated with only apigenin, and Fibrobacteres was significantly correlated with only N-butanoyl-homoserine lactone.
In the present study, LC/MS metabolomics was used to evaluate the metabolites in the ruminal fluid of HY and LY dairy cows. We also wanted to investigate whether the observed changes in metabolites could provide further insight into specific ruminal microflora-related changes and aimed to provide a new perspective regarding perturbations of ruminal metabolism to reveal the mechanism of ruminal digestion in dairy cows with different milk yields.
Our results showed a clear separation of the ruminal metabolites in HY and LY dairy cows, indicating significant differences in metabolic composition. In the present study, L-isoleucine, L-valine, L-tyrosine, L-lysine, and dimethylglycine were significantly increased in LY group than HY group. Allison [13] previously reported that valine is generated from the main substrates pyruvate and isobutyrate. In addition, pyruvate can be converted to lactate by lactate dehydrogenase [14] or to acetyl coenzyme-A and formate by pyruvate formate-lyase [15], then acetyl-CoA is converted either to acetate or ethanol. Moreover, Andries et al [16] reported that branched chain fatty acids are also synthesized from deamination of the amino acids valine, isoleucine, leucine, and proline. Our previous study showed that acetate was remarkably increased in LY group compared with HY group, which further suggested increased substrate for amino acid synthesis. Furthermore, the enriched pathways observed in the present study, including aminoacyl-tRNA biosynthesis, amino acid biosynthesis, cyanoamino acid metabolism, glucosinolate biosynthesis, pantothenate and CoA biosynthesis as well as protein digestion and absorption, also confirmed the above hypothesis. Thus, we can reasonably speculate that high levels of acetate could promote the biosynthesis of amino acids in the rumen, and thereby this metabolite could reflect the condition of digestion in the rumen.
Moreover, compared with LY group, myristic acid, palmitaldehyde, linoleic acid, and alpha-linolenic acid were significantly increased in HY group. The concentrations of ruminal long-chain fatty acids are indicative of active lipolysis, biohydrogenation and microbial fatty acid synthesis in the rumen [17]. Additionally, before these unsaturated fatty acids can be rapidly hydrogenated by microbes into saturated end products, lipases, galactosidases, and phospholipases produced by ruminal microbes remove nonesterified fatty acids [18]. Furthermore, palmitic acid, linoleic acid and alpha-linolenic acid were reported could be as sensitive and specific candidate biomarkers to distinguish low- and high-quality steers [19]. Therefore, it could be concluded that these fatty acids were detected at relatively high levels due to the microbial fermentation in the rumen of HY group; microbial fermentation and the efficient absorption of violate fatty acids may explain the mechanism of different milk yields.
One remarkable alteration observed in this study were the increased levels of D-maltose and D-glucose in HY group compared with LY group. The nutrients in the diet could be degraded to maltose by amylase and then to glucose by maltase or maltose phosphorylase in the rumen. Previous research has also indicated that high levels of glucose promote the production of pyruvate in the rumen [20,21]. Glucose is the major monosaccharide liberated during the degradation of starch, and it can be converted into a number of different polyols and amino acids via the glycolytic pathway and its branches [22]. Microorganisms convert carbohydrates to pyruvate and acetyl-CoA by glycolytic pathway and pentose phosphate pathway [14]. Furthermore, previous studies demonstrated that carbohydrate metabolism caused significant increases in lactate and propionate concentration as well as decline in the acetate concentration [8,23], which was in accordance with our previous results that acetate levels were lower and propionate levels were greater in HY dairy cows relative to the LY dairy cows. It has also been reported that diets rich in readily available carbohydrates are associated with alterations in the rumen microbiota, which are followed by significant changes in the metabolic pathways of the rumen [8,24]. Interestingly, our correlation results revealed that D-glucose was significantly positively correlated with Firmicutes and that D-maltose was significantly positively correlated with Actinobacteria. Based on our integrated pathway analysis, it is reasonable to conclude that D-maltose and D-glucose metabolites were increased in HY group compared with LY group.
One of the most interesting observations from this study was that phyla of the ruminal microbiome were specifically correlated with the different metabolites detected in HY and LY dairy cows. It is well known that ruminal metabolites do not independently exist, and a comprehensive understanding of the variation in other metabolites is warranted. In the present study, Firmicutes was mostly correlated with fatty acyls. Furthermore, it has been reported that Firmicutes plays an important role in milk production [25]. Thus, it could be suggested that the fatty acyl metabolites contributed to the increased abundance of these bacteria in the rumen fluid. Therefore, these correlations of ruminal metabolites with the ruminal microbiome can reflect metabolic processes. Additionally, Bacteroidetes was significantly negatively correlated with only D-xylose, and D-xylose level was significantly increased in HY group compared with LY group. Accumulated evidence strongly suggests that the metabolic alterations associated with microbiome perturbations are important biomarkers that indicate the health [19], nutrition [26], or dietary changes in response to the physiology [27] of dairy cows. Taken together, these results indicate that rumen microbes promote protein degradation in HY dairy cows, which provides a better understanding of the difference in the milk proteins of the two groups. Therefore, correlations between ruminal metabolites and ruminal microbiome in the present study may provide new information for advanced understanding of complex rumen metabolism.
These data indicated that not only the metabolites in the ruminal fluids were significantly different between HY and LY cows, but also these metabolites associated with the ruminal microbiota affected the metabolic function. These highly correlated metabolites may be potential biomarkers for the measurement of digestive and rumen function. In this study, the integration of the high-throughput sequencing of the ruminal microbiome and metabolomics should provide new insight to improve the understanding of the physiological and metabolic mechanisms involved in milk production. Moreover, these findings suggest that due to hostŌĆōmicrobiota interactions, dairy cows with different milk yields have different metabolite content, which are most likely correspond to definite differences between ruminal fermentation and milk component.
ACKNOWLEDGMENTS
This study was financially supported by the Project of National Nature Science Foundation of China (Grant No. 31772629, No. 31802091 and No. 31702302), the Beijing Municipal Education Commission Project (SQKM201710020011), the Open Project Program of Beijing Key Laboratory of Dairy Cow Nutrition, and the National Key Research and Development Plan (2016YFD0700205, 2016YFD0700201, 2017YFD 0701604). Jinjin Tong thanks the China postdoctoral science foundation and the Beijing postdoctoral science foundation.
Figure┬Ā1
Principal component analysis (PCA) of the liquid chromatography/mass spectrometry metabolite profiles of the quality control (QC), high-yield and low-yield dairy cow rumen fluid samples. The green circles represent low-yield cows, the blue squares represent high-yield cows, and the red triangles represent the QC samples.
Figure┬Ā2
Orthogonal correction partial least squares discriminant analysis (OPLS-DA) derived from the liquid chromatography/mass spectrometry metabolite profiles of the ruminal fluid samples from high-yield (HY) and low-yield (LY) group dairy cows. The green circles represent LY cows, and the blue squares represent HY cows.
Figure┬Ā3
Different metabolite contents in the ruminal fluid between high-yield and low-yield group dairy cows.
Figure┬Ā4
Hierarchical clustering analysis for identified the different metabolites from the ruminal fluid of high-yield and low-yield dairy cows. Cells were coloured based on the signal intensity detected in the ruminal samples: light red squares represent high content in the rumen; green squares represent low content and black represents intermediate levels.
Figure┬Ā5
Pathways associated with the metabolites identified in both the high- and low-milk-yield dairy cows. The x-axis represents the pathway richness factor, and the y-axis represents the pathway name. Large sizes and dark colours represent a large number of metabolites and high pathway impact values, respectively.
Figure┬Ā6
Correlation plot showing the correlation between the perturbed ruminal bacteria phyla and altered ruminal metabolites (* p<0.05).
Table┬Ā1
Differential metabolites in the ruminal fluid of high-yield and low-yield group dairy cows
| Metabolites | Compound ID | Formula | m/z | Retention time (min) | VIP value | FC1) (D/G) | p-value |
|---|---|---|---|---|---|---|---|
| Benzene and substituted derivatives | |||||||
| ŌĆā3-Hydroxyanthranilic acid | HMDB01476 | C7H7NO3 | 171.08 | 10.42 | 7.13 | 2.21 | 0.00 |
| ŌĆāGentisic acid | HMDB0000152 | C7H6O4 | 153.02 | 3.12 | 2.72 | 0.80 | 0.02 |
| Organic acids and derivatives | |||||||
| ŌĆāL-Isoleucine | HMDB00172 | C6H13NO2 | 132.10 | 1.05 | 7.81 | 1.44 | 0.01 |
| ŌĆāL-Valine | HMDB00883 | C5H11NO2 | 100.08 | 1.50 | 4.32 | 1.53 | 0.00 |
| ŌĆāL-Tyrosine | HMDB00158 | C9H11NO3 | 164.07 | 3.62 | 2.87 | 1.82 | 0.01 |
| ŌĆāL-Lysine | HMDB00182 | C6H14N2O2 | 147.11 | 0.57 | 2.18 | 1.98 | 0.01 |
| ŌĆāDimethylglycine | HMDB00092 | C4H9NO2 | 86.06 | 1.02 | 1.45 | 1.34 | 0.01 |
| Coumarins and derivatives | |||||||
| Novobiocin | HMDB0015185 | C31H36N2O11 | 593.22 | 4.72 | 1.09 | 1.89 | 0.04 |
| Diazines, pyridine | |||||||
| ŌĆāUracil | HMDB00300 | C4H4N2O2 | 113.03 | 0.80 | 2.66 | 1.83 | 0.00 |
| ŌĆāThymine | HMDB00262 | C5H6N2O2 | 127.05 | 1.00 | 2.53 | 1.36 | 0.01 |
| ŌĆāCytosine | HMDB00630 | C4H5N3O | 112.05 | 0.65 | 1.27 | 1.84 | 0.03 |
| Fatty acyls | |||||||
| ŌĆā15-Deoxy-d-12,14-PGJ2 | HMDB05079 | C20H28O3 | 334.24 | 4.72 | 1.22 | 1.71 | 0.00 |
| ŌĆāPalmitic acid | HMDB00220 | C16H32O2 | 274.27 | 5.86 | 10.94 | 1.44 | 0.00 |
| ŌĆāBehenic acid | HMDB00944 | C22H44O2 | 358.37 | 13.16 | 4.22 | 2.70 | 0.00 |
| ŌĆāStearic acid | HMDB00827 | C18H36O2 | 302.31 | 7.03 | 2.42 | 1.24 | 0.02 |
| ŌĆāCaprylic acid | HMDB0000482 | C8H16O2 | 287.22 | 5.54 | 1.17 | 0.35 | 0.00 |
| ŌĆā2-Isopropylmalic acid | HMDB0000402 | C7H12O5 | 221.07 | 0.65 | 1.11 | 0.43 | 0.00 |
| ŌĆāMyristic acid | HMDB0000806 | C14H28O2 | 273.21 | 5.37 | 1.06 | 0.13 | 0.02 |
| ŌĆāPalmitaldehyde | HMDB0001551 | C16H32O | 285.24 | 9.04 | 2.30 | 0.58 | 0.01 |
| ŌĆāLinoleic acid | HMDB00673 | C18H32O2 | 561.49 | 9.70 | 3.71 | 0.29 | 0.00 |
| ŌĆāAlpha-Linolenic acid | HMDB01388 | C18H30O2 | 279.23 | 8.86 | 1.75 | 0.57 | 0.01 |
| Flavonoids | |||||||
| ŌĆāApigenin | HMDB0002124 | C15H10O5 | 269.05 | 4.72 | 1.57 | 0.33 | 0.03 |
| Glycerophospholipids | |||||||
| ŌĆāLysoPC (16:0) | HMDB0010382 | C24H50NO7P | 540.33 | 7.34 | 4.80 | 0.43 | 0.02 |
| ŌĆāLysoPC (15:0) | HMDB0010381 | C23H48NO7P | 480.31 | 8.56 | 4.32 | 0.39 | 0.01 |
| ŌĆāLysoPC (18:0) | HMDB10384 | C26H54NO7P | 524.37 | 8.50 | 3.69 | 0.18 | 0.00 |
| ŌĆāLysoPC (18:1(9Z)) | HMDB02815 | C26H52NO7P | 522.36 | 7.28 | 3.19 | 0.10 | 0.00 |
| ŌĆāLysoPC (18:2(9Z,12Z)) | HMDB10386 | C26H50NO7P | 520.34 | 6.57 | 2.54 | 0.17 | 0.00 |
| ŌĆāLysoPC (P-18:1(9Z)) | HMDB10408 | C26H52NO6P | 506.36 | 7.81 | 2.32 | 0.21 | 0.00 |
| ŌĆāLysoPC (P-16:0) | HMDB10407 | C24H50NO6P | 480.34 | 7.54 | 2.21 | 0.26 | 0.00 |
| ŌĆāPhosphatidylethanolamine (PE; 14:0/14:0) | HMDB0008821 | C33H66NO8P | 634.44 | 11.00 | 2.31 | 2.93 | 0.03 |
| Imidazopyrimidines | |||||||
| ŌĆāHypoxanthine | HMDB00157 | C5H4N4O | 137.05 | 0.82 | 6.02 | 1.48 | 0.03 |
| ŌĆāXanthine | HMDB00292 | C5H4N4O2 | 153.04 | 0.83 | 2.44 | 1.77 | 0.00 |
| Indoles and derivatives | |||||||
| ŌĆāIndoleacetic acid | HMDB0000197 | C10H9NO2 | 220.06 | 3.82 | 1.14 | 3.14 | 0.00 |
| Isoflavonoids | |||||||
| ŌĆāBiochanin A | HMDB0002338 | C16H12O5 | 329.07 | 4.78 | 1.39 | 0.52 | 0.01 |
| Organonitrogen compounds | |||||||
| ŌĆāPhytosphingosine | LMSP01030001 | C18H39NO3 | 318.30 | 5.90 | 9.58 | 1.43 | 0.01 |
| ŌĆāSphinganine | HMDB00269 | C18H39NO2 | 284.29 | 10.46 | 3.50 | 1.27 | 0.04 |
| Organooxygen compounds | |||||||
| ŌĆāD-Maltose | HMDB00163 | C12H22O11 | 365.11 | 0.63 | 5.23 | 0.56 | 0.00 |
| ŌĆāD-Glucose | HMDB0000122 | C6H12O6 | 225.06 | 0.66 | 4.60 | 0.52 | 0.00 |
| ŌĆāMelibiose | HMDB0000048 | C12H22O11 | 387.11 | 0.66 | 2.55 | 0.59 | 0.03 |
| ŌĆāD-Xylose | HMDB00098 | C5H10O5 | 173.04 | 0.63 | 1.02 | 1.54 | 0.04 |
| Phenols | |||||||
| ŌĆāp-Cresol | HMDB01858 | C7H8O | 91.05 | 2.37 | 3.37 | 1.51 | 0.00 |
| Prenol lipids | |||||||
| ŌĆāCuminaldehyde | HMDB0002214 | C10H12O | 193.09 | 5.32 | 1.22 | 1.43 | 0.03 |
| ŌĆāAll-trans-heptaprenyl diphosphate | HMDB0012187 | C35H60O7P2 | 699.38 | 7.35 | 2.36 | 0.02 | 0.00 |
| ŌĆāGamma-tocotrienol | HMDB0012958 | C28H42O2 | 455.32 | 6.66 | 3.41 | 0.37 | 0.00 |
| ŌĆāQH2 | HMDB01304 | C14H2OO4.[C5H8]n | 321.21 | 7.35 | 1.44 | 0.43 | 0.00 |
| ŌĆā4a-Carboxy-4b-methyl-5a-cholesta-8,24-dien-3b-ol | HMDB0001181 | C29H46O3 | 441.34 | 8.08 | 3.44 | 0.34 | 0.03 |
| Pyrimidine nucleosides | |||||||
| ŌĆāThymidine | HMDB0000273 | C10H14N2O5 | 287.09 | 0.92 | 1.70 | 0.63 | 0.05 |
| Pyrroles | |||||||
| ŌĆāFluvastatin | HMDB0015227 | C24H26FNO4 | 392.17 | 6.33 | 1.37 | 6.06 | 0.00 |
| Sphingolipids | |||||||
| ŌĆāSphingosine 1-phosphate | HMDB0000277 | C18H38NO5P | 378.24 | 6.01 | 1.02 | 0.11 | 0.04 |
| Steroids and steroid derivatives | |||||||
| ŌĆāDehydroepiandrosterone | HMDB0000077 | C19H28O2 | 333.21 | 7.87 | 3.15 | 0.26 | 0.00 |
| ŌĆāAndrosterone | HMDB00031 | C19H30O2 | 603.44 | 13.82 | 1.13 | 0.41 | 0.00 |
| ŌĆāGlycocholic acid | HMDB00138 | C26H43NO6 | 448.31 | 4.89 | 1.72 | 1.84 | 0.00 |
| ŌĆāCholesterol sulfate | HMDB0000653 | C27H46O4S | 465.30 | 10.63 | 3.17 | 0.54 | 0.01 |
Table┬Ā2
Metabolic pathways of the significantly enriched metabolites between high-yield and low-yield dairy cows
REFERENCES
1. Tong J, Zhang H, Yang D, Zhang Y, Xiong B, Jiang L. Illumina sequencing analysis of the ruminal microbiota in high-yield and low-yield lactating dairy cows. Plos one 2018; 13:e0198225https://doi.org/10.1371/journal.pone.0198225


2. Saleem F, Bouatra S, An CG, et al. The bovine ruminal fluid metabolome. Metabolomics 2013; 9:360ŌĆō78. https://doi.org/10.1007/s11306-012-0458-9


3. Hanne Christine B, Christian Clement Y, Xumin Z, Niels Bastian K. Effect of dietary nitrogen content on the urine metabolite profile of dairy cows assessed by nuclear magnetic resonance (NMR)-based metabolomics. J Agric Food Chem 2011; 59:12499ŌĆō505. https://doi.org/10.1021/jf204201f


4. Tang C, Zhang K, Zhan T, Zhao Q, Zhang J. Metabolic characterization of dairy cows treated with gossypol by blood biochemistry and body fluid untargeted metabolome analyses. J Agric Food Chem 2017; 65:9369ŌĆō78. https://doi.org/10.1021/acs.jafc.7b03544


5. Zhang R, Zhu W, Jiang L, Mao S. Comparative metabolome analysis of ruminal changes in Holstein dairy cows fed low- or high-concentrate diets. Metabolomics 2017; 13:74https://doi.org/10.1007/s11306-017-1204-0


6. Hui-Zeng S, Di-Ming W, Bing W, et al. Metabolomics of four biofluids from dairy cows: potential biomarkers for milk production and quality. J Proteome Res 2015; 14:1287ŌĆō98. https://doi.org/10.1021/pr501305g


7. Xue F, Pan X, Jiang L, Guo Y, Xiong B. GC-MS analysis of the ruminal metabolome response to thiamine supplementation during high grain feeding in dairy cows. Metabolomics 2018; 14:67https://doi.org/10.1007/s11306-018-1362-8


8. Ametaj BN, Zebeli Q, Saleem F, et al. Metabolomics reveals unhealthy alterations in rumen metabolism with increased proportion of cereal grain in the diet of dairy cows. Metabolomics 2010; 6:583ŌĆō94. https://doi.org/10.1007/s11306-010-0227-6


9. Mao SY, Huo WJ, Zhu WY. MicrobiomeŌĆōmetabolome analysis reveals unhealthy alterations in the composition and metabolism of ruminal microbiota with increasing dietary grain in a goat model. Environ Microbiol 2016; 18:525ŌĆō41. https://doi.org/10.1111/1462-2920.12724


10. Zhao S, Zhao J, Bu D, Sun P, Wang J, Dong Z. Metabolomics analysis reveals large effect of roughage types on rumen microbial metabolic profile in dairy cows. Lett Appl Microbiol 2014; 59:79ŌĆō85. https://doi.org/10.1111/lam.12247


11. De Barros F, Goissis MD, Caetano H, et al. Serum starvation and full confluency for cell cycle synchronization of domestic cat (felis catus) foetal fibroblasts. Reprod Domest Anim 2010; 45:38ŌĆō41. https://doi.org/10.1111/j.1439-0531.2008.01201.x


12. Liu Y, Li J, Jin Y, et al. Splenectomy leads to amelioration of altered gut microbiota and metabolome in liver cirrhosis patients. Front Microbiol 2018; 9:963https://doi.org/10.3389/fmicb.2018.00963


13. Allison MJ, Peel JL. The biosynthesis of valine from isobutyrate by Peptostreptococcus elsdenii and Bacteroides ruminicola. Biochem J 1971; 121:431ŌĆō7. https://doi.org/10.1042/bj1210431


14. Chen L, Luo Y, Wang H, Liu S, Shen Y, Wang M. Effects of glucose and starch on lactate production by newly-isolated Streptococcus bovis S1 from Saanen goats. Appl Environ Microbiol 2016; 82:5982ŌĆō9. https://doi.org/10.1128/AEM.01994-16


15. Asanuma N, Hino T. Effects of pH and energy supply on activity and amount of pyruvate formate-lyase in Streptococcus bovis. Appl Environ Microbiol 2000; 66:3773ŌĆō7. https://doi.org/10.1128/AEM.66.9.3773-3777.2000


16. Andries JI, Buysse FX, Brabander DLD, Cottyn BG. Isoacids in ruminant nutrition: Their role in ruminal and intermediary metabolism and possible influences on performances ŌĆö A review. Anim Feed Sci Technol 1987; 18:169ŌĆō80. https://doi.org/10.1016/0377-8401(87)90069-1

17. Kim EJ, Huws SA, Lee MRF, Scollan ND. Dietary transformation of lipid in the rumen microbial ecosystem. Asian-Australas J Anim Sci 2009; 22:1341ŌĆō50. https://doi.org/10.5713/ajas.2009.r.11


18. Jenkins TC. Lipid metabolism in the rumen. J Dairy Sci 1993; 76:3851ŌĆō63. https://doi.org/10.3168/jds.S0022-0302(93)77727-9


19. Artegoitia VM, Foote AP, Lewis RM, Freetly HC. Rumen fluid metabolomics analysis associated with feed efficiency on crossbred steers. Sci Rep 2017; 7:2864https://doi.org/10.1038/s41598-017-02856-0


20. Friggens NC, Emmans GC, Kyriazakis I, Oldham JD, Lewis M. Feed intake relative to stage of lactation for dairy cows consuming total mixed diets with a high or low ratio of concentrate to forage. J Dairy Sci 1998; 81:2228ŌĆō39. https://doi.org/10.3168/jds.S0022-0302(98)75802-3


21. Saleem F, Ametaj BN, Bouatra S, et al. A metabolomics approach to uncover the effects of grain diets on rumen health in dairy cows. J Dairy Sci 2012; 95:6606ŌĆō23. https://doi.org/10.3168/jds.2012-5403


22. Michaud MR, Denlinger DL. Shifts in the carbohydrate, polyol, and amino acid pools during rapid cold-hardening and diapause-associated cold-hardening in flesh flies (Sarcophaga crassipalpis): a metabolomic comparison. J Comp Physiol B 2007; 177:753ŌĆō63. https://doi.org/10.1007/s00360-007-0172-5


23. Pan XH, Yang L, Xue FG, et al. Relationship between thiamine and subacute ruminal acidosis induced by a high-grain diet in dairy cows. J Dairy Sci 2016; 99:8790ŌĆō801. https://doi.org/10.3168/jds.2016-10865


24. Khafipour E, Li S, Plaizier JC, Krause DO. Rumen microbiome composition determined using two nutritional models of subacute ruminal acidosis. Appl Environ Microbiol 2009; 75:7115ŌĆō24. https://doi.org/10.1128/AEM.00739-09


25. Ueda K, Mitani T, Kondo S. Effect of timing and type of supplementary grain on herbage intake, nitrogen utilization and milk production in dairy cows grazed on perennial ryegrass pasture from evening to morning. Anim Sci J 2016; 88:107ŌĆō18. https://doi.org/10.1111/asj.12605


26. Huizeng S, Wang B, Wang J, Liu H, Liu J. Biomarker and pathway analyses of urine metabolomics in dairy cows when corn stover replaces alfalfa hay. J Anim Sci Biotechnol 2016; 7:49https://doi.org/10.1186/s40104-016-0107-7


27. Zhang J, Xu C, Huo D, Hu Q, Peng Q. Comparative study of the gut microbiome potentially related to milk protein in Murrah buffaloes (Bubalus bubalis) and Chinese Holstein cattle. Sci Rep 2017; 7:42189https://doi.org/10.1038/srep42189


- TOOLS


 PDF Links
 PubReader
 ePub Link
 Full text via DOI
 Download Citation
 Print
Print


