Daily Feed Intake, Energy Intake, Growth Rate and Measures of Dietary Energy Efficiency of Pigs from Four Sire Lines Fed Diets with High or Low Metabolizable and Net Energy Concentrations
Article information
Abstract
A trial was conducted to: i) evaluate the BW growth, energy intakes and energetic efficiency of pigs fed high and low density diets from 27 to 141 kg BW, ii) evaluate sire line and sex differences when fed both diets, and iii) to compare ME to NE as predictor of pig performance. The experiment had a replicated factorial arrangement of treatments including four sire lines, two sexes (2,192 barrows and 2,280 gilts), two dietary energy densities and a light or heavy target BW, 118 and 131.5 kg in replicates 1 to 6 and 127 and 140.6 kg in replicates 7 to 10. Pigs were allocated to a series of low energy (LE, 3.27 Mcal ME/kg) corn-soybean meal based diets with 16% wheat midds or high energy diets (HE, 3.53 to 3.55 Mcal ME/kg) with 4.5 to 4.95% choice white grease. All diets contained 6% DDGS. The HE and LE diets of each of the four phases were formulated to have equal lysine:Mcal ME ratios. Pigs were weighed and pen feed intake (11 or 12 pigs/pen) recorded at 28-d intervals. The barrow and gilt daily feed (DFI), ME (MEI) and NE (NEI) intake data were fitted to a Bridges function of BW. The BW data of each sex were fitted to a generalized Michaelis-Menten function of days of age. ME and NE required for maintenance (Mcal/d) were predicted using functions of BW (0.255 and 0.179 BW^0.60 respectively). Pigs fed LE diets had decreased ADG (915 vs. 945 g/d, p<0.001) than pigs fed HE diets. Overall, DFI was greater (p<0.001) for pigs fed the LE diets (2.62 vs. 2.45 kg/d). However, no diet differences were observed for MEI (8.76 vs. 8.78 Mcal/d, p = 0.49) or NEI (6.39 vs. 6.44 Mcal/d, p = 0.13), thereby indicating that the pigs compensated for the decreased energy content of the diet. Overall ADG:DFI (0.362 vs. 0.377) and ADG:Mcal MEI (0.109 vs. 0.113) was less (p<0.001) for pigs fed LE compared to HE diets. Pigs fed HE diets had 3.6% greater ADG:Mcal MEI above maintenance and only 1.3% greater ADG:Mcal NEI (0.152 versus 0.150), therefore NEI is a more accurate predictor of growth and G:F than MEI. Pigs fed HE diets had 3.4% greater ADG:Mcal MEI and 0.11% greater ADG:NEI above maintenance than pigs fed LE diets, again demonstrating that NEI is a better predictor of pig performance than MEI. Pigs fed LE diets had similar daily NEI and MEI but grew slower and less efficiently on both ME and NE basis than pigs fed HE diets. The data suggest that the midds NE value (2.132 Mcal/kg) was too high for this source or that maintenance was increased for pigs fed LE diets.
INTRODUCTION
The optimization of pork production systems including alternative dietary management and marketing strategies requires knowledge of pig feed intakes, growth rates and estimated measures of feed or energetic efficiency (Krick et al., 1992; de Lange and Schreurs, 1995; Schinckel et al., 2008). In the United States, high energy feed ingredients have been directed towards bioenergy production (i.e., corn to ethanol and animal fats to biodiesel). This has resulted in the formulation of diets that are more diverse and with decreased energy concentration. Diets with decreased concentrations may reduce the lipid accretion rates to a greater extent than protein accretion. In this case, the amount of BW gain produced per unit energy intake above maintenance may be affected by the energy concentration of the diets fed. Currently, both the ME and NE systems are used in the pork industry for diet formulation and to predict pig growth responses to diets with different feed ingredients (NRC, 1998; Noblet et al., 1999). The advantages of the NE systems have been discussed by Birkett and de Lange (2001a, b) and Noblet and Milgen (2004).
Genetic populations of pigs differ in their growth rates, daily energy intakes, and relative rates of protein to lipid deposition (de Lange and Scheurs, 1995; Schinckel and de Lange, 1996). Genetic or gender differences in the relative amounts of energy required for maintenance, protein and lipid accretion has an impact the pigs’ relative efficiency use of dietary energy from protein, lipid and carbohydrates (Birkett and de Lange, 2001a, b). Genetic differences could also exist for the pigs’ ability to use diets with different composition. Differences between genetic populations for growth rates and measurements of feed or energetic efficiency could be impacted by the energy concentration of the diets fed. The objectives of this study were: i) to evaluate the BW growth, energy intakes and energetic efficiency of pigs fed high and low energy density diets from 27 to 141 kg BW, ii) to evaluate sire line and sex differences in pig growth, energy intakes and energetic efficiency when fed both high and low energy diets, and iii) to compare ME to NE as predictor of pig performance.
MATERIALS AND METHODS
Animal management and data collection
Animal procedures were consistent with the Guide for the Care and Use of Animals in Agricultural Research and Teaching FASS, 2010. Pigs (2,192 barrows and 2,280 gilts) were derived from a commercial sow farm owned by The Hanor Company and transported to Swine Tek, LLC for trial. The experiment was designed as a 10 replicates of a factorial arrangement of treatments including four sire lines, two sexes (barrows and gilts), two dietary energy densities and a light or heavy target BW. Sires from four terminal sire lines (1, 2, 3 and 4) were mated to PIC Cambrough sows. The four sire lines have different growth rates, daily feed intakes and measures of carcass composition (Schinckel et al., 2011). One group of sows was mated to the sires of each of the four sire lines each month. The goal was to breed approximately 14 sows per sire line per month. The mean number of sows bred to each sire line each month averaged 13.5 females and ranged from 8 to 19. At total of 22 to 23 sires of each sire line were mated to sows over the 10 month period. The 10 monthly groups of sows (replicate) were bred from September 2008 to July 2009.
The birth weight of each piglet was collected. Male piglets were castrated at 5 to 7 d of age. Pigs were weaned at approximately 20 d of age and weighed in the nursery at an average of 50 d of age. All pigs were phase-fed the same nursery diets to an average age of 63 d at which time they were transported from the nursery facility to the Swine Tek research barns. Pigs were sorted into pens (11or 12 pigs/pen) based on sire line and gender at arrival at the research building. Each pen had 7.62 m2 of floor space to provide 0.635 m2/pig with 12 pigs/pen. Each pen was randomly assigned to either the high (HE) or low (LE) energy diets (Table 1) and to either light or heavy market weight. The LE and HE diets were phase fed from the test date to completion of test. For replicates 1 to 6, the target BWs were 117.9 and 131.5 kg. In replicates 7 to 10, the target BWs were 127 and 140.6 kg. Individual pig BWs were recorded for each pig every 28 to 30 d until the pig achieved its target BW. Pen feed intake data was collected each weigh day and when one or more pigs achieved its target BW and was removed from the pen and marketed. Pigs were transported and harvested at a commercial pork processing plant.

Diet composition (%) specifications for the low energy diets
Diets were formulated to meet amino acid specifications that were established for these terminal genetic products (PIC, 2008), whereas, vitamin and mineral levels meet or exceed the NRC (1998). Diet energy differences were established using either fat or wheat midds. Diets were then balanced to a constant SID lysine:ME ratio for each growth phase. The most essential amino acids were set as a minimum SID ratio relative to lysine. The composition of each ingredient was also determined prior to formulation.
Two energy standards were utilized (ME, NE) in our valuation (Table 2). Ingredient ME values were derived from the NRC (1998). Net energy (NE) values for the feed ingredients were derived from NRC (1998) and Noblet et al. (1999) with 3 exceptions. The NE value for choice white grease used was different than NRC (1998). The NE value used for soybean meal (Boyd et al., 2011) was previously validated via growth asays. The NE value used for wheat midds was computed using an equation that was provided by Professor K. de Lange of the NRC revision committee (personal communication). This estimate was lower than published by Boyd et al. (2010), primarily because of reduced starch content.

Diet composition (%) specifications for the high energy diets
Statistical analyses
The BW data of each gender was fitted to a generalized Michaelis-Menten (GMM) equation (Lopez et al., 2000; Schinckel et al., 2009a). The equation has two alternative forms, WTi,t = ((WTo KC)+( WF tC))/(KC+tC)+ei,t or WTi,t = WTo+((WF−WTo)(t/K)C))/(1+(t/K)C))+ei,t where WF is mean mature BW, WTo is the mean birth BW, t is days of age, K is a parameter equal to the days of age in which one-half WF is achieved and C is a unit less parameter related to changes in proportional growth and shape of the growth curves (Lopez et al., 2000). In this function, each pig’s actual birth BW (WTi,o) was used. This function has an inflection point age (IP, d) = K ((C−1)/(C+1))(1/C) and the BW at the IP = ((1+(1/C))WTo+(1−(1/C))WF)/2. In this function, WF, K and C were considered as random effects.
The solution of a nonlinear model including three random parameters is difficult to obtain for the GMM function (Schinckel et al., 2009a). After preliminary analyses were completed and no solution was obtained for the three random effects models, alternative analyses were completed using each equation. The alternative analyses predicted a random effect for ci as a linear function of wfi (ci = b wfi) or ki (ci = b ki). In these analyses, the fixed parameter C was replaced by C+ci(C+b wfi) or (C+b ki). These analyses allowed for a pig specific value of ci to be predicted based upon a population wide linear relationship of the predicted random effect for ci and wfi.
The BW data from each sex of pigs were fitted to the GMM function using the nonlinear mixed (NLMIXED) procedure of SAS® (SAS Institute, Inc., Cary, NC). Random effects were added in a step-wise order based on Akaike’s Information Criteria (AIC) values. The addition of a predicted random effect for ci as a linear function of wfi was evaluated for each equation by comparing the AIC values. The R2 values were calculated as squared correlations between the predicted and actual observations. The RSD was calculated with the equation
Predicted values for BW and ADG were predicted for each pig from the GMM function by including each pig’s specific random effect. The predicted ADG’s and BW’s for the GMM function at five ages (84, 102, 120, 138 and 156-d) were fitted to a model including the fixed effects of age, replicate, sire line, diet, sex and their interactions using the MIXED procedure of SAS. Significant age by fixed effect interactions for predicted ADG indicate that the predicted growth curves are different for that specific fixed effect (Hamilton et al., 2003).
The pen daily feed, ME and NE intake data were fitted to a nonlinear function of mid-BW of each pen for each period. The Bridges function DFIi,BW = C(1−exp(−M BWA)) +ei, BW was proposed by Bridges et al. (1986). Here BW is mid-BW (kg) of the ith pen, C is the average mature DFI, ME, or NE intake, M is the exponential growth decay constant and A is the kinetic order constant. Since the exponential decay parameter was close to zero, the model was reparamaterized (M′ = log M)) with the form, DFIi,BW = C(1−exp(−exp(M′)BWA)) (Craig and Schinckel, 2001; Schinckel et al., 2009b). In this function, the BW in which the rate in which daily feed, ME or NE intake changes from being increasing to decreasing relative to BW is called the inflection point (IP) and is equal to DFI times F where F = 1−exp((1/A)−1). The age at the IP = (A M/(A−1))(−1/A). In this function, C, M′ and A were considered as pen specific effects. After preliminary analyses were completed and no solution was obtained for the three random effects models, alternative analyses were completed using each equation. The alternative analyses predicted a random effect for ai as a linear function of ci (ai = b ci) and mi′ as a linear function of ci. In these analyses, the fixed parameter A was replaced by A+ai (A+bi ci) or M′ replaced by M′+b2 ci. These analyses allowed for a pen specific value of ci to be predicted based upon a population wide linear relationship of the predicted random effect for ci. The inclusion of the pen specific random effects into the Bridges function relating feed or energy intake to BW allows the prediction of pen specific feed and energy intake curves.
Feed efficiency (gain:feed) was predicted for each pig as the ratio of mean predicted DFI (kg/d) for each pen divided by the pen mean predicted ADG (kg/d) from the GMM function for each pig in the pen. The BW gain:ME intake above maintenance and BW gain:NE intake above maintenance were calculated using the predicted maintenance requirements of Noblet et al. (1999). The predicted DFIs, ME intakes, NE intakes and efficiency variables (gain:feed, gain:ME intake or gain:NE intake) at six BWs (45, 60, 75, 90, 105 and 120 kg) were fitted to a model including the fixed effects of BW, replicate, sire line, diet, sex and their interactions using the MIXED procedure of SAS.
RESULTS
Body weight growth
The means and SDs for BW at each BW measurement are shown in Table 4. The SDs in age at the sixth, seventh, and final BW were greater than the other measurements as the timing of these final BWs were based upon each pig achieving its target BW.
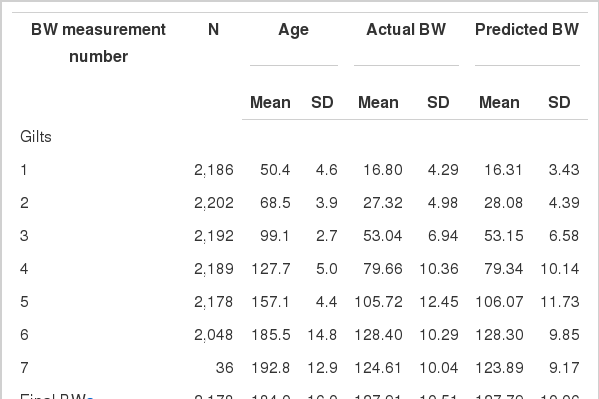
Actual BW and SD and values predicted by the generalized Michaelis-Menten function at each time of measurement
The parameter estimates for the fitting of BW to the GMM function are shown in Table 5. The addition of random effects (wfi and ki for barrows and wfi and ci for gilts) increased the R2 values and reduced the residual standard deviations. Inclusion of the two random effects in the GMM function produces individual pig BW growth curves that differ in their shape (Schinckel et al., 2009a).

Parameters and statistics for the generalized Michaelis-Menten function fitted to the BW data
The least-squares means for the predicted ADGs for each sire line, sex and diet are shown in Table 6. The BWs and ADGs at 84, 102, 120, 138 and 156 d of age were affected (p<0.01) by sire line, sex and diet. There were also sire line by sex interactions (p<0.02) for ADG at 84, 102, and 120 d of age and overall. Pigs of sire line 3 had lower BWs and ADGs than pigs of the other three sire lines. Barrows of sire lines 1, 2 and 3 had 67, 73 and 79 g/d greater ADG than gilts versus line 4 barrows which only had 40 g/d greater ADG than line 4 gilts Pigs fed the HE diets had 30 g/d greater ADG than pigs fed the LE diets. The effect of the high energy diet on ADG was consistent from 84 to 156 d of age (diet by BW interaction, p = 0.37).

Daily feed and energy intakes
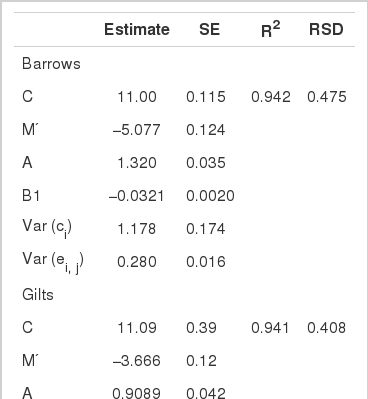
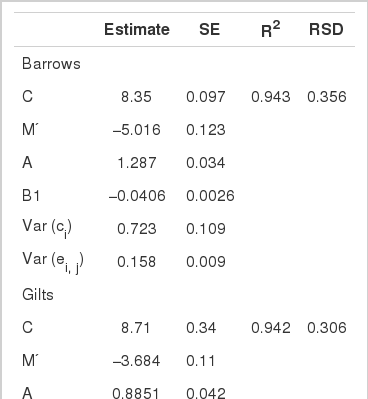
The parameters and statistics for fitting daily feed intake (DFI), daily ME intake and daily NE intake to BW are shown in Tables 7, 8 and 9. Addition of pen specific random effects to the Bridges function increased the R2 and decreased the RSD values of the Bridges functions.

The sire line, sex, and diet least-squares means for DFI, daily ME intake, and daily NE intake are shown in Table 10. The main effects of sire line, sex, diet, BW (45, 60, 75, 90, 105 and 120 kg) were significant (p<0.001). Interactions of main effects with BW indicate that the shapes of the DFI curves are different. The sire line by BW, sex by BW and diet by BW interactions were significant (p<0.001) for DFI. Pigs from line 3 sires had lower DFIs than pigs of the other sire lines and this difference increased with BW. Pigs from sire line 2 had slightly greater DFIs than sire lines 1 and 4. The amount the DFIs of line 2 sired pigs were greater than line 1 and 4 pigs increased with BW (40 g/d at 45 kg to 120 g/d at 105 kg and 135 g/d at 120 kg BW). Barrows had 8.88% greater (p<0.05) DFI than gilts at 45 kg BW which increased to 13.7% at 60 kg, 14.8% at 75 kg, 14.6% at 90 kg and then decreased to 12.6% at 105 kg and 11.1% at 120 kg BW. Pigs consumed 3.78% more of LE diet than the HE diet at 45 BW, which increased to 5.45% at 60 kg, 6.53% at 75 kg, 7.22% at 90 kg BW, 8.00% at 105 kg BW and 8.83% at 120 kg BW. The greater the BW, the greater extent pigs consumed more of the LE diets relative to the HE diets.

The daily predicted ME and NE intakes were affected by sire line, sex and BW (45, 60, 75, 90, 105 and 120 kg). Diet energy level (HE, LE) did not affect daily ME intake (p = 0.49) but did affect daily NE intake (p = 0.01, 6.33 vs. 6.44 Mcal/d for LE and HE diets). Sire line by BW and sex by BW interactions were significant (p<0.001) for daily ME and NE intakes. Sire line 3 pigs had lower predicted daily NE and ME intakes than pigs from the other sire lines. The absolute and relative differences in NE and ME intakes between line 3 sired pigs and pigs by other sire lines increased as BW increased. The greater daily ME and NE intakes of line 2 sired pigs in comparison to line 1 and 4 sired pigs increased with BW. Barrows had greater daily ME and NE intakes than gilts. The absolute difference between barrows and gilts for ME intake increased from 0.56 Mcal/d at 45 kg BW to 1.02, 1.23, 1.26, 1.20 and 1.08 Mcal/d at 60, 75, 90, 105, and 120 kg BW, respectively. The barrows had 0.40 Mcal greater NE intakes than gilts at 45 kg BW which increased to 0.72, 0.88, 0.92, 0.87, and 0.78 Mcal/d at 60, 75, 90, 105 and 120 kg BW.
The overall sire line by sex and diet least-squares means for ME and NE energy intakes above maintenance are shown in Table 11. The daily ME and NE available for growth was estimated using the predicted maintenance requirements of Noblet et al. (1999) which was assumed to be appropriate for these genetic lines and diets. After accounting for maintenance, line 3 pigs had less energy available for growth, protein and lipid accretion, than pigs of the other sire lines. The line 3 gilts had the least daily ME and NE intakes above maintenance (4.07 and 2.15 Mcal/d, respectively) and line 2 barrows had the greatest overall daily ME and NE intakes above maintenance (5.83 and 3.45 kg/d). These represent 43.2 and 60.5% differences in energy available for protein and lipid accretion.
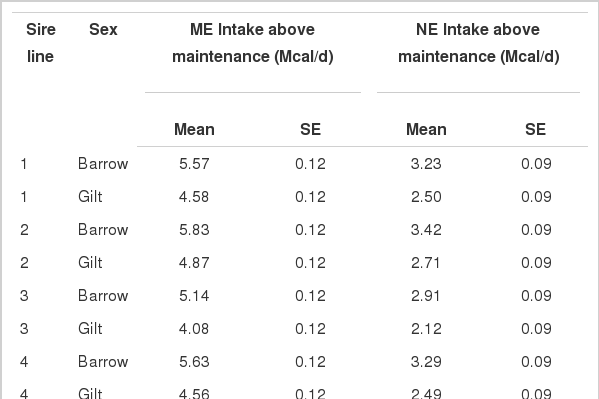
Sire line by sex and diet least-squares means for daily feed intake, daily ME intake and daily ME intake above maintenance.
Measures of feed and energetic efficiency
The least-squares means for the predicted feed and energy efficiency variables are shown in Table 12. Predicted gain:feed was affected (p<0.001) by sire line, diet, sex, BW, sire line by BW, sex by BW, and diet by BW. The sire line by sex interaction was not significant (p = 0.071) for gain:feed. The sire line by BW, sex by BW and diet by BW interactions indicate that the absolute differences in gain:feed differed with BW. Overall, the differences in gain:feed were small at 45, 60 and 75 kg BW. The sire line differences became more apparent at 90 kg BW and increased at 105 and 120 kg BW. Pigs from sire line 1 had greater (p<0.05) gain:feed than the pigs by the other sire lines at 90, 105 and 120 kg BW. Barrows and gilts had similar gain:feed at 45 kg BW (0.469 and 0.473, respectively). Gilts had greater gain:feed than barrows after 60 kg BW. The gilt advantage in gain:feed was fairly consistent (0.012 to 0.019, 3.7 to 5.0%) from 60 to 120 kg BW.

Pigs fed the HE diets had 9.64% greater (p<0.001) gain:feed than pigs fed the LE diets. The absolute differences in gain:feed for pigs fed the HE and LE diets were 0.029, 0.032, 0.035, 0.038, 0.038, and 0.038 at 45, 60, 75, 90, 105 and 120 kg BW. The percentage advantage in gain:feed for pigs fed HE diets in comparison to pigs fed the LE diets increased as BW increased (6.3, 7.9, 9.5, 11.3, 12.1 and 13.0% at 45, 60, 75, 90, 105 and 120 kg BW, respectively).
The values for gain:ME intake or gain:NE intake were both affected (p<0.01) the main effects by sire line, sex, sire line by sex, BW, and sire line by BW and sex by BW interactions. Diet affected the gain:ME intake ratio (p< 0.01) but not gain:NE intake values (p = 0.23). The sire line differences in gain:ME and gain:NE intakes increased as BW increased. Pigs from sire line 4 had greater gain:ME and NE intake than pigs from sire lines 2 and 3 at 75, 90, 105 and 120 kg BW. Barrows and gilts had similar predicted gain:ME or NE intake at 45 kg BW. After 60 kg BW, gilts had 3 to 5% greater gain:ME or NE intake than barrows. The greatest percentage advantage for gilts was 5.2% for gain:ME and 5.0% for gain:NE at 75 kg BW. Pigs fed the high HE diets had 3.27% greater gain:ME intake and 2.36% greater gain:NE intake than pigs fed the LE diet. The effect of diet was similar for gain:ME and for gain:NE intake from 45 to 120 kg BW.
Predicted BW gain:ME intake above maintenance was affected (p<0.01) by the main effects of sire line, sex, diet and BW and interactions of sire line by sex, sire line by BW and sex by BW. At 45 kg BW, pigs from the four sire lines had identical gain:ME intake above maintenance. As BW increased, the predicted BW gain:ME intake above maintenance decreased more rapidly for sire line 2 pigs (0.227 at 45 kg to 0.158 at 120 kg BW kg/Mcal) than pigs of the other sire lines (0.227 to 0.173 kg/Mcal at 45 and 120 kg BW). Pigs from sire line 1 and 3 had slightly greater predicted gain:ME intake above maintenance than pigs sired from line 4.
Gilts had greater gain:ME intake above maintenance than barrows at all BWs. Gilts had 6.8% greater predicted gain:ME intake above maintenance than barrows at 45 kg BW. From 60 to 120 kg BW, gilts had 14 to 16% greater predicted gain:ME intake above maintenance than barrows. The differences in predicted gain:ME intake above maintenance between barrows and gilts differed by sire line (p = 0.0031; 0.0257, 0.0197, 0.0293, and 0.0286 kg/Mcal for sire lines 1 through 4, respectively).
Predicted gain:NE intake above maintenance was affected by the main effects of sire line, sex and BW and interactions of sire line by BW and sex by BW. Pigs from the four sire lines had similar gain:NE intake above maintenance at 45 kg BW. The difference in gain:NE intake above maintenance between pigs of the four sire lines increased as BW increased. Gilts had 6.25% greater predicted gain:NE intake above maintenance than barrows at 45 kg BW which increased to a range of 12.0 to 14.5% from 60 to 120 kg BW. The differences in gain:NE intake above maintenance between the sexes differed (p = 0.005) amongst the pigs of the four sire lines. The gilts’ advantage relative to barrows for gain:NE intake above maintenance were 0.0290, 0.0220, 0.0322 and 0.0252 for sire lines 1 through 4.
DISCUSSION
The addition of pig specific random effects to the solution of the GMM function describing the relationship of BW to days of age increased the estimates of WF (mature BW) and K. The termination of pig BW data at specific target BWs produces biased estimates of WF and predicted ADGs at heavier BWs (Schinckel and de Lange, 1996; Craig and Schinckel, 2001; Schinckel et al., 2009a). The addition of the pig specific random effects reduces the standard errors of the GMM parameters and reduces the bias produced by the target BW data endpoints.
The BW growth curves are affected by the pigs’ genetic potential, nutrition and environmental stressors including health status, stocking density and heat stress (Schinckel and de Lange, 1996; Hamilton et al., 2003). The pigs in this trial were provided 0.635 m2 per pig to reflect commercial conditions. The floor space allowance required for maximum growth is a function of K times BW0.667 (Gonyou et al., 2006). Based upon the K values of Gonyou et al. (2006), the pigs’ ADG was reduced by the 0.635 m2 stocking density at 89 to 102 kg BW. At heavier BWs, as the fastest gaining pigs reached their target BWs, the ADG of the remaining pigs likely increased in comparison to if no pigs were removed (DeDecker et al., 2005).
There were significant sire line by sex interactions for ADG from 84 to 120 d of age and predicted maximum ADG. In this trial, sire line by sex interactions were not significant for daily feed, ME or NE intake. All measures of gain per unit energy intake were affected by sire line by sex interactions. Other researchers have found genetic population by sex interactions (Schinckel and de Lange, 1996). These interactions require evaluation of barrows and gilts of each genetic population. Swine growth models require genetic population-sex specific parameters for energy intake and compositional growth rates (de Lange and Schreurs, 1995; Schinckel and de Lange, 1996).
Overall, pigs fed the LE diets had 6.9% greater daily feed intakes and nearly identical ME and NE intakes as pigs fed the HE diets (99.8 and 99.4%, respectively). Although ME and NE intakes were nearly identical, pigs fed the LE diets grew 3.2% slower.
The addition of fat to pig diets almost always increases gain:feed and reduces ADFI (Pettigrew and Moser, 1991; Weber et al., 2006; De la Llata et al., 2007). The relative increases in ADG and daily ME intakes by feeding diets with added fat are variable (Pettigrew and Moser, 1991) and may be affected by the BW range (De la Llata et al., 2001; 2007).
The advantage of the HE diets were 3.50, 3.36, 1.33 and 0.11% for gain:MEI, gain:MEI above maintenance, gain:NE intake, and gain:NE intake above maintenance, respectively (Table 12). The fact that the dietary differences in gain are less for NE than ME indicates that NE intake is a better predictor of pig BW gain than DFI or ME intake. The advantages of NE systems have been discussed (Noblet, 2000; Noblet and van Milgen, 2004). Other researchers likewise have shown that dietary differences in gain:NE are less than those observed for gain:ME (De la Llata et al., 2001; Noblet and van Milgen, 2004).
Gilts had greater BW gain:NE above maintenance than barrows. Gilts are expected to have greater BW gain per unit NE intake above maintenance as gilts have greater ratio of protein accretion relative to lipid accretion (Noblet et al., 1999; Schinckel et al., 2008). Genetic selection for increased muscle growth and decreased fat tissue growth has reduced the amount of dietary energy required per kilogram of BW gain (Schinckel and De Lange, 1996).
Pigs fed the HE diets had 0.11% greater BW gain:NE intake above maintenance than pigs fed the LE diets. The pigs fed the HE diets had 5.4% greater backfat depth and 0.80% less predicted fat-free lean percentage (50.8 vs. 51.6%). Other researchers have found that the addition of fat to swine diets increased backfat depth and reduced predicted carcass lean percentage (Pettigrew and Moser, 1991; La Llata et al., 2001; Weber et al., 2006).
With increased carcass leanness, it is expected the gain:NE intake above maintenance should be greater for pigs fed the LE diet. For example, gilts which had 4.02 mm less backfat depth and 3.3% greater fat-free lean percentage (52.9 vs. 49.6% fat-free lean, Schinckel et al., 2012) had approximately 13% greater gain:NE intake above maintenance. Based on the backfat differences between pigs fed the HE and LE diets (19.4 vs. 18.4 mm), pigs fed the LE diets should have approximately 3.2% greater gain:NE intake above maintenance than pigs fed the HE diets. Most likely the maintenance requirement is greater for pigs fed the LE diets. Feeding of LE diets with increased fiber concentrations can increase the amount of endogenous gut losses (Mariscal-Landin et al., 1995; Nyachoti et al., 1996). Perhaps more importantly, it is also possible that viscera organ mass increased with the feeding of the LE diets. Viscera mass has approximately three times greater maintenance requirement per kg0.70 than muscle mass (Noblet et al., 1999). Pigs fed the HE diets had both greater dietary lipid intake and lipid accretion. The HE, high fat diets may have an advantage in that the direct deposition of dietary fat to lipid accretion is an energetically efficient process (about 90%; Whittemore, 1997; Birkett et al., 2001c; Noblet and Milgen, 2004). Nutrient flow models which consider the animals’ ultimate use of the nutrients (protein, starch, fat) and the increased endogenous secretions produced by some feedstuffs and their impact on maintenance requirements could better account for the differences in pig performance observed in this trial (Birkett and de Lange, 2001a, b).
IMPLICATIONS
A method to validate diet energy value (ME, NE) using growth assay and modeling technique was demonstrated using LE and HE diets. NE proved to be a more accurate descriptor in each case. Pigs fed the LE diets had greater daily feed intakes but equal daily NE and ME intakes compared to pigs fed the HE diets. Pigs fed the LE diets grew more slowly, had less backfat and greater predicted percent lean than pigs fed the HE diets. The effects of the LE versus HE diets were consistent across the genetic lines used in this trial. The results suggest that pigs fed LE diets may have greater daily maintenance requirements for energy than pigs fed HE energy diets and that NE is a better predictor of pig growth than ME. This is remarkably illustrated using both genders and four sire lines.
