


INTRODUCTION
Gestation success in mammals relies on important physiological changes in maternal body, such as uterus and mammary gland growth, increased blood volume, improved intestinal absorption and renal reabsorption, and adaptations in respiratory and cardiovascular systems (Mattison et al., 1990; Bell et al., 2005).
Alterations related to protein and energy metabolism in particular have been studied in the final days of gestation, when fetal growth is highest. Studies regarding mineral metabolism during pregnancy in ruminants has focused on bone resorption metabolism during pregnancy (Liesegang et al., 2006) al well only related to fetus and adnexa growth (House and Bell, 1993). However, information about macromineral changes in the maternal body composition as well on the dynamics and even the onset of the macrominerals mobilization on pregnant goats is still scarce.
The mineral requirements for pregnancy is directly related to the number and size of fetuses (NRC, 2007; Suttle, 2010) and information regarding the maternal management of the mineral metabolism between single and twin pregnancy is not well established. Additionally, mineral requirements are also affected by the genotype of the animals (Teixeira et al., 2013), but in the literature do not exist reports comparing dairy goat breeds. The world's largest dairy herd consists of the Saanen breed, and in some countries Oberhasli goats are among the main breeds in their dairy goats herd (Irano et al., 2012). The objective of the present study has to evaluate the effect of number of fetuses on the physiological changes to body calcium (Ca), phosphorus (P), magnesium (Mg), sodium (Na), and potassium (K) during the gestation period in Saanen and Oberhasli goats.
MATERIAL AND METHODS
Animals and reproduction management
The experimental protocol adopted was previously approved by the Ethics Committee of S├Żo Paulo State University (UNESP), in Jaboticabal (#026167-07).
The 42 goats (21 Oberhasli and 21 Saanen breed) were pluriparous, non-lactating and not pregnant at the beginning of the study. They had an initial mean body weight (BW) of 49.5┬▒7.6 kg and body condition score of 2.6┬▒0.66, based on a 1 to 5 scale.
Reproductive management involved natural estrus and induced estrus in the anestrous period, using the hormonal treatment recommended by Westhuysen (1979) and Ritar et al. (1984). Once confirmed in estrus, females were individually exposed to a male for natural mating.
After mating, the goats were held in individual 1.0 m2 pens equipped with a feeder and water trough. In the morning following mating, the goats were weighed before the first meal and blood samples were collected.
All the goats were fed ad libitum with the same diet during all the experiment formulated to meet pregnant goat requirements for a litter size of 2 according to NRC (2007). The diet was provided twice a day, at 07:30 h and 17:00 h, allowing 15% orts. Diet composition is reported in Table 1.
At the beginning of the experiment, 3 animals from each breed were slaughtered to estimate the baseline body composition of non-pregnant goats. Thirty-five days after mating, pregnancy was confirmed and the number of fetuses determined by sonography. From the reminder females (18 for each breed) thee goats of each breed were randomly assigned to days of gestation at slaughter (80, 110, and 140 d) and number of fetuses (1 or 2) in a 2├Ś2├Ś3 factorial arrangement of treatments in a completely randomized design. Animals were weighed before the first meal of the day, every 15 days throughout the experiment. At 45 days of pregnancy the sonographies were remade in the goats from the experiment to reconfirm the fetus number to make sure about the experimental design distribution. When at the slaughter the number of fetuses were not correct occasioned by fetus reabsorptions or number of fetuses higher than previously accounting this animal was discarded from the experiment and was included a new experimental unit to repeating all the process.
Sampling
Animals were slaughtered at 80, 110, and 140 days of gestation without prior water or food deprivation. BW was measured immediately before death. At slaughter, goats were stunned using a captive bolt pistol, this was followed by severing of the jugular vein and carotid artery. All blood was collected and stored for further analyses. Upon confirmed death, the gravid uterus and the mammary gland were removed from the body. Components of the former were separated into uterus (uterine tissue with placenta and placentomas), fetuses and fetal fluid. Uterus components and mammary glands were weighed and immediately frozen at ŌłÆ12┬░C. The gastrointestinal tract (GIT) was removed and the weight difference between the full and empty GIT was considered the GIT content weight. Empty body weight (EBW) was calculated by subtracting the weight of GIT contents, urinary bladder and gall-bladder from BW were taken immediately before slaughter.
We divided the animal body into six fractions: maternal body, femur, fetus, fetal fluid, uterus and mammary gland. The right-side femur was removed to measure bone mineral density and its chemical composition. The entire body, including carcass, blood, organs, viscera, fat, head, limbs and skin, was frozen, ground all together, and homogenized. A 1 kg sample was separated and frozen for further analysis. The uterus, fetus, mammary glands and femur were also ground and homogenized, and sub-samples of these tissues were separated for future analyses. X-ray images of the femur were taken (using unit of Siemens, model Tridoro 812 E, S├Żo Paulo, Brazil) before they were ground and dried to determine bone mineral density.
The sub-samples collected were freeze-dried for 72 h. The body, mammary gland and femur samples were defatted before the determination of mineral content.
The animals scheduled for slaughter at 140 days of gestation underwent periodical blood sampling starting at conception; blood samples were then collected at 1, 35, 50, 65, 80, 95, 110, 125, and 140 days of gestation. Two samples were collected on each sampling day: one before the morning feeding and the other 4 h after this meal (denoted as time T0 and T4, respectively). Blood samples were collected from the jugular vein using 10 mL vacuum tubes without anticoagulant. Serum was obtained after blood samples were centrifuged for 20 min at 4┬░C and 1,370├Śg.
Digestibility trials
The goats were slaughtered at 140 days of gestation were subjected to 3 sequential balance trials started at 75, 105, and 135 days of gestation. Animals were placed in metabolism cages for 7 days in each assay, 2 days for adaptation and 5 days for the determination of mineral consumption and total feces and urine collection. Fecal samples representing 20% of the total daily excretion were collected and composited over each 5-d periods. Urine was collected in flasks (5 L) containing 50 mL of 7.2 N H2SO4, and a 10% aliquot was collected daily and frozen for further analysis. Apparent absorption was considered to be the mineral fraction that was ingested but not excreted in feces. The balance of each mineral was calculated by subtracting the content eliminated in feces and urine from the amount ingested. Feces, feed and leftover samples were dried in a forced air oven at 55┬░C for 72 h.
Analyses
Bone mineral density was estimated in the proximal and distal femoral epiphysis and in the femoral diaphysis using X-ray imaging and a 12-point scale for estimating aluminum concentration (aluminum alloy 6063, ABNT), in accordance with the method described by Ara├║jo et al. (2011).
Dry matter (DM) and fat content (feed, feed orts, feces, empty body, mammary gland, fetus, femur, uterus and fetal fluid) were determined using AOAC methods 930.15 and 920.39, respectively (AOAC, 1990). Because of the high fat content in the mammary gland, empty body and femur, the samples were defatted with reflow in petroleum ether for 8h for ether extract analysis. Feed samples were analyzed for total ash by combustion at 600┬░C for 3 h (AOAC, 1990, method 942.05) and for crude protein (CP) by nitrogen determination using the Dumas method with a Leco-FP 528 LC (2013 LECO Corporation, St. Joseph, MI, USA), as per the protocol described by Etheridge et al. (1998). Neutral detergent fiber in feed ingredients was determined applying the method described by Robertson and Van Soest (1981). Gross energy density was obtained using calorimetric bomb.
Mineral content in samples of empty body, femur, fetus, uterus, fetal fluid, mammary gland, feed ingredients, feed leftovers, feces and urine was determined by digestion in nitric (NHO3) and perchloric (HClO4) acids (AOAC, 1990; method 935.13). Ca and Mg contend were determined by atomic absorption (AOAC, 1990; method 935.13), Na and K by atomic emission (Fritz and Schenk, 1979) and P by colorimetric assays (AOAC, 1990; method 965.17).
Serum Ca, P, and Mg concentrations and alkaline phosphatase activity were determined by colorimetric procedures, using commercial kits (LABTEST, Lagoa Santa MG, Brazil) with spectrophotometer (model Bio 2000 LABQUEST, S├Żo Paulo, Brazil). Serum K, Na and ionized Ca contends were determined with a ROCHE 91 electrolyte analyzer.
Body composition at conception
Mineral retention was estimated from the difference between final composition in each body part (maternal body Equation (Eq.) 1, mammary gland, uterus and femur), determined at slaughter, and composition at the beginning of pregnancy, estimated from reference animals (Eqs. 2 to 8). Changes in bone mineral density were estimated using a similar procedure (Eqs. 9 to 13). The initial composition of fetus and fetal fluid was assumed to be zero.
where, EBWi = initial empty body weight (kg); BW = body weight (kg) at mating; R2 = 0.96; and standard error (SE) = 2.25.
where, MBi = initial maternal body weight (kg); R2 = 0.99; and standard error of the mean (SEM) = 0.26.
where, initial gland = initial mammary gland weight (g); R2 = 0.76 and SE = 80.27.
where, initial uterus = initial uterus weight (g)
where, initial femur = initial femur weight (g); R2 = 0.83 and SE = 0.04.
where, initial BMD of diaphysis = initial bone mineral density of diaphysis in the femur (mm Aluminum); R2 = 0.79 and SE = 0.75.
where, initial BMD of proximal epiphysis = initial bone mineral density of proximal epiphysis in the femur (mm Aluminum); FWi = initial femur weight (Eqs. 7 and 8); R2 = 0.61; and SE = 0.65.
where, initial BMD of distal epiphysis = initial bone mineral density of distal epiphysis in the femur (mm Aluminum). R2 = 0.40; and SEM = 1.38.
Statistical analysis
The mineral retention in empty body, femur, fetus, uterus, fetal fluid and mammary gland was estimated from the difference between final composition at slaughter and composition at the beginning of pregnancy. To estimate the mineral composition at beginning of pregnancy we obtained regressions to each part (empty body, femur, fetus, uterus, fetal fluid and mammary gland) from baseline composition of non-pregnant goats using the SAS GLM procedure (version 9.2).
Mineral intake and mineral in the feces and urine data were analyzed as a completely randomized design with repeated measures over time. Mixed models were solved with the fixed effects of breed (Oberhasli and Saanen, 1 degree of freedom -df), type of pregnancy (singleton and twins, 1 df), days of gestation (80, 110, and 140 days, 2 df) and the interaction of these factors as fixed effects and the random effects of animals within breed├Śtype of pregnancy and the residual error, using the SAS MIXED procedure (version 9.2, SAS). Various error covariance structures were investigated and the one that best fit the data according to the Bayesian information criterion (BIC) was selected. Significance level was set at pŌēż0.05. Trends were considered at pŌēź0.05 and pŌēż0.10.
Retention data were analyzed as mixed models with breed (1 df), days of gestation (80, 110, and 140 days, 2 df), type of gestation (1 df) and the interaction of these factors as fixed effects and a residual error as random effect, using the SAS MIXED procedure (version 9.2). The likelihood test indicated heterogeneous residual variances of the significant differences between the number of fetuses and days of gestation. Therefore, residual variances across the number of fetuses and days of gestation sub-classes was modeled using the GROUP command option REPEATED. Graph and analysis of the residue showed that the considerations of the model and the tests applied were pretty accurate. When residual variances were not homogeneous across the number of fetuses and days of gestation sub-classes, and were modeled using the option GROUP of the REPEATED statement. Statistically different means for days of gestation were compared using TukeyŌĆÖs minimum significant difference (i.e., option PDIFF adjust = Tukey of the command LSMEANS). Significance level was set at pŌēż0.05. Trends were considered at pŌēź0.05 and pŌēż0.10.
Polynomial contrasts were performed to analyze linear and quadratic effects during days of gestation using the contrast statement into the SAS MIXED procedure.
Serum mineral levels were analyzed as a completely randomized design with repeated measures over time using mixed models with breed (1 df), number of fetuses (1 df), days of gestation (1, 35, 50, 65, 80, 95, 110, 125, and 140 days; 8 df), collection time (T0 and T4, 1 df) and the interaction of these factors as fixed effects and as random effects of animal within breed├Śnumber of fetuses and the residual error, using the SAS MIXED procedure (version 9.2). Error structures UN├ŚAR and UN├ŚCS were used because they provided the best fit according to BIC. The non-significant 3-way and 4-way interaction effects (p>0.1) were sequentially removed from the model. Significance level was set at pŌēż0.05. Trends were considered at pŌēź0.05 and pŌēż0.10.
RESULTS
Dry matter intake, mineral availability and balance
Daily DM intake decreased linearly up to 140 days of gestation (Table 2). Moreover, compared to Oberhasli goats, Saanen goats exhibited higher DM and minerals intake. Additionally, Ca, P, and K balance was bigger in single pregnancy (114┬▒15.8; 160┬▒9.61; 399┬▒36.5 mg/d/EBW0.75, respectively) than twin pregnancy (31.9┬▒16.9; 101┬▒10.9; 180┬▒40.9 mg/d/EBW0.75, respectively). The P and Mg balance was greater to Saanen goats (149┬▒11.9, ŌłÆ4.36┬▒19.2 mg/d/EBW0.75, to Ca P and Mg respectively) than Oberhasli goats (113┬▒9.05,ŌłÆ50.9┬▒15.4 mg/d/EBW0.75, to P and Mg respectively). Given the high amount of Mg and Na excreted in feces, we observed a negative balance.
Mineral retention
Weight gain in the goats decreased linearly during gestation development, reaching negative values at 140 days of gestation (p<0.01, Table 3). Oberhasli mothers showed higher (p<0.01) retention of all the macrominerals in their body (g/kg). During pregnancy, Ca, P, and Mg retention (g/kg) in the maternal body decreased linearly (p<0.01). Mineral retention was similar in goats carrying one or two fetuses, except for sodium, which was higher in twin-pregnant goats (p<0.05).
Oberhasli fetuses exhibited higher calcium, phosphorus and magnesium retention (mg/g of total fetus weight) than Saanen fetuses (p<0.01; Table 4). The retention of all minerals in the fetuses (mg/g of total fetus weight) increased with gestation development (p<0.01), with no differences found between singleton and twin pregnancies. Assuming that mineral deposition in the fetus is practically null up to 30 days of gestation, the accumulation rate of Ca, P, Mg, Na, and K was 324, 222, 1.34, 1.44, and 1.04 mg/d from 30 to 80 days, respectively; 400, 260, 13, 100, and 86 mg/d from 80 to 110 days; and 980, 580, 30, 320, and 124 mg/d from 110 to 140 days. Therefore, mineral retention in the fetus increased significantly from 80 days onward. The three way interactions showed that weight gain in Oberhasli fetuses was greater until the end of pregnancy (p<0.01). As a result, the largest fetuses showed a greater amount of retained Ca and P, thereby producing the interactions observed.
Fetal fluid increased linearly up to the 140 days of pregnancy, and twin-pregnant Oberhasli goats had higher fluid content than Saanen goats (p<0.01; Table 5). The deposition of P, Na, and K in the fetal fluid (mg/g) increased quadraticaly whereas Mg deposition increased linearly with the days of pregnancy (p<0.05). Oberhasli goats exhibited greater Ca and Na levels in the fetal fluid (p<0.01).
Mass retention in the uterus increased linearly with days of pregnancy and was greater in Oberhasli and twin-pregnant goats (p<0.01; Table 6). Na retention (mg/g uterus) was greater in Oberhasli goats (p<0.05). Mg and K retention (mg/g of uterus) increased linearly over days of pregnancy (p<0.01). Goats with twin pregnancy had greater Na and K retention in the uterus (p<0.01).
Weight retention in the mammary gland (Table 7) increased quadraticaly with days of pregnancy (p<0.01) and was greater in twin-pregnant goats (p<0.05). Up to 110 days of gestation, twin-pregnant goats had greater Ca and P retention (mg/g) in the mammary gland, but at 140 days the greatest retention was found in singleton-pregnant goats (p<0.01). Over the pregnancy Mg, Na and K retention (mg/g of mammary gland) increased. Total retention (g) of all the minerals in the mammary gland increased until the end of pregnancy (p<0.05).
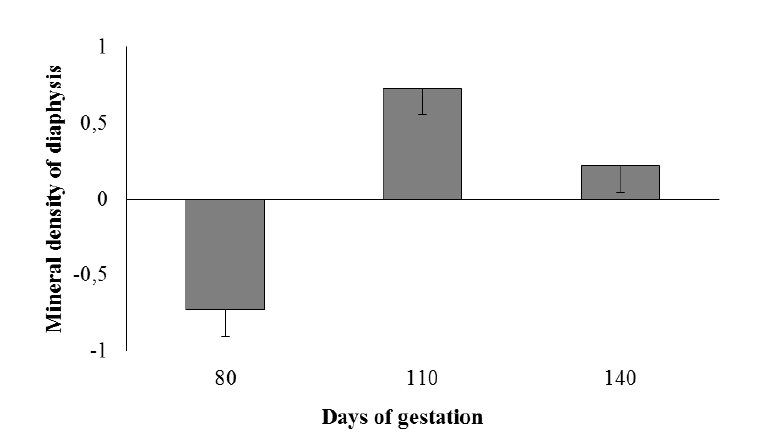
Greater Ca, P, and Mg retention rates (mg/g) in the femur were observed in Saanen goats (Table 8). Except for Ca, mineral retention (mg/g) increased until 110 days of gestation, and mineral retention in the femur was not affected by the number of fetuses. Bone mineral density retention in femoral diaphysis was higher at 110 days of gestation and lower at 80 days, indicating bone resorption in the initial stage of pregnancy (p<0.01; Figure 1).
Blood metabolism
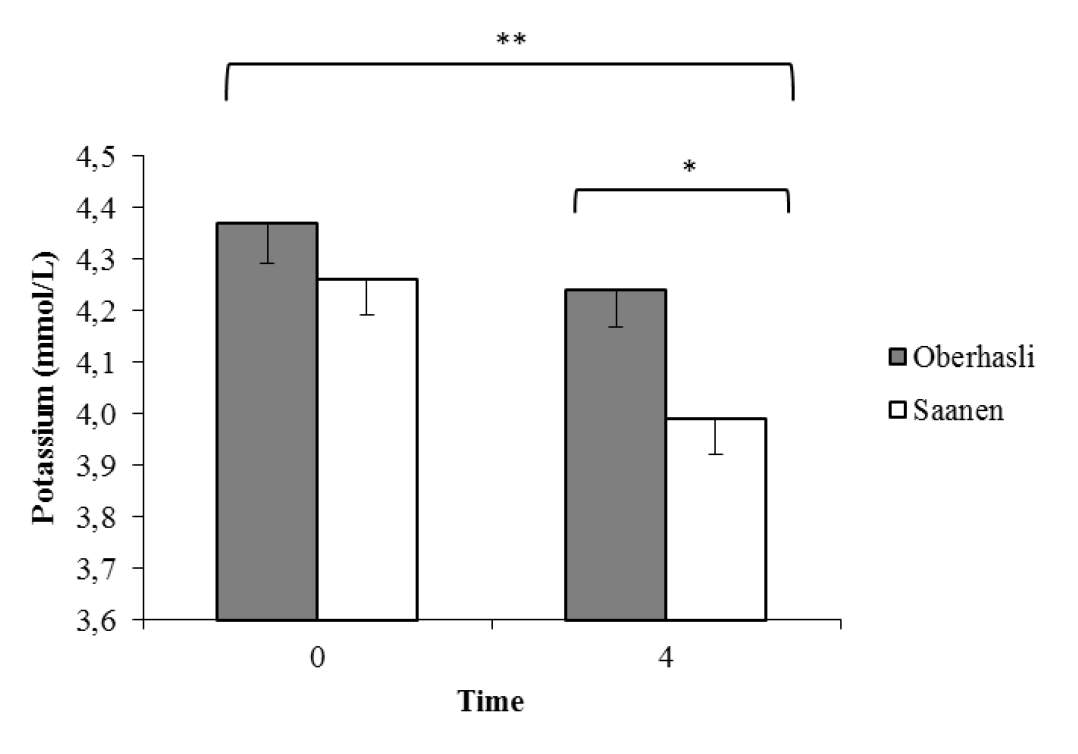
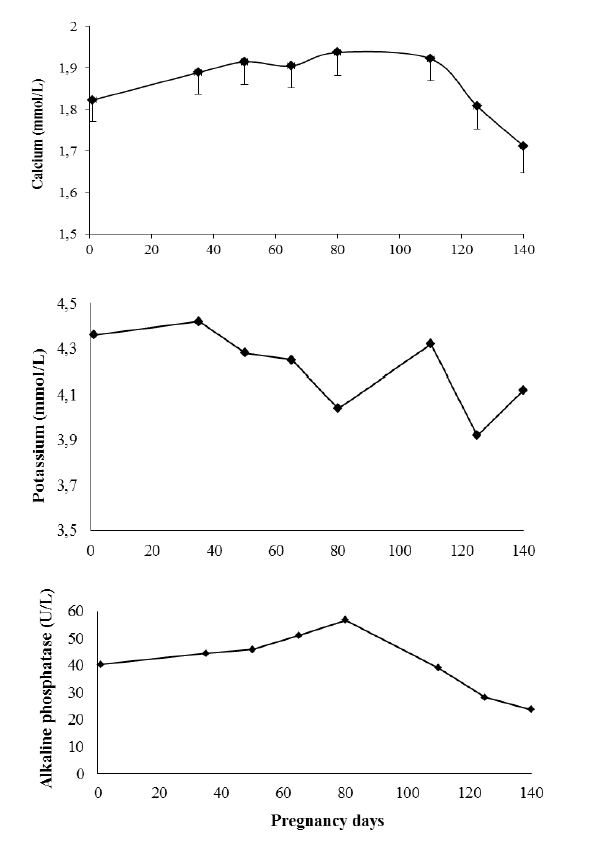
Serum Ca, K, and Ca+ levels were higher before feeding (Table 9), whereas P, Mg, and Na levels were higher 4 h after feeding (T4, p<0.01). Oberhasli goats had higher serum K levels (p<0.05) than Saanen goats four hours after feeding (Figure 2). Serum Ca levels changed over pregnancy development, increasing 0.5 mg/dL up to 80 days of gestation and decreasing significantly after 110 days (p<0.05; Figure 3). Serum K levels decreased with pregnancy development, whereas alkaline phosphatase achieving the highest concentrations at 80 days of gestation and decreasing after this (p<0.05).
DISCUSSION
Given the body changes observed in pregnant goats, the number of fetuses did not affect mineral losses form the maternal body. The main changes were primarily associated with pregnancy development.
Up to 80 days of gestation, the Ca, Mg, and P content stored in the goatŌĆÖs body was enough to withstand the first physiological body changes and especially to meet future growth demands intrinsic to pregnancy.
In the initial stages of pregnancy, the maternal body undergoes drastic physiological changes in order to adapt to the developing embryo and placenta. The uterus rapidly enlarges, as blood volume increases with blood cell multiplication (hemoglobin and platelets) (Scheaffer et al., 2001). Processes that require energy expenditure, such as muscle contraction, blood coagulation and cardiac control, involve Ca directly, in addition to P and Mg, which play an important role in adenosine triphosphate (ATP) production (Suttle, 2010). For meeting the increased demand for these minerals, pregnant goats increased Ca, P, and Mg apparent absorption from food, without modifying their loss in feces and urine, and enhanced bone resorption, making these minerals readily available. This is evidenced by the slight elevation in serum Ca levels between the first and 80th day of pregnancy, which, although apparently insignificant, is likely greater than expressed by blood concentrations. This could be due the mineral levels that are diluted during pregnancy due to increased blood volume (Picciano, 2003). Furthermore, despite its high variability, the mineral composition of the femur (Ca, P, and Mg levels) is compatible with densitometry results, indicating bone resorption up to 80 days of gestation. This result contradicts KovacsŌĆÖ (2003) theory, which states that mineral deposition in maternal bones occurs in the initial phase of pregnancy to withstand future demands. In addition, it also suggests that Ca, P, and Mg remain stored in soft tissues and/or in blood, but not in bone tissue, making these minerals more readily available.
According to earlier studies, from 80 days of gestation onward, mineral deposition was markedly elevated in the fetus and mammary glands, which accounts for the higher mineral demand during pregnancy (Bell et al., 2005; NRC, 2007). The deposition of Ca, P, and Mg in these tissues was mainly sustained by maternal body storage, which decreased significantly after 80 days of gestation. Densitometry and mineral composition of the femur, however, suggests that a fraction of these minerals that were freely circulating in the body were mobilized to produce a mineral bone stock. The results of densitometry and mineral composition of the femur show that a freely-circulating fraction of these minerals was retained in bones between 80 and 110 days of gestation. This was likely associated to a larger increase in the serum estrogen levels of pregnant goats, which occurs from 80 days of gestation onward (Challis and Linzell, 1971). Other studies show that estrogen was directly related to bone remodeling, stimulating osteoblastic activity (Hadjidakis and Androulakis, 2006). However, as expected the results of total alkaline phosphatase activity do not reflect this tendency at 80 days of pregnancy, possibly because total alkaline phosphatase activity is the combination of this activity in the liver, intestine, placenta, bones, kidneys and white blood cells (Lehmann, 1975). It could be confounded with the increase of alkaline phosphatase secretion in the placenta during the gestation (Kovacs, 2001).
According to the observations of Liesegang et al. (2006), the amount of Ca absorbed at the end of pregnancy is insufficient to meet animal requirements at this stage because Ca and P decrease in maternal body composition, whereas their endogenous losses increase. At the end of gestation, Ca intake was reduced as a result of the decrease in DM intake; consequently, goats increase apparent Ca absorption (Suttle, 2010). In addition, based on serum Ca levels at the end of pregnancy and data on bone mineral density and maternal body composition between 110 and 140 days of gestation, higher Ca, P, and Mg mobilization from maternal deposits occurs during this stage in order to promote fetal development and colostrum production. Stable serum P and Ca+ levels over the gestation were expected (Kovacs, 2001). However, in contrast to that reported in humans, serum Mg levels did not decrease at the end of pregnancy (Hosking, 1996).
No differences were detected in Na retention in the maternal body, suggesting that the amounts of this mineral used to support the growth of pregnancy tissues was obtained from diet and optimized by a decrease in endogenous excretion. In pregnant women, progesterone increases glomerular filtration in the kidney through a mineral-corticoid effect, thereby increasing Na reabsorption and water retention in the maternal body (Mattison, 1990). This process has yet to be described in animals, and despite the negative Na balance, the present study found a tendency toward greater Na retention in pregnant goats. According to McDougal (1975), mean Na levels in sheep saliva was 370 to 462 mg/dL. The negative Na balance was possibly due to the high Na content of saliva which could be lost in feces.
Our results indicate that the K supply in support of pregnancy products were mainly obtained from diet. Its consumption did not decrease over the gestation, likely because of the high K content in the diet. Most feeds commonly fed to goats naturally contain high K levels, making it difficult to avoid levels that exceed requirements in diet formulation. Consequently, the negative Mg balance can result from the antagonistic effect of K on its absorption. According to Suttle (2010), this antagonism was more pronounced in sheep than in cattle and also depends on the type of food. With pregnancy development, however, the goats showed a tendency to decrease Mg loss in feces and urine. As such, the results suggest that goats also suffer losses in Mg absorption when fed diets with high K content.
Our findings on mineral composition of the fetuses at 140 days of gestation are close those reported by NRC (2007). A comparison of types of pregnancy shows that, irrespective of the number of fetuses, the maternal body works equally for pregnancy maintenance. With respect to mineral partitioning, no competition between the fetuses was observed in twin pregnancies, and their combined growth was similar to that of fetuses from singleton pregnancies.
Tabatabaei (2011) found that goats exhibit higher K levels and lower Na levels in fetal fluid at the end of pregnancy, likely because of the fetal metabolism. These authors reported that 85% to 95% of Na was absorbed in fetal kidneys in this phase due to an increase in the Na-K-ATPase enzyme, which participates in Na reabsorption, thereby decreasing Na and increasing K levels in fetal urine. These authors also suggest that permeability to these ions can change during this period and that the activity of Na and K pumps decreases. On the other hand, Na is the major constituent of fetal fluid at the onset of pregnancy and participates in amniotic fluid formation, where it retains and increases these fluids and contributes to osmotic pressure balance (McDwell, 1992).
In the present study the greater the fetal size, the greater the uterus size and its Na and K composition. According to Bell et al. (2005), the placental mass was directly related to variations in fetal weight. Most nutrients (amino acids, K, Ca+2, Mg+2, and phosphate) flow through the placenta by active transport, which was proportional to fetal growth rate. Na is directly related to functions such as active amino acid transport, glucose delivery to cells, Ca absorption and transport, and along with K, participates in active transport by the Na-K pump (Bell et al., 2005; Suttle, 2010). Given the role they play, the uterine levels of these minerals likely increase with the number of fetuses, directly affecting nutrient demands in the placenta. Accordingly, this theory applies to the low Na levels found in the body of twin-pregnant goats. In addition to mobilizing greater amounts of Na from their reserves to form uterine tissues in twin pregnancies, the maternal body reserves the highest content of this material for fetal fluid formation because of its functions related to water retention, which is greater in this type of pregnancy.
Considering that total Ca in the mammary gland was unchanged and that colostrum production started at the end of pregnancy, the interaction obtained suggests that low Ca levels in the mammary gland of twin-pregnant goats is possibly caused by the increase in other gland components, such as total proteins and fats. According to Csap├│ et al. (1994), the first day colostrum of twin-pregnant goats, ewes and cows contains more total solids, total proteins and G-immunoglobulin than colostrum from singleton-pregnant animals. Therefore, our results suggest that twin-pregnant goats can also produce colostrum with different Ca composition from that of singleton pregnancy goats.
Serum mineral levels were maintained within the normal range described for animals in this physiological condition (Yildiz et al., 2005). As expected, after feeding, goats showed higher serum Na levels and lower K levels. Potassium ions participate in osmotic balance within the cells, whereas Na is an extracellular ion. After feeding, blood insulin level increases, helping tissues to capture nutrients in the bloodstream and transfer them to the cells. In addition, insulin accounts for short-term adjustments in net K flow in cells (Suttle, 2010). The differences between breeds in relation to serum K levels were likely caused by the lower K retention in Saanen goats. In these animals, K sequestration by cells might be more rapid after absorption, which is possibly related to the higher K balance compared to Oberhasli goats.
Magnesium and P are essential elements for oxidative phosphorylation, which occurs for ATP production. Most energy available in the organism is consumed by the gastrointestinal system and thereafter by the liver and other tissues, which also spend energy to metabolize nutrients (Lima et al., 2008). The higher P and Mg levels 4 h post-feeding can therefore be explained by the active absorption of most nutrients, with energy expenditure in enterocytes. At the second collection, these elements were probably available in greater amounts in order to ensure the occurrence of the absorptive processes observed when goats were well-fed.
The Ca fraction freely circulating in the body is found in ionized form (ionized calcium), bound to plasmatic proteins, and organic and inorganic acids. The decrease in total Ca levels in the fed condition was directly related to a decrease in ionized Ca levels. Because ionized Ca is essential for muscle contraction and cell signaling (Suttle, 2010), the Ca ions in the fed condition were likely captured in cells to meet muscle activity demands during digestion, absorption and peristalsis.
The second main changes in the maternal body were associated between the breeds studied. Factors such as age, physiological stage and genotype affect the mineral demands of animals. The different genotypes are known to exhibit differences in body composition and metabolism (Teixeira et al, 2013). The particularities of the genotypes have been rarely considered in studies on nutritional demands, especially regarding the mineral needs of small ruminants (NRC, 2007). In our study, fetuses from Oberhasli goats displayed higher Ca, P, and Mg retention because they may have received a greater supply of these minerals from their mothers, who exhibited a greater ability in retaining these nutrients in the body. On the other hand, Saanen goats had lower body mineral content, tended to store these minerals in bones and to diminish their losses in feces and urine.
Both Oberhasli and Saanen are native to Canton Berne in Switzerland, and although they show specific productivity features, both breeds have been selected for high milk production. Under similar environmental conditions, Saanen goats have higher milk production, but lower total solids concentration in milk than Oberhasli goats (Haenlein, 1996), which is evidence of their different metabolic processes. The main differences between the breeds are reported in studies on milk protein content (Pulina et al., 2008), and investigations comparing the mineral metabolism of these breeds are practically nonexistent. Although with few experimental units for each breed, our results are indicative that the two breeds exhibit different mineral metabolism and more studies are necessary to better detect this differences.
CONCLUSION
Ca, P, and Mg metabolism during pregnancy can be divided into two stages. The first, up to 80 days of gestation, is characterized by the preparation of the maternal body for future demands. During this stage, minerals are retained in the body to support important physiological and metabolic adjustments, meeting the needs of gestational products. The second stage, from 80 days of gestation onward, is characterized by the transfer of maternal body reserves for fetal development and colostrum production. Sodium and K supplies are provided by adjustments in endogenous excretion and an increase in the intestinal absorption of these minerals. Additionally, the mineral metabolism seems to be specific to each genotype and, except for Na, is not affected by the number of fetuses.
 PDF Links
 PubReader
 ePub Link
 Full text via DOI
 Full text via PMC
 Download Citation
 Print
Print


