 |
 |
| Anim Biosci > Volume 29(7); 2016 > Article |
|
Abstract
Development of body hair is an important physiological and cellular process that leads to better adaption in tropical environments for dairy cattle. Various studies suggested a major gene and, more recently, associated genes for hairy locus in dairy cattle. Main aim of this study was to i) employ a variant of the discordant sib pair model, in which half sibs from the same sires are randomly sampled using their affection statues, ii) use various single marker regression approaches, and iii) use whole genome regression approaches to dissect genetic architecture of the hairy gene in the cattle. Whole and single genome regression approaches detected strong genomic signals from Chromosome 23. Although there is a major gene effect on hairy phenotype sourced from chromosome 23: whole genome regression approach also suggested polygenic component related with other parts of the genome. Such a result could not be obtained by any of the single marker approaches.
Genome wide association studies (GWAS) are employed to detect single nucleotide polymorphisms (SNP) associated with phenotypes in domestic species. Assumptions regarding underlying genetic architecture are important in association mapping for detecting genetic factors related with the phenotypes of interests (de los Campos et al., 2015). To date single regression tests based on SNPs have been commonly employed in GWAS. Discordant sib pair (DSP) model is one application of single SNP models in association mapping (Boehnke and Langefeld, 1998). DSP design uses matched sib pairs (as cases and controls) from the same families to reduce impact of environmental effects and to increase genetic homogeneity to overcome population stratification problems for association mapping. Karaca├Čren et al. (2010) and Karaca├Čren (2012) suggested the use of DSP design in domestic species based on availability of larger number of sib pairs in animal genetics (due to controlled crosses) compared with humans.
However only a small proportion of the genetic variance could be explained by using single SNP regression approaches in GWAS. This phenomena is termed as ŌĆ£missing heritabilityŌĆØ (Turkheimer, 2011) in genomics. To overcome this problem Visscher (2008) and Yang et al. (2010) suggested using whole SNPs simultaneously similar to Meuwissen et al. (2001) approach. Meuwissen et al. (2001) proposed to use genomic selection models based on usage of whole markers simultaneously to predict total genetic value of the animals. Genomic selection (prediction) models also are suggested in GWAS to detect associated variants (de los Campos et al., 2010; Fernando and Garrick, 2013) instead of single SNPs models. Employing whole markers altogether in a GWAS might be beneficial for multiple hypothesis testing, linkage disequilibrium and for increasing the power of the study (Moser et al., 2015).
Development of body hair is an important physiological and cellular process that leads to better adaption in tropical environments for dairy cattle (Dikmen et al., 2013). Various studies suggested a major gene (Olson et al., 2003) and, more recently, associated genes (Dikmen et al., 2013; Littlejohn et al., 2014) for hairy locus in dairy cattle. Main aim of this study was to i) employ a variant of the DSP model, in which half sibs from the same sires are randomly sampled using their affection statues, ii) use various single SNPs regression approaches (Price et al., 2006; Aulchenko et al., 2007) and iii) use whole genome regression approaches (Moser et al., 2015) to dissect genetic architecture of the hairy gene in the cattle.
The pedigree included 99 Holstein-Friesians formed by 22 nuclear trios and 77 half sib offspring. Half sib offspring were founded by two sires. For DSP design we used the half sibs offspring of the sire ŌĆ£24230079ŌĆØ (n = 50). Hairiness phenotypes were assessed by visual inspection of the cattle and recorded as a binary trait. The genome consisted of 712,122 SNPs distributed over 29 chromosomes. More details about the dataset could be found at Littlejohn et al. (2014).
Linear mixed models could be used to test for genome wide association (Zhou and Stevens, 2012). Due to the effect of half sib family structure the genetic stratification needs to be taken into account. We used genomic pedigree information in linear mixed model to take into account of the half sib structure as was implemented in GenABEL (Aulchenko et al., 2007) using genomewide rapid association with the mixed model and regression (GRAMMAR-gamma) (Aulchenko et al., 2007; Svishcheva et al., 2012) approach in R software (R development team, 2013).
The linear mixed model used as
where y contains the observations, b is the sex effects, a is the additive genetic effect, matrices X and Z are incidence matrices, and e is a vector containing residuals.
For the random effects, it is assumed that A is the coefficient of coancestry obtained from genotype of animals; I is an identity matrix,
Žā a 2 Žā e 2
Discordant sib pair design defines the sib pairs as cases and controls to detect putative association based on different allele counting schemes. We here extend this approach to include half sib pairs offspring. Discordant half sib pair analyses could be used to count of marker alleles in cases and controls allocated by their half sib structures. These counts might use all alleles or those discordant alleles in half sib progenies (Table 1).
Pearson homogeneity statistic could be estimated from 2xm table via following formula;
where nij stands for counted alleles among cases and controls, i = 1, 2 for cases and controls, respectively and j = 1ŌĆ”m (number of alleles). Due to correlation of test statistics within half sib offspring; permutation tests could be used to assess the signification. As was defined in (Karaca├Čren, 2012) we randomly exchanged the case and control statues of the half sib offspring with probability of 1/2 to detect significance level of the test statistics.
We used a hierarchical Bayesian mixture model (Moser et al., 2015) for predicting SNP effects (BayesR). BayesR assumed a mixture of four normal distributions for the SNP effects to be predicted;
where ╬▓ is the SNP effects, p is the mixture proportions (assumed to be 0.00001, 0.0001, 0.001, 0.01),
Žā g 2
We excluded 139,283 SNPs based on minor allele frequency of <5%, leaving 572,839 SNPs in the dataset. We excluded 2 individuals due to too high identity by state (IBS) (0.95>) leaving 97 individuals in the analyses. Mean IBS was estimated as 0.72 (0.03) and mean autosomal heterozygosity was estimated as 0.40 (0.01). Genomic heritability was found to be 0.84.
To detect the associated locus with the hairy gene we conducted a genome wide association analyses using genomic pedigree and genomic principal component analyses. The IBS matrix and genomic principal components used in the linear mixed model should adjust and remove the genetic stratification due to the half sib family structure.
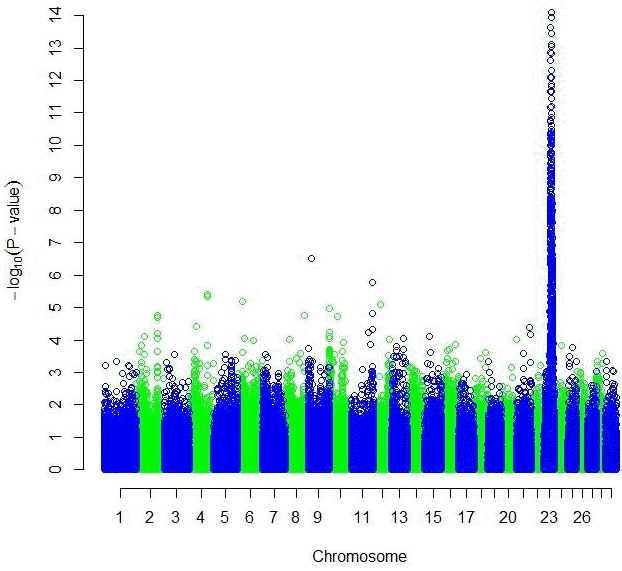
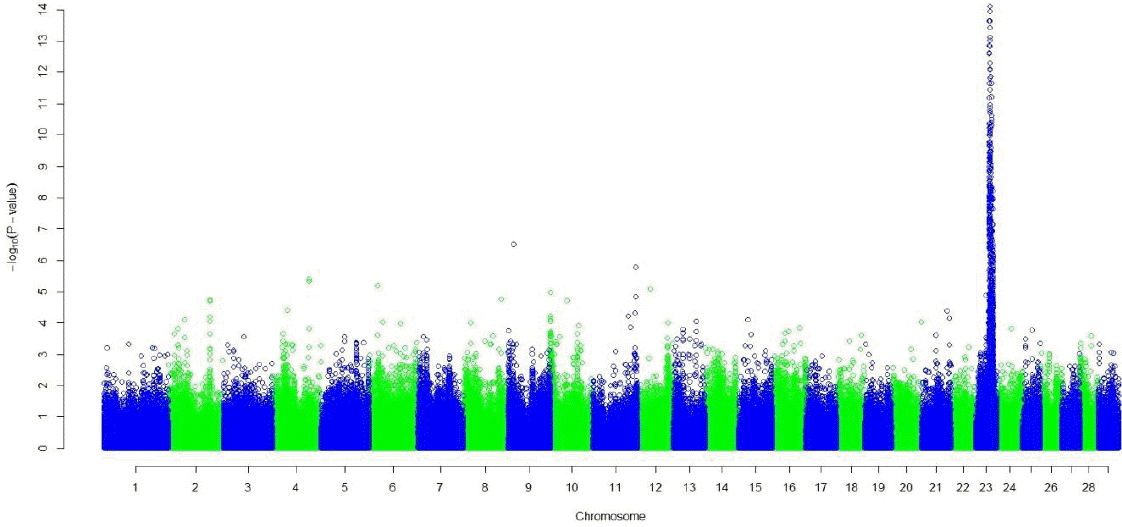
Both the GRAMMAR (Figure 1) and the principal component analyses (Figure 3) detected strong genomic signals from chromosome 23 (Tables 2 and 3). After corrections for multiple hypothesis testing by 1,000 permutations; 223 SNPs (p<0.05) and 440 SNPs (p<0.05) were declared significant with 1.19 (0.00007) and 3.31 (0.07) inflation factors by GRAMMAR and principal components approaches respectively.
Genotype and allele counts for a significant SNP (rs109386507) obtained by the principal component regression approach (Table 3) are presented in Table 4 and 5. Pearson homogeneity statistic was found to be 15.43 and 18.00 using allele counting Schemes 1 and 2 (Table 5). Since Scheme 2 counts only discordant alleles it is expected that test statistics and hence, evidence for the association is stronger. Due to dependency between half sib pair offspring, traditional statistical tests cannot be used in conjunction with hypothesis testing. Instead we used Monte Carlo simulations based on 100,000 permutations of hairiness phenotypes to declare significance. We detected 437 and 94 cases within 100,000 permutations for Schemes 1 and 2 respectively. Hence level of significance were found to be 0.004 and 0.0009 using Schemes 1 and 2 respectively.
We assumed that SNPs effects were taken from the normal distribution with different mixture proportions. Such an assumption is possible since SNPs might have different proportions of explanatory variances on the phenotypes. We ran the Markov chain algorithm 4 times and investigated the trace plot of number of significant SNPs. Visual inspection of the trace plots show convergence (results not shown) of Markov chains. The posterior mean number of SNPs were 23. Table 6 shows that most of the SNPs had small effects (<0.001). Largest effects were detected from Chromosome 23 (for example rs109407108 and rs137784196). Additive genetic variation explained by chromosome 23 was found to be 87%. Over all 23 SNPs explained 99% of the total genetic variance.
Both linear mixed model with genomic relationship matrix and principal components, half sib DSP analyses and a bayesian mixture model identified strong genomic signals from chromosome 23 for hairy gene. Littlejohn et al. (2014) also detected a strong genomic signal by sib transmission disequilibrium test and suggested a prolactin (PRL) as a candidate gene on chromosome 23 for hairy locus.
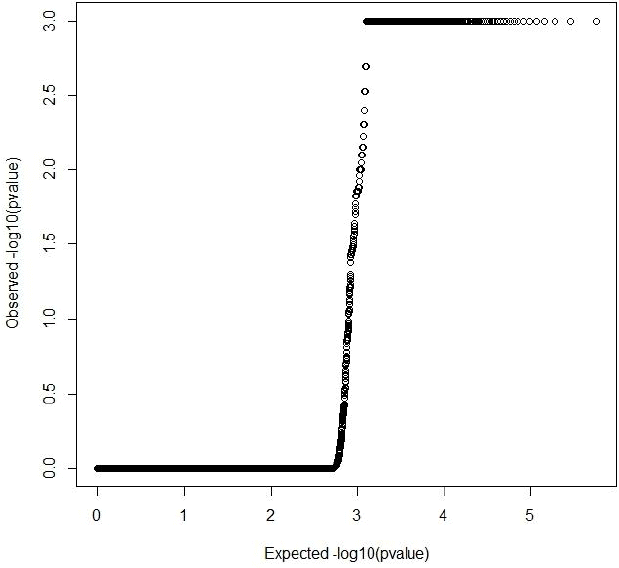
Both GRAMMAR (Figure 1) and principal components (Figure 3) approaches employed in this study detected similar genomic regions for hairy phenotype. However principal components approaches estimated higher inflation factors (3.31) (Figure 4) and a higher number of SNPs (440) compared with a GRAMMAR approach (1.19) (Figure 2) with lower number of SNPs (223). Since GRAMMAR gamma approach (Svishcheva et al., 2012) explicitly use gamma factors to reduce inflation factors this result is not surprising. However the larger estimates of the inflation factors do not have to reflect the population stratification (Yang et al., 2011) under especially polygenic inheritance as was also pointed out by Lee et al. (2014).
We used half sib progenies in DSP experimental design to confirm the most significant SNPs. Both counting schemes for rs109386507 (Table 4) confirmed the significance of the SNP. Increasing the number of discordant half sib progenies probably will also increase the accuracy. Since half sib family design is common in animal genetics such an extension of DSP design might be useful. Although here we used a single locus allele counting schemes for discordant half sib pair analyses it is possible to extend the model for the genome as was suggested by Boenke and Langefeld (1998). However heavy computation cost of permutations over the genome might be one limitation of the discordant half sib pair model.
Whole and single genome regression approaches detected strong genomic signals from Chromosome 23. But with a Bayesian mixture model we assumed a different degree of explanatory variances for the SNPs. In that regard, different from results of Littlejohn et al. (2014) we also detected genomic signals from chromosomes 9 (rs43610968) and 24 (rs137446885) for example. Although chromosome 23 was relatively short compared with the most of the other chromosomes; it explains 87% of total genetic variance detected by the Bayesian mixture model. More than 99% of the SNPs had tiny (or zero) effects on the genetic variance. Although there is a major gene effect on hairy phenotype sourced from chromosome 23; whole genome regression approach also suggested a polygenic component related with other parts of the genome. Such a result could not be obtained by any of the single marker approaches.
Figure┬Ā1
Manhattan plot of genome wide association studies result using GRAMMAR approach. The x-axis of the Manhattan plot shows the genomic position, the y-axis represents the log10 base transformed p-values.

Figure┬Ā2
Quantile-Quantile plot of GRAMMAR genome wide association studies result. Inflation factor (lambda) = 1.19 (0.00007).

Figure┬Ā3
Manhattan plot of genome wide association studies result using principal components approach. The x-axis of the Manhattan plot shows the genomic position, the y-axis represents the log10 base transformed p-values.

Figure┬Ā4
Quantile-Quantile plot of principal components genome wide association studies result. Inflation factor (lambda) = 3.31 (0.07).

Table┬Ā1
Allele-counting schemes for discordant half sib pairs
| Case | Half sib genotypes | Alleles counted | ||||
|---|---|---|---|---|---|---|
|
|
||||||
| Scheme 1 | Scheme 2 | |||||
| 1 | 11 | 11 | 1,1 | 1,1 | - | - |
| 2 | 11 | 12 | 1,1 | 1,2 | 1 | 2 |
| 3 | 11 | 22 | 1,1 | 2,2 | 1,1 | 2,2 |
Adapted from Boehnke and Langefeld (1998).
Table┬Ā2
Summary of genomewide rapid association using mixed model and regression
Table┬Ā3
Summary of genomic principal component regression model
Table┬Ā4
Genotype counts for SNP rs109386507
| Unaffected-halfsib genotype | Affected-halfsib genotype | ||
|---|---|---|---|
|
|
|||
| AA | AB | BB | |
| AA | 1 | 18 | 0 |
| AB | 0 | 6 | 0 |
| BB | 0 | 0 | 0 |
Table┬Ā5
Allele counts for SNP rs109386507
| Counting schemes | Alleles | |
|---|---|---|
|
|
||
| A | B | |
| All alleles (scheme 1) | ||
| ŌĆāAffected sibs | 44 | 6 |
| ŌĆāUnaffected sibs | 26 | 24 |
| Discordant alleles (scheme 2) | ||
| ŌĆāAffected sibs | 18 | 0 |
| ŌĆāUnaffected sibs | 18 | 18 |
Table┬Ā6
Predicted SNPs effects by a bayesian mixture model
REFERENCES
Aulchenko YS, De Koning DJ, Haley C. 2007. Genomewide rapid association using mixed model and regression: a fast and simple method for genomewide pedigree-based quantitative trait loci association analysis. Genetics 177:577ŌĆō585.


Aulchenko YS, Ripke S, Isaacs A, van Dujin CM. 2007. GenABEL: An R library for genome-wide association analysis. Bioinformatics 23:1294ŌĆō1296.


Boehnke M, Langefeld CD. 1998. Genetic association mapping based on discordant sib pairs: the discordant-alleles test. Am J Hum Genet 62:950ŌĆō961.


de los Campos G, Gianola D, Allison DB. 2010. Predicting genetic predisposition in human: the promise of whole-genome markers. Nat Rev Genet 11:880ŌĆō886.


de los Campos G, Sorensen D, Gianola D. 2015. Genomic heritability: what is it? PLoS Genet 11:e1005048


Dikmen S, Cole JB, Null DJ, Hansen PJ. 2013. Genome wide association mapping for identification of quantitative trait loci for rectal temperature during heat stress in holstein catlle. PLoS ONE 8:e69202


Fernando RL, Garrick D. 2013. Bayesian methods applied to GWAS. Genome-Wide Association Studies and Genomic Prediction. Gondro C, van der Werf J, Hayes B, editorsHumana Press; Clifton, NJ, USA: p. 237ŌĆō274.

Karaca├Čren B, de Koning DJ, Velander I, Petersen S, Haley CS, Archibald AL. 2010. Alternative association analyses on boar taint using discordant sib pairs experimental design. In : 9th World Congress on Genetics Applied to Livestock Production; Leipzig, Germany. p. 743
Karaca├Čren B. 2012. Some observations for discordant sib pair design using QTL-MAS 2010 dataset. Kafkas Univ Vet Fak Derg 18:857ŌĆō860.

Lee T, Shin DH, Cho S, Kang HS, Kim SH, Lee HK, Kem H, Seo KS. 2014. Genome-wide association study of integrated meat quality-related traits of the Duroc pig breed. Asian Australas J Anim Sci 27:303ŌĆō309.


Littlejohn MD, Henty KM, Tiplady K, Johnson T, Harland C, Lopdell T, Sherlock RG, Li W, Lukefahr SD, Shanks BC, Garrick DJ, Snell RG, spelman RJ, Davis SR. 2014. Functionally reciprocal mutations of the prolactin signalling pathway define hairy and slick cattle. Nat Commun 5:5861


Meuwissen THE, Hayes BJ, Goddard ME. 2001. Prediction of total genetic value using genome wide dense marker maps. Genetics 157:1819ŌĆō1829.


Moser G, Lee HS, Hayes BJ, Goddard ME, Wray NR, Visscher PM. 2015. Simultaneous discovery, estimation and prediction analysis of complex traits using a bayesian mixture model. PLoS Genet 11:e1004969


Olson TA, Lucena C, Chase CC, Hammond AC. 2003. Evidence of a major gene influencing hair length and heat tolarence in Bos taurus cattle. J Anim Sci 81:80ŌĆō90.


Price AL, Patterson NJ, Plenge RM, Weinblatt ME, Shadick NA, Reich D. 2006. Principal components analysis corrects for stratification in genome-wide association studies. Nat Genet 38:904ŌĆō909.


R Development Core Team. 2013. R: A language and environmental for statistical computing. R Foundation for Statistical Computing; Vienna, Austria:
Svishcheva GR, Axenovich TI, Belonogova NM, van Duijn CM, Aulchenko YS. 2012. Rapid variance components-based method for whole-genome association analysis. Nat Genet 44:1166ŌĆō1170.


Yang J, Weedon MN, Purcell S, Lettre G, Estrada K, Willer WCJ, Smith AV, Ingelsson E, OŌĆÖConnell JR, Mangino M, Magi R, Madden PA, Heath AC, Nyholt DR, Martin NG, Montgomery GW, Frayling TM, Hirschhorn JN, McCarthy MI, Goddard ME, Visscher PM. 2011. Genomic inflation factors under polygenic inheritance. Eur J Hum Genet 19:807ŌĆō812.


- TOOLS
-
METRICS

-
- 0 Crossref
- 2 Scopus
- 7,418 View
- 94 Download
- Related articles


 PDF Links
 PubReader
 ePub Link
 Full text via DOI
 Full text via PMC
 Download Citation
 Print
Print


