Effects of alfalfa flavonoids extract on the microbial flora of dairy cow rumen
Article information
Abstract
Objective
The effect of flavonoids from alfalfa on the microbial flora was determined using molecular techniques of 16S ribosome deoxyribonucleic acid (rDNA) analysis.
Methods
Four primiparous Holstein heifers fitted with ruminal cannulas were used in a 4×4 Latin square design and fed a total mixed ration to which alfalfa flavonoids extract (AFE) was added at the rates of 0 (A, control), 20 (B), 60 (C), or 100 (D) mg per kg of heifer BW.
Results
The number of operational taxonomic units in heifers given higher levels of flavonoid extract (C and D) was higher than for the two other treatments. The Shannon, Ace, and Chao indices for treatment C were significantly higher than for the other treatments (p<0.05). The number of phyla and genera increased linearly with increasing dietary supplementation of AFE (p<0.05). The principal co-ordinates analysis plot showed substantial differences in the microbial flora for the four treatments. The microbial flora in treatment A was similar to that in B, C, and D were similar by the weighted analysis. The richness of Tenericutes at the phylum level tended to increase with increasing AFE (p = 0.10). The proportion of Euryarchaeota at the phylum level increased linearly, whereas the proportion of Fusobacteria decreased linearly with increasing AFE supplementation (p = 0.04). The percentage of Mogibacterium, Pyramidobacter, and Asteroleplasma at the genus level decreased linearly with increasing AFE (p<0.05). The abundance of Spirochaeta, Succinivibrio, and Suttonella at the genus level tended to decrease linearly with increasing AFE (0.05<p<0.10).
Conclusion
Including AFE in the diet of dairy cows may alter the microbial composition of the rumen; however its effect on nutrient digestibility remains to be determined.
INTRODUCTION
Flavonoids, in the form of aglycones and glycosides, are principal secondary metabolites of alfalfa. The structure of flavonoids comprises two aromatic rings connected by three carbon atoms, with a general formula C6–C3–C6 [1]. Previous studies have shown a broad range of biological activities for flavonoids, such as anti-inflammatory, antiproliferative activity against cancer cells, and antioxidant capacity [2]. Orhan et al [3] found that flavonoids, such as naringenin-7-O-β-D-glucopyranoside, rutin, etc, had both strong antifungal and antimicrobial properties, as shown by their activity against Pseudomonas aeruginosa, Acinetobacter baumanni, Staphylococcus aureus, Enterococcus faecalis, and Candida krusei. He et al [4] found that flavonoids can inhibit nucleic acid synthesis of microbes and increase the permeability of the cell membrane, resulting in a loss of cytoplasm. Thus flavonoids also have an antimicrobial effect. The rumen, possessing major cellulolytic bacterial populations, highly fibrolytic anaerobic fungi, and protozoa, is a classical host-microbe symbiotic system. The digestion of plant-based feedstuffs and subsequent conversion for energy requirements to the host ruminant are performed in the rumen [5]. Therefore, the microbes in the rumen play an important role in the digestion and absorption of nutrients. Seradj et al [6] found that the concentrations of hydrogenotrophic methanogenic archaea and Methanosarcina spp. in the rumen of steers were inhibited and the abundance of Megasphaera elsdenii was increased by 200 μg/g dry matter of Bioflavex (a citrus extract rich in flavonoid substances from bitter orange and grapefruit) supplementation and its main components (Naringine and Neohesperidine) in vitro, whereas Streptococcus bovis was not affected. Ehsan et al [7] showed that flavonoids,such as flavone, myricetin, catechin, rutin, and kaempferol at the concentration of 4.5% of the substrate(dry matter basis) could reduce the population of rumen microbes and naringin and quercetin could decrease total populations of protozoa and methanogens in vitro. Sivakumaran et al [8] found that the proanthocyanidin extracted from Dorycnium rectum leaves could significantly inhibit Clostridium aminophilum, Butyrivibrio fibrisolvens, and Clostridium proteoclasticum, and the suppressive effect was related to their structure, whereas it could not suppress Ruminococcus albus and Peptostreptococcus anaerobius. In addition, populations of the ciliates, Ruminobacter albus and R. flavefaciens were decreased, and the diversity of Fibrobacter succinogenes was increased in response to flavonoid-rich plant extracts (Punica granatum, Betula schmidtii, Ginkgo biloba, Camellia japonica, and Cudrania tricuspidata) [9]. Thus several studies have illustrated that flavonoids may regulate ruminal flora and that different types of flavonoids from various sources have distinctive effects.
Owing to its advantages of high biomass production, good nutritional quality and wide adaptability, alfalfa is used widely as an animal forage feedstuff. Flavonoids are a major class of alfalfa secondary metabolite. Thus some of the benefits of alfalfa may be attributable to its flavonoid content. The ecological community of the microorganisms in the rumen is very complex. The composition and proportion of microbes are influenced by diet, feed types, age, feeding environment, climate, etc. If the ecological community of the microorganisms in the rumen is changed, the fermentation pattern will be changed. Therefore, the digestion and absorption of feedstuff could be affected by bacterial flora changes. Flavonoids might inhibit bacterial growth and change the bacterial flora of the rumen, so it could affect the digestion of feed in the rumen. We found that AFE supplementation can cause increases in feed intake and alter composition of milk, and may also enhance nutrient digestion. The result of it may be related to bacterial flora changes of the rumen. The molecular technique of 16S ribosome deoxyribonucleic acid (rDNA) analysis is currently widely used in analyzing the microbial diversity of the rumen [10] and was the technique chosen for this study. The study reported here tests our hypothesis that alfalfa flavonoids extract (AFE) could regulate the microbial community of the dairy cow rumen.
MATERIALS AND METHODS
Experimental design and collection of ruminal fluid
For this study, four primiparous Holstein heifers fitted with ruminal fistula were randomly chosen from the Xinghuo Dairy Farm No.2 in Shanghai. The cows had been lactating for 79±6 d and had an average body weight (BW) of 500±25 kg. The experiment used a 4×4 Latin square design with four experimental periods each of 24 d, with 10 days for adaptation. Cows were housed in tie stalls with drinking water freely available. They were allowed an ad libitum intake of a total mixed ration (TMR, Table 1) supplemented with 0 (A, control), 20 (B), 60 (C), and 100 (D) mg AFE per kg of dairy cow BW. The flavonoids extracted from alfalfa (purity: 50%) were bought from Shaanxi Green Bio-engineering Co., Ltd (Xi’an, Shaanxi, China). The cows were fed according to the guidelines of the Feeding Standard for Dairy Cattle in China (NY–T 34–2004). The cows were fed three times daily at 06:30, 13:30, and 19:30, and milked three times daily at 10:00, 16:00, and 22:00. Ruminal fluid was collected from day 20 at 2 h after intake. The samples of ruminal fluid (250 mL) were from different locations within the rumen of each cow, and were squeezed through four layers of muslin cloth. The ruminal fluid was placed in liquid nitrogen for 5 min, and then kept at −80°C prior the extraction of total DNA.

Ingredient and chemical composition of basal diet
MetaVx library preparation and Illumina MiSeq sequencing
For the extraction of total DNA of ruminal microbes, ruminal fluid was thawed in ultrapure water for 20 min and then 300 μL was placed in a centrifuge tube. Total DNA was then extracted using a genome extraction kit (Tiangen Biotechnology Co., Ltd, Beijing, China) according to the manufacturer’s instructions. Next generation sequencing library preparations and Illumina MiSeq sequencing were conducted at GENEWIZ, Inc. (Beijing, China). DNA samples were quantified using a Qubit 2.0 Fluorometer (Invitrogen, Carlsbad, CA, USA) and DNA quality was checked on a 0.8% agarose gel. Five to fifty nanogram DNA was used to generate amplicons using a MetaVx Library Preparation kit (GENEWIZ, Inc., South Plainfield, NJ, USA). A panel of proprietary primers was designed to anneal to the relatively conserved regions bordering V3, V4, and V5 hypervariable regions. The V3 and V4 regions were amplified using forward primers containing the sequence “CCTACGGRRBGCASCAGKVRVGAAT” and reverse primers containing the sequence “GGACTACNVG GGTWTCTAATCC”. The V4 and V5 regions were amplified using forward primers containing the sequence “GTGYCAGCM GCCGCGGTAA” and reverse primers containing the sequence “CTTGTGCGGKCCCCCGYCAATTC”. Besides the 16S target-specific sequence, the primers also contain adaptor sequences allowing uniform amplification of the library with high complexity ready for downstream next generation sequencing on Illumina Miseq. DNA libraries were validated using an Agilent 2100 Bioanalyzer (Agilent Technologies, Palo Alto, CA, USA), and quantified by Qubit and real time polymerase chain reaction (RT-PCR) (Applied Biosystems, Carlsbad, CA, USA). The reaction mixture for the first PCR contained 10×TransStart Buffer (2.5 μL), 30 to 50 ng genomic DNA (5 μL), water (PCR grade, 12.5 μL), 2.5 mM dNTPs (2 μL), primer mix (2.5 μL), and 2.5 U/μL TransStart Taq (0.5 μL). All PCR reactions were carried out using a thermal cycler, with an initial denaturation at 95°C for 180 s, followed by 14 cycles with each cycle comprising denaturation at 94°C for 5 s, annealing at 57°C for 90 s, and extension at 72°C for 10 s; and then a concluding step of extension at 72°C for 300 s. The reaction mixture for the second PCR contained 10×TransStart buffer (2.5 μL), the product of the first PCR (25 μL), water (PCR grade, 10 μL), 2.5 mM dNTPs (2 μL), primer cocktail (4 μL), D50×/D70×(6 μL) and 2.5 U/μL TransStart Taq (0.5 μL). The reactions were carried out as follows: an initial denaturation at 95°C for 180 s, followed by 10 cycles with each cycle comprising denaturation at 94°C for 5 s, annealing at 60°C for 30 s and extension at 72°C for 10 s; and then a concluding step of extension at 72°C for 300 s. DNA libraries were multiplexed and loaded on an Illumina MiSeq instrument according to the manufacturer’s instructions (Illumina, San Diego, CA, USA). Sequencing was performed using a 2×250 or 2×300 paired-end configuration.
Data analysis
The sequences were processed and analyzed using GENEWIZ (GENEWIZ Biotechnology Co., Ltd, Suzhou, Jiangsu, China). Image analysis and base calling were conducted using MiSeq control software (MCS) on a MiSeq instrument. The similarity of sequences at 97% is defined as an operational taxonomic unit (OTU). OTU clustering was carried out by the UCLUST method on the Qiime platform (v1.7). Taxonomy analysis was carried out on the Qiime platform. The rank–abundance curve is an analytical measure of demonstrating diversity. The curve reflects the effective number of sequences in each OTU from a given sample. The figure was drawn using the R programming language. The rarefaction curve is an effective tool to survey the species composition of samples and to predict the relative abundance of samples. It was performed on the Qiime platform. The principal co-ordinates analysis (PCoA), as a visualization method for studying the similarity or dissimilarity of data, was computed using the UniFrac metric on the Qiime platform. Cluster analysis, carried out by the unweighted pair group method with arithmetic mean on the Qiime platform, was used to determine differences in the microbial community between samples. The Ace, Chao, Shannon, Simpson indices and Good’s coverage were calculated by the web (http://www.mothur.org).
Data were analyzed using the PROC general linear model procedure of SAS version 9.2 (Inst. Inc., Cary, NC, USA). The mathematical model used for the analysis was: Yijk = μ+Pi+Cj+ Tk+Eijk; where: Yijk = observed variables, μ = overall mean, Pi = effect of period i (ranging from 1 to 4), Cj = effect of animal j (ranging from 1 to 4), Tk = effect of treatment k (ranging from 1 to 4), and Eijk = random error. The Duncan multiple comparisons test was used to compare treatment means. Less than 0.05 p value was considered to indicate significance and 0.05<p≤0.10 was taken as indicative of a tendency.
RESULTS
Effect of AFE on community richness and diversity
A total of 3,018,861 valid sequences in all samples were analyzed and 2,748,511 good sequences were generated in this study. As shown in Table 2, the number of valid sequences and good sequences in treatment C were significantly higher than those in treatments A and B (p<0.05). The rarefaction curve describes that the species diversity increases with increasing amount of samples. That the rarefaction curve tended to flatten off shows the number of OTU could not increase with an increasing volume of data. It showed the data volume of sequencing was reasonable. The result of this study shows that the data from sequencing were reasonable and could reflect change of most bacterial flora (Figure 1). The rank–abundance curve (Figure 2) reflects the community abundance and species evenness. The large scope of the curve on the abscissa showed that community abundance is high and the flatness of the curve showed that species evenness is high. The rank–abundance curve showed community abundance and species evenness were high in all treatments. Community abundance and diversity were analyzed by means of the Ace, Chao, Shannon, and Simpson indices, and the sequencing depth was calculated by Good’s coverage. The Ace and Chao indexes for treatment C were both significantly higher than for the other groups (p<0.05) (Table 2). The Shannon index of treatment C was also significantly higher (p<0.05). Treatment C showed the greatest number of phyla and genera. The Simpson indices showed an initial increase and then a decrease with increased AFE supplementation, whereas the Good’s coverage was not affected by AFE levels. The result of this study showed that AFE could improve community richness and diversity.

Results of community richness and diversity indexes
The rarefaction curve of sequencing based on OTUs.
OTUs, operational taxonomic units.

The rank-abundance curve of samples based on OTUs.
OTUs, operational taxonomic units.
Effect of AFE on bacterial flora
A total of 55,222 OTUs at 97% similarity in four treatments were generated and all treatments owned 17,209 OTUs, which accounted for 31.16% of the total of OTUs (Figure 3). The number of OTUs in treatments C (41,697) and D (37,276) were higher than those in treatments A (35,132) and B (34,282). The number of unique OTUs in treatments A to D was 1,298, 1,272, 3,202, and 1,556, respectively. The number of OTUs in treatments C and D was higher than in treatments A and B. This indicated that the diversity of bacteria in treatments C and D was higher than in treatments A and B. As shown in Figure 4, the samples in four treatments were well separated. The results of PCoA showed that the treatments displayed obvious differences. The result of cluster analysis is illustrated in Figure 5. The four groups were separated into two clusters; treatments A and B on the one hand and treatments C and D on the other. This indicated that the bacterial flora of treatments A and B were similar and that those of treatments C and D were similar. Thus the levels of AFE in the diet could affect the bacterial flora of the rumen.
Venn diagram of OTUs in the four treatments A–D.
OTUs, operational taxonomic units.
The weighted unifrac principal co-ordinates analysis plot for samples in treatment (A–D).

The weighted unifrac unweighted pair group method with arithmetic (UPGMA) tree for each treatment (A–D).
Effect of AFE on bacterial flora at the phylum and class level
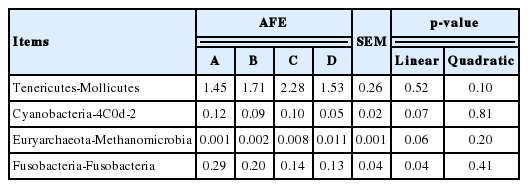
As shown in Table 3, with increasing AFE supplementation the proportion of Bacteroidetes was reduced and the proportion of Firmicutes was increased, but they showed no statistically significant difference from each other. The proportion of Bacteroidetes in treatments B to D showed a continuous increase, whereas the proportion of Firmicutes showed the opposite result. The richness of Tenericutes showed a tendency to increase with dietary AFE supplementation (p = 0.10). The proportion of Euryarchaeota increased linearly, whereas the proportion of Fusobacteria decreased linearly with increasing levels of AFE (p = 0.04). The proportion of other bacteria, with the exception of Actinobacteria in treatments B to D, showed an initial increase and then a decline in response to an increasing dose of AFE. The proportion of Mollicutes and Methanomicrobia showed a tendency to increase with dietary AFE supplementation (0.05<p≤0.10), whereas the aboundance of 4C0d-2 showed the opposite result (Table 4).
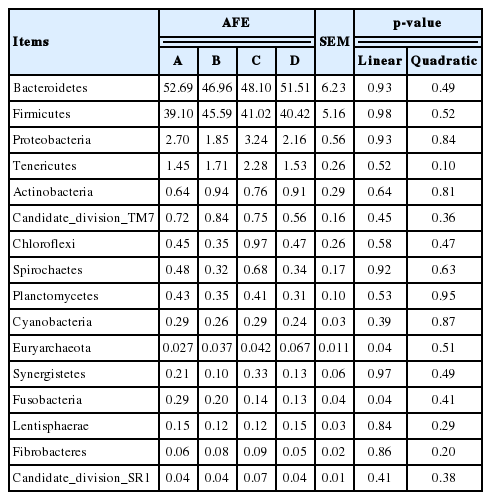
Effect of AFE on bacterial community in rumen fluid at the phylum level
Effect of AFE on bacterial community in rumen fluid at the class level
Effect of AFE on bacterial flora at the genus level
As shown in Table 5, the percentage of Mogibacterium, Pyramidobacter, and Asteroleplasma decreased linearly with increasing feeding rates of AFE (p<0.05). The abundance of Spirochaeta, Succinivibrio, and Suttonella tended to decrease linearly with increasing dietary inclusion of AFE (0.05<p<0.10). The abundance of Pseudomonas in treatment C was significantly higher than that in treatment B (p<0.05), but the abundance of Sutterella showed the opposite result. The abundance of Roseburia in treatment D was significantly higher than that in treatment C (p<0.05). The populations of other bacteria were not affected by increasing the dose of AFE supplementation.

Effect of AFE on bacterial community in rumen fluid at the genus level
DISCUSSION
High throughput sequencing methodology has been widely used in studying microbial flora in ruminants as a means of quickly and efficiently determining the microbial community structure of the rumen [11]. The overall effect of flavonoids in regulating the bacterial flora could therefore be characterized using high-throughput sequencing methods. In the present study, the rarefaction curve for samples analyzed by high-throughput sequencing was relatively flat. This showed that the data from our study were reasonable. In general, a similarity of 16S rDNA sequence of more than 97% is defined as an OTU corresponding to a bacterial species. The number of OTUs was increased by the level of AFE supplementation in this study. It showed that AFE changed the microbial community structure of the rumen.
The Ace and Chao indices are used to estimate the total num ber of microbial species. The Shannon and Simpson indices are used for estimating microbial diversity. Higher values of these latter indices indicate a higher level of community diversity. Flavonoids could generate an antimicrobial and antifungal effect by inhibiting bacterial nucleic acid synthesis and by destroying the bacterial cytomembrane [4]. The microbial diversity of the rumen might therefore be reduced by AFE. The number of phyla and genera in the rumen of a dairy cow with a diet containing 20 mg/kg BW AFE was lower than that of a cow without AFE supplementation. The results of previous studies showed that flavonoids could inhibit Escherichia coli, Staphylococcus aureus, and Enterococcus faecalis [12,13], whereas could not affect Streptococcus bovis [6]. Previous studies showed that not all bacteria could be inhibited by flavonoids. There is a range of microbes in the rumen, with relationships including mutualism, antagonism, competition, parasitism, and predation. Bacteriostatic action and flavonoid dose showed a positive correlation; a higher dose of flavonoids produced a stronger antibacterial effect [14]. However, in the present study, the number of microbial species and microbial diversity in the groups receiving from 60 mg/kg BW to 100 mg/kg BW of AFE was increased. Possible explanations of these results are that: i) the flavonoids inhibited the growth of pathogenic bacteria and then promoted the growth of other microbes in competition with them; ii) flavonoids may be degraded by gut microbes. It has been reported that over a particular concentration range the degradation rate of flavonoids is increased with increasing dose of flavonoids [15]. An increasing quantity of microbial flavonoid degradation products is therefore generated.
Previous studies have found that the principal phyla of micro bes in the rumen are Firmicutes, Bacteroidetes, and Proteobacteria. The results of this study confirm previously reported proportions of these three phyla to be about 91% of the total [16,17]. Tenericutes, as a class of bacteria distinguished by the absence of a cell wall contains the class Mollicutes [18]. The primary genera includes the Mycoplasma, Spiroplasma, Ureaplasma, and Phytoplasma. Most of them have sterols that make the cell membrane somewhat more rigid. Mollicutes are parasites of various animals and plants, living on or in the host’s cells. To maintain their parasitic mode of life, the Mollicutes have developed rather sophisticated mechanisms to colonize their hosts and resist the host immune system. Tenericutes bacteria are sensitive to tetracycline antibiotics. Flavonoids might not, therefore, be inhibitory to them; instead, flavonoids might inhibit the growth of bacterial competitors of the Tenericutes, and thereby promote the growth of Tenericutes class bacteria. Euryarchaeota, as a major class of Archaea, contain Methanogenus, Halobacterium, and some hyperthermophilic anaerobic and aerobic bacteria. This study found that the abundance of Methanomicrobia was increased by an increasing level of AFE. Therefore, the reason for increasing the abundance of Euryarchaeota was that AFE may promote the growth of bacteria of the class Methanomicrobia. It indicated that diet supplemented flavonoids extracted from alfalfa might promote methanogenesis. Ma et al [19] found that mulberry leaf flavonoids decreased ruminal populations of methanogens. In addition, naringin and quercetin significantly suppressed the growth of methanogens [7] and showed that flavonoids could inhibit methanogenesis. The result of this study was different and indicated that flavonoids from different sources have different effects. The phylum Fusobacteria, commonly found in the oral cavity, is a phylum of anaerobic gram-negative bacilli with fusiform morphology [20,21]. The results of the present study showed that AFE could inhibit bacteria of the Fusobacteria and the effect was positively correlated with dose. There are four characterized rumen Prevotella spp.: P. ruminicola, P. bryantii, P. albensis, and P. brevis [22], which degrade protein, starch, and fibre, thus playing a vital role in feed digestion. This study confirms the results of previous studies which showed that Prevotella was the dominant bacterium in the rumen [23]. Furthermore, the abundance of Prevotella was reduced with increasing dose of AFE, indicating that AFE may inhibit the growth of Prevotella. The genus Pyramidobacter comprises strains that are anaerobic, non-motile, asaccharolytic bacilli that produce acetic and isovaleric acids and small quantities of propionic and isobutyric acids [24]. Succinivibrio could ferment sugars and produce acetic and succinic acids as end-products of metabolism [25]. In the present study, the abundance of Pyramidobacter and Succinivibrio was found to be reduced by AFE. The alfalfa flavonoids may decrease the content of acetic acid in the rumen. However, acetic acid could be transformed into methane by Methanobacteria, or be used by the cow in the synthesis of milk fat [26]. The results of this study showed that AFE may have the effect of reducing both methane and milk fat. Lee et al [27] found that acetate stimulated particularly the growth of Spirochaetes. The reduction in the abundance of Spirochaeta in the present work may be because AFE reduced the generation of acetic acid. Mogibacterium has been isolated from the periodontal pockets of adult human patients with periodontal disease and infected root canals [28]. Asteroleplasma are compulsory parasites/pathogens of vertebrates [29]. In the present study, AFE had the effect of inhibiting Mogibacterium and Asteroleplasma. This indicated that AFE has the potential to protect animals from diseases caused by Mogibacterium and Asteroleplasma. Suttonella is a gram-negative coccobacillus that can produce indole and ferment sucrose and glucose [30]. Many studies have shown that indole plays a vital role as an intercellular signaling molecule in some enteric pathogens such as Escherichia coli, Edwardsiella tarda and Vibrio cholera. The drug resistance and pathogenicity of pathogenic bacteria could be reduced by degrading or inhibiting the accumulation of indole signal molecules. AFE might therefore affect the release of indole and thereby influence competition within microbial consortia.
CONCLUSION
The study found that a diet supplemented with 60 to 100 mg/kg BW AFE could increase the abundance and diversity of the rumen microbial community. At the phylum level, Firmicutes, Bacteroidetes, and Proteobacteria were the dominant bacteria and all were unaffected by AFE. However, the populations of both Tenericutes and Euryarchaeota were increased by AFE, whereas the population of Fusobacteria was decreased. At the genus level, the dominant bacteria, such as Prevotella, RC9, Flavonifractor, and Butyrivibrio, showed no significant effect by AFE. However, AFE could decrease the abundance of Mogibacterium, Pyramidobacter, Asteroleplasma, Spirochaeta, Succinivibrio, and Suttonella. The results of the study showed that AFE altered the community composition, with changes at both the phylum and genus levels.
ACKNOWLEDGMENTS
This study was supported by the National Natural Science Foundation of China (No. 31572430), the Priority Academic Program Development of Jiangsu Higher Education Institutions.
Notes
CONFLICT OF INTEREST
We certify that there is no conflict of interest with any financial organization regarding the material discussed in the manuscript.