Optimal population size to detect quantitative trait loci in Korean native chicken: a simulation study
Article information

Abstract
Objective
A genomic region associated with a particular phenotype is called quantitative trait loci (QTL). To detect the optimal F2 population size associated with QTLs in native chicken, we performed a simulation study on F2 population derived from crosses between two different breeds.
Methods
A total of 15 males and 150 females were randomly selected from the last generation of each F1 population which was composed of different breed to create two different F2 populations. The progenies produced from these selected individuals were simulated for six more generations. Their marker genotypes were simulated with a density of 50K at three different heritability levels for the traits such as 0.1, 0.3, and 0.5. Our study compared 100, 500, 1,000 reference population (RP) groups to each other with three different heritability levels. And a total of 35 QTLs were used, and their locations were randomly created.
Results
With a RP size of 100, no QTL was detected to satisfy Bonferroni value at three different heritability levels. In a RP size of 500, two QTLs were detected when the heritability was 0.5. With a RP size of 1,000, 0.1 heritability was detected only one QTL, and 0.5 heritability detected five QTLs. To sum up, RP size and heritability play a key role in detecting QTLs in a QTL study. The larger RP size and greater heritability value, the higher the probability of detection of QTLs.
Conclusion
Our study suggests that the use of a large RP and heritability can improve QTL detection in an F2 chicken population.
INTRODUCTION
The application of genomics in agriculture focuses on identifying genes responsible for economically important traits in plants and animals. Some of these traits are characterized by wide variability in the expression of genes at certain loci, i.e., quantitative trait loci (QTL). A genomic region associated with a particular phenotype is called QTL. Classification of the chromosomal regions containing QTLs could be useful in marker-assisted selection to increase breeding efficiency [1]. Also, the combination of a molecular linkage map with powerful statistical approaches enables the genetic partition of complex traits. Chicken has particular advantages in such analysis due to its short life cycle and many offspring [2]. However, several factors could influence detection of QTLs, such as genotyping errors, training population size, phenotypic data replication levels, and various environmental effects. The evaluation of some of them is either difficult or time consuming in practice. As an alternative, simulation experiments are generally performed for the evaluation of such factors [3].
A simulation study allows the testing of several theories, permitting an unravelling of the multifaceted evolutionary patterns that are otherwise difficult to understand. For example, the elucidation of the history of human migration provides significant insight into the present patterns of DNA variation in humans [3–5]. Simulation studies of beef cattle and other livestock have provided information on their potential for genomic evaluation. Studies have included the prediction of total genetic value [6], genomic prediction of simulated multi-breed and purebred cattle [7], genomic selection accuracy in simulated populations [8], and a comparison between single- and two-step genomic best linear unbiased prediction methods in simulated beef cattle [9,10]. The chicken 60K single-nucleotide polymorphism (SNP) panel currently provides a level of genome coverage and map resolution that are unavailable from microsatellite markers. The high density SNP panel also has the potential to achieve improved accuracy in determining QTL locations. An F2 population is useful for detecting QTLs because it is a cross between two populations differing phenotypically in a trait [2]. Ledur et al [11] showed that designed populations, such as F2 populations for use in genome-wide association studies (GWAS), had advantages over random populations in terms of reducing the false discovery rate and improving mapping accuracy. Several experiments have been conducted based on this design in different livestock species. The design is especially useful in pigs and chickens because of their shorter generation interval and higher prolificacy than other species. The objective of this study was to investigate the optimal size of an F2 population in QTL detection through simulation using QMSim software.
MATERIALS AND METHODS
Simulation of F2 population, population structure, and simulation parameters
The number of QTLs was examined in two different F2 populations. A total of six chicken populations were simulated, including Line 1 and Line 2, which performed as a typical sire and dam population, respectively. The crossing of males of Line 1 and females of Line 2 produced the F1a population, whereas mating of males of Line 2 and females of Line 1 produced F1b population. Similarly, the males of F1a and females of F1b produced the F2a population, and the females of F1a and males of F1b created the F2b population in this study. However, we did not include the effect of mating system in this study.
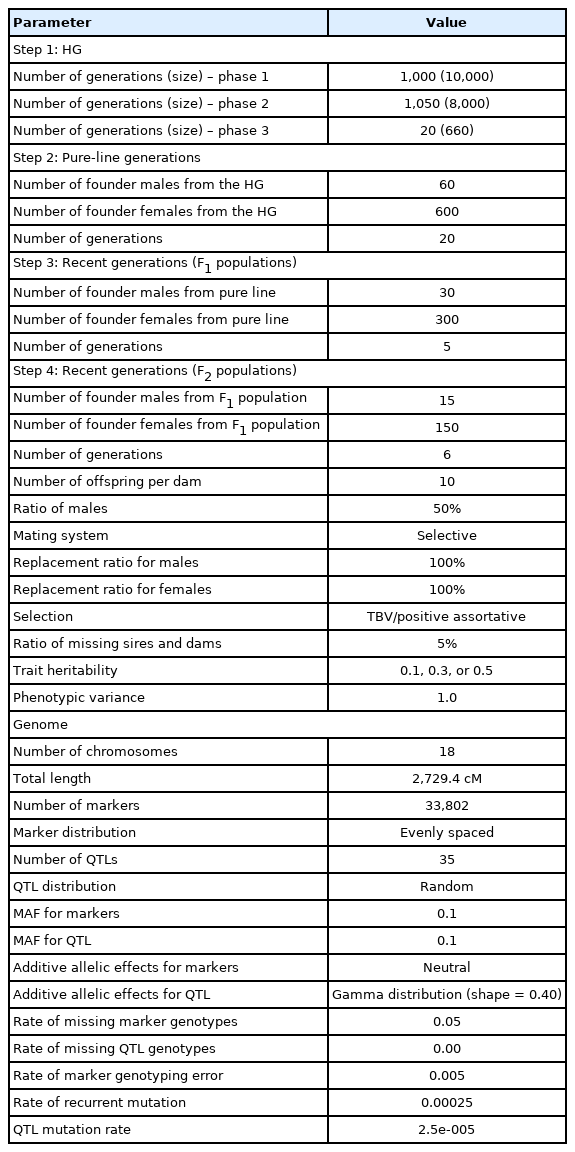
The QMSim software package [12] was used for simulation of phenotypic and genotypic datasets of the populations. These simulated datasets mimicked the actual population structures and extent of linkage disequilibrium (LD) existing in the Korean native chicken population [13]. Table 1 summarizes the parameters for simulation. A 50K marker-density panel was simulated to generate bi-allelic markers distributed across 18 autosomal chromosomes of different lengths. In the beginning, a historical population (HP) was simulated, which had a constant size of 10,000 individuals across 1,000 generations. Then, the size was gradually reduced to 8,000 individuals in the subsequent 1,050 generations to create an initial LD and mutation-drift equilibrium. The number of individuals produced for each sex was equal (equal probability of being male or female), and the mating performed among parents was random. For simulating two different pure lines (Lines 1 and 2), 60 males and 600 females were selected from the last generation of the HP. As Line 1 acted as a sire population, individuals selected from this population were based on a higher true breeding value (TBV). Oppositely, Line 2 being the dam population, the selection of individuals from Line 2 was based on a lower TBV. The mating design in each population was based on positive assortative mating. A total of 660 selected individuals was used as the effective population size, Ne was simulated across 20 generations, with each dam producing 10 offspring per generation in all simulations. A total of 330 individuals (30 males and 300 females) were chosen from the last generation of HP and bred for five generations to create two different F1 populations (F1a and F1b). Finally, 15 males and 150 females were randomly chosen from the last generation of each F1 population and randomly bred for six more generations to create two different F2 populations (F2a and F2b), following a similar mating design as described earlier. The replacement ratio for both sires and dams was 100%. Traits with a phenotypic variance of 1 and heritability levels of 0.1, 0.3, and 0.5 were used in the simulation. Three reference populations (RP) consisting of 100, 500, and 1,000 individuals were created through a random selection of individuals from generations 5 and 6 of F2 population.
Population structure and simulation parameters
Our simulated genome comprised 18 pairs of chromosomes, with a length identical to the actual Korean native chicken genome length of 2,729.4 cM [13]. A marker density of 50K was selected to ensure sufficient density for segregating bi-allelic loci. The effect of markers on traits was neutral and the effect of QTL was considered to explain 100% of the genetic variance. The whole-genome consisted of 35 QTLs, where these segregated QTLs consist of 2 to 4 alleles per loci (randomly distributed), with a minor allelic frequency greater than 0.01. The additive genetic effect of the QTL was sampled from a gamma distribution, with a parametric shape equal to 0.4. The rate of missing marker genotype and marker genotyping error was 0.05 and 0.005, respectively. A recurrent mutation rate of 10−5 was used for markers and QTLs throughout the simulation to obtain a mutation-drift equilibrium in the population. Phenotypes were generated by adding random residuals to the QTL effects.
Statistical model for quantitative trait loci detection
The F2 population was chosen as the RP as their parents were produced by crossing two different families. In GWAS, all markers are required to be in LD, with causal variants in close proximities. All SNPs were coded as AA = 0, AB = 1, and BB = 2, respectively [14]. The statistical model was as follows:
where y is the phenotype of individuals; μ is the overall mean, CGi is the vector of fixed contemporary group effect for generation by sex; b1 is the fixed/random effect of marker genotype; SNPk is the recoded marker genotype (0, 1, and 2); A1 is the vector of the random polygenic effect with
To map QTLs, a modified Bonferroni-type multiple testing correction threshold was used [15] to restrict the experiment-wise error rate to 0.05 [16].
RESULTS AND DISCUSSION
To investigate the optimal size of an F2 population in QTL detection, QMSim software was used to simulate data sets derived under different scenarios (e.g., h2 = 0.1, 0.3, and 0.5; RP size = 100, 500, and 1,000), as shown in Figure 1, 2, and 3. Across the RP sizes, we observed an overall increase in the number of significant QTLs across the different chromosomes.

Manhattan plot of QTL detection profiles for an F2 chicken population showing the −log10 p-values across the 18 chromosomes with a heritability of 0.1 for RP sizes of 100, 500, and 1,000. Red triangles and dotted lines indicate possible locations of QTLs and the genome-wide significant threshold, respectively. Note that GWAS based on 100 animals with 0.1 heritability should be as (a) RP of 100 with h2 of 0.1, (b) RP of 100 with h2 of 0.3, (c) RP of 100 with h2 of 0.5. QTL, quantitative trait locus; RP, reference population; GWAS, genome-wide association studies.

Manhattan plot of QTL detection profiles for an F2 chicken population showing the −log10 p-values across the 18 chromosomes with a heritability of 0.3 for RP sizes of 100, 500, and 1,000. Red triangles and dotted lines indicate possible locations of QTLs and the genome-wide significant threshold, respectively. QTL, quantitative trait locus; RP, reference population.

Manhattan plot of QTL detection profiles for an F2 chicken population showing the −log10 p-values along the 18 chromosomes with a heritability of 0.5 for RP sizes of 100, 500, and 1,000. Red triangles and dotted lines indicate possible locations of QTLs and the genome-wide significant threshold, respectively. QTL, quantitative trait locus; RP, reference population.
With a RP size of 100, no QTL was detected to satisfy Bonferroni value at three different heritability levels. In a RP size of 500, two QTLs were detected when the heritability was 0.5. With a RP size of 1,000, 0.1 heritability was detected only one QTL, and 0.5 heritability shows that five QTLs were detected. To sum up, RP size and heritability are playing a key role to detect QTLs in the QTL study. This result implies that RP sizes should be increased in accordance with heritability in an F2 chicken population. With a RP size of 1,000, many QTLs were detected at different h2 levels of traits, even at the h2 value of 0.1 (Figure 1). The results of this study imply that increasing the RP size and heritability level improved QTL detection in an F2 population. However, the optimal RP size for QTL detection should be at least 500 individuals across scenarios of traits with low to high heritability levels (h2 = 0.1, 0.3, and 0.5) to obtain more significant QTLs in an F2 chicken population. These results support an earlier study by Hocking [17], who detected QTLs for production traits in F2 crosses between 250 to 700 birds of two breeds. In 1992, the Korean government launched the nationwide Korean native chicken restoration project, which was mainly administered by the National Institute of Animal Science (NIAS) and focused on the development of meat-type native chicken lines [18]. As part of this project, Korean Ogye and White Leghorn cross populations were investigated for the determination of QTLs and eventually, the causative mutations for meat- and egg-related traits. The results of the present study can be used as an initial framework for designing and implementing QTL detection in an F2 chicken population, especially cross populations between the Korean Ogye and White Leghorn breeds. However, the population structure and genetic architecture of traits should also be considered to optimize the RP sizes for QTL detection in the chicken industry.
CONCLUSION
In general, a large RP size (1,000) had a positive effect on QTL detection compared with a RP size of 100 or 500. The RP size and heritability levels should be considered for QTL detection in an F2 chicken population.
Notes
CONFLICT OF INTEREST
We certify that there is no conflict of interest with any financial organization regarding the material discussed in the manuscript.
FUNDING
This work was carried out with the support of the “Cooperative Research Program for Agriculture Science and Technology Development (Project No. PJ0157852022),” Rural Development Administration, Republic of Korea.