Go to Top Go to Bottom
Kang, Kang, Lee, An, Kim, Lee, and Kim: Characterizations of Shell and Mantle Edge Pigmentation of a Pacific Oyster, Crassostrea gigas, in Korean Peninsula

Abstract

The objectives of this study were to investigate color patterns of shell and mantle edge pigmentation of a Pacific oyster, C. gigas, and to estimate variance components of the two colors. A sample of 240 F0 oysters was collected from six aquaculture farms in Tongyeong, Korea to measure shell color and mantle edge pigmentation. Among the F0s, male and female individuals with black (white) shell and black (white) mantle edge were selected and mated to generate three F1 full-sib black (white) cross families (N = 265). Two and four F2 cross families (N = 286) were also produced from black and white F1 selected individuals, respectively. Variance component estimates due to residuals and families within color were obtained using SAS PROC VARCOMP procedures to estimate heritability of shell and mantle edge pigmentation. In the F0 generation, about 29% (11%) had black (white) color for both shell and mantle edge. However, in the F1 and F2 black (white) cross families, 75% (67%) and 100% (100%) of oysters had black (white) shell colors, and 59% (23%) and 79% (55%) had black (white) mantle edge, respectively. Spearman correlation coefficients between shell and mantle edge color were 0.25, 0.74, and 0.92 in F0, F1, and F2 generations, respectively, indicating that, with generations of selection process, an individual with black (white) shell color is more likely to have black (white) mantle edge pigmentation. This suggests that shell color could be a good indicator trait for mantle edge pigmentation if selection of both the colors is implemented for a couple of generations. Estimates of heritability were 0.41 and 0.77 for shell color and 0.27 and 0.08 for mantle edge pigmentation in the F1 and F2 generations, respectively, indicating that, in general, significant proportions of phenotypic variations for the shell and mantle edge colors are explained by genetic variations between individuals. These results suggest that the two color traits are inheritable and correlated, enabling effective selection on shell and mantle edge color.

INTRODUCTION

Annual production of the Pacific oyster, Crassostrea gigas, in Korea, is 3.5 million ton, which occupies 90% of the total shellfish production (MIFAFF, 2012). Production of diverse lines through a breeding program and management of mother shell for the production of artificial seeds are essential to increase volume and quality of the oysters. As in other aquatic species, one of the most important traits in Pacific oyster aquaculture is fast growth rate, even after the introduction of triploid techniques (Guo and Allen, 1994) caused increase of production volume. In addition to the growth enhancement, traits responsible for disease resistance, e.g. to Haplosporidium nelson in eastern oysters, Crassostrea virginica (Haskin and Ford, 1979; Allen Jr., 1998), resistance to Bonamia in European fat oysters, Ostrea edulis (Naciri-Graven et al., 1998) and resistance to Marteilia sydneyi in Sydneyrock oyster, Saccostrea glomerata (Nell and Perkins, 2006) have been successfully introduced. Recently, a color factor, i.e. shell and mantle colors, has been regarded as a new high potential trait for a better commercial value (Ward et al., 2000; Brake et al., 2004).
It is known that color of seafood plays a key role for consumer choice because it influences taste thresholds, sweetness perception, food preference, pleasantness, and acceptability (Clydesdale, 1993). For example, consumers are willing to pay more for the rich red salmon fillets (Steine et al., 2005; Alfnes et al., 2006). The shell and mantle color of the Pacific oyster also influence consumer preferences of oysters. For example, some “golden” oysters, displaying an orange/bronze or “golden” mantle and shell, have been developed and maintained for the color despite slow growth of the oysters (Nell, 2001). The mantle color of the Pacific oyster is, therefore, one candidate trait for the Molluscan Broodstock Program (MBP) of the United States (Brake et al., 2004). In Korea, the Pacific oyster with black mantle are favored by consumer and traded at about 20% higher price. However, no strain or line with black mantle has been yet established by systematic breeding plans.
Selection has been successfully implemented for the color manipulation of edible and ornamental aquaculture species (Gomelsky, 2011). Some color traits of aquatic animals are inherited either by qualitatively (non-additive) or quantitatively (additive). Examples of non-additive inherited color traits are pigmentation in rainbow trout, red and white color patterns in koi carp, and color in Tilapia sp. (Thorgaard et al., 1995; Gomelsky et al., 1996; Lutz, 2001). In contrast, the color traits of coho salmon, Atlantic salmon, and rainbow trout are known to be inherited in additive fashion (Gjerde and Gjedrem, 1984; Gjerde and Schaeffer, 1989; Withler and Beacham, 1994).
There are few studies on genetics of shell or mantle pigmentation of Pacific oysters. Brake et al. (2004) reported positive correlation between pigmentation of shell and mantle edge. Evans et al. (2009) reported that shell pigmentation was an inheritable trait in a continuous distribution fashion in most of the twenty-six full-sib families that were derived from parents collected from a naturalized population.
In this study, F1 and F2 families of the Pacific oyster were produced by crossing F0 parents with black and white shell pigmentations, in order to characterize distribution patterns and relationship of colors between shell and mantle edge, and to estimate heritability of the two traits, which can provide valuable information for the efficient breeding of shell and mantle edge colors in Korean oyster populations, where various types of the two phenotypes exist.

MATERIAL AND METHODS

Data collection

Parents were chosen from six aquaculture farms in Tongyeong, Gyeongsangnam-Do, Korea. The parents were produced in 2010 by collecting naturally produced larvae and cultured in aquaculture farms using a hanging method of seeded culture. Six F1 families were generated by single-pair mating with the greatest scores for each color, i.e. black (male)×black (female) or white (male)×white (female) cross. The larvae were settled onto cultch and cultured as described above. Among the F1 individuals, siblings with the greatest scores for each color were chosen as F1 parents at the age of 12 months, such that two and four F2 families were generated by black×black and white×white F1 cross, respectively. For the mating, naturally matured gametes were obtained by strip-spawning and consequently fertilized. Each family was kept in separate tank and seeded on different rope for hanging culture. After 5 month culture, 30 to 50 individuals from each F1 or F2 family were measured for shell color and mantle edge pigmentation; 45, 32, and 39 for black F1, 54, 51, and 44 for white F1, 34 and 51 for black F2, and 51, 50, 50, and 50 for white F2 families, respectively. A control sample of F0 240 individuals that were collected from six aquaculture farms in Tongyeong area in 2011 was also used to measure shell color and mantle edge pigmentation.

Measurement of shell and mantle edge pigmentation

Shell color and mantle edge pigmentation were classified into six and ten levels, respectively, depending on magnitude of darkness. The category of shell color was similar to Imai and Sakai (1961) and Brake et al. (2004), in which shell pigmentation was classified into five and four levels, respectively. However, six levels of shell color were applied in this study for better discrimination of color variation. The categories of the shell pigmentation were as follow:
  1. Left and right shells are all white, no pigmentation present - score 0,

  2. One shell is white and the other shell is pigmented over 50% - score 1,

  3. Left and right shells are pigmented less 50% - score 2,

  4. One shell is white and the other shell is pigmented over 80% - score 3,

  5. One shell is pigmented less 50% and the other shell over 80% - score 4,

  6. Both the left and right shells are pigmented over 80% - score 5.

The mantle edge pigmentation were scored from 1 to 10 by eyes according to the neutral color scheme that represented snow white, pearl white, silver gray, metal gray, aluminum gray, slate gray, charcoal gray, carbon black, and real black, respectively.

Data analysis and estimation of heritabilities

The data for shell color and mantle edge pigmentation were analyzed to test any phenotypic difference between the two colors (black and white) in F1 or F2 generation. The following linear model was used:
Yijk=μ+Ci+Famj(Ci)+eijk,
Where Yijk represent measurement of pigmentation (shell or mantle edge) of kth individuals in jth family within ith color (1: black, 2: white), Ci represent the fixed effect of color i, Famj(Ci) represent the random effect of jth family nested within ith color, eijk represent the residual of kth individual of jth family within ith color. The model was analyzed using SAS GLM procedure (SAS Institute, 2000, Cary, NC, USA), and variance components of the residual (σ2e) and family (σ2F) effects were estimated using SAS PROC VARCOMP option. Estimates of the variance components were obtained for each F1 and F2 generation. The additive genetic variance (σ2g) could be estimated under a full-sib family structure (Falconer and Mackay, 1996) as σ2g = 2σ2F, and a narrow sense heritability (h2) was obtained as h2 = σ2g/(σ2g2e). Spearman correlation coefficients between phenotypes of shell color and mantle edge pigmentation were also calculated using SAS PROC CORR option.

RESULTS

Distribution of F0, F1, and F2 oysters for shell and mantle edge pigmentation

Among the 240 F0 individuals, proportion of the oysters with black shell (level 4 and 5) and black mantle edge (levels 8 to 10) was 29.2%, 10.8% with white shell (level 0 and 1) and white mantle edge (levels 1 to 3), 8.1% with white shell and black mantle edge, and 1.3% with black shell and white mantle edge, respectively. The rest (50.6%) of the F0 oysters had shell colors with level 2 or 3 and mantle edge colors with level 4 to 7. The overall mean and standard deviation of shell color and mantle edge pigmentation in F0s were 2.59±1.55 and 6.33±2.30, respectively, ranging 2.27 to 3.07 for shell color and 5.30 to 7.70 for mantle edge pigmentation, respectively. The Pearson correlation coefficient between shell color and mantle edge pigmentation in the F0 individuals was 0.25 (p<0.0001).
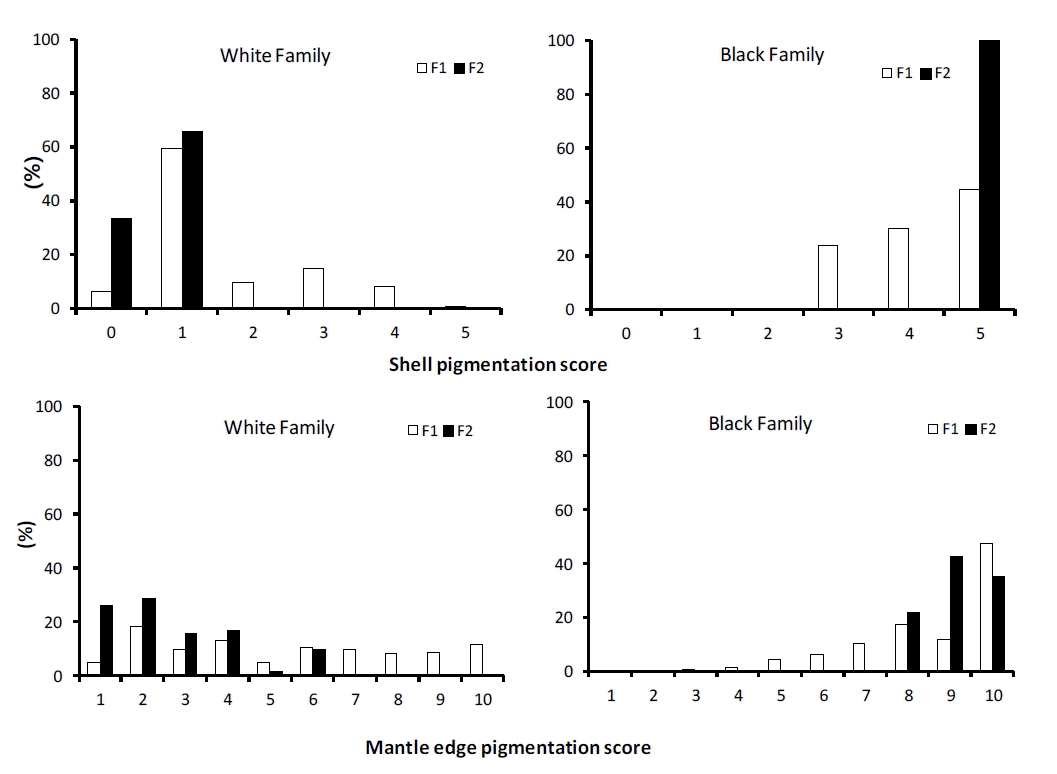
Means and standard deviations of shell color and mantle edge pigmentation in F1s and F2s are described in Table 1. In the black cross families, the overall means (standard deviation) were 4.19 (0.83) and 5.00 (0.00) for shell color, and 8.60 (1.70) and 9.20 (0.77) for mantle edge pigmentation in the F1 and F2 generations, respectively. Especially, all F2 individuals in the black cross families had black shell color with the maximum level of five, i.e. with zero standard deviation. In contrast, in the white cross families, the average values of shell color were 1.60 (1.11) and 0.67 (0.48) in the F1s and F2s, and 5.40 (2.88) and 2.72 (1.57) for mantle edge pigmentation in the F1s and F2s, respectively. Proportions of oysters with black shell (level 4 and 5) were 75% and 100% in the F1 and F2 black cross, and 67% and 100% with white shell (level 0 and 1) in the F1 and F2 white crosses families, respectively (Figure 1). Similarly, proportions of offspring with black mantle (level 9 and 10) were 59% and 79% in the F1 and F2 black cross, while 23% and 55% of oysters had white mantle edge (level 1 and 2) in the white F1 and F2 cross families, respectively (Figure 1). These results show that the frequencies of individuals with black (white) shell and black (white) mantle edge in black (white) cross F2 families were greater (smaller) than in the F1 families with the corresponding colors (Figure 1). Also, standard deviations of the two color traits in the F2s were smaller than in the F1s, indicating that F2 individuals had more homogeneous colors of shell and mantle edge than the F1s in the black or the white crosses (Table 2). Also, the phenotypic relationship between shell color and mantle edge pigmentation was greater in the F2s than in the F1s, i.e. the Spearman correlations between the two traits were 0.92 and 0.74 in the F2 and F1 generations, respectively (p<0.0001).

Analysis of variance and estimation of heritability

The effects of color and families nested within color on shell and mantle edge pigmentation were significantly different (p<0.05) in both F1 and F2 generations (Table 2). The effects of color or family were much more significant in F2 than in F1, expect for the family effect of mantle edge color. This may be partly due to smaller estimates of the error (residual) variances in F2s.
Estimates of variance components showed that the residual, family (genetic) and phenotypic variances in F2 generation were smaller for both shell and mantle edge colors than in F1 (Table 3). Estimates of heritability were 0.41 and 0.77 for shell color and 0.27 and 0.08 for mantle edge pigmentation in F1 and F2 generations, respectively.

DISCUSSION

The Pacific oyster with black mantle edge is favored by Korean consumers. However, specific lines for the trait were not developed, because the genetics of this pigmentation has not been studied, let alone genetic relationship of the trait with shell pigmentation. Although, the relationship between shell and mantle pigmentation (Brake et al., 2004), and heritability of shell pigmentation (Evans et al., 2009) in Pacific oyster were reported, the results need to be verified for the oysters in Korea. In this study, we produced two generations of the Pacific oyster from a random oyster sample population by crossing individuals with black or white color for both shell and mantle edge, and analyzed the phenotypes to characterize relationship between shell and mantle edge pigmentation and to estimate heritabilities of the two color traits.
Analysis of a natural population (F0), from which F1 parents were produced, showed that pigmentation of shell and mantle edge had various patterns. Among the F0s, 40% of individuals had consistent colors, i.e. with black or white for both shell and mantle edge, while half (50.6%) of the F0 individuals had pigmentation of medium level for the two color traits. However, the individuals with black shell and white mantle edge represented only 1.3% (3 out of 240). These results suggest that oysters with black (white) shell have more tendency to have black (white) mantle, as reported by Brake et al. (2004). In fact, the oysters with black shell and black mantle edge or white shell and white mantle edge were 29.2% and 10.8% of the F0 population, respectively (data not shown).
Intrigued by the results, individuals with black or white color for both shell and mantle edge were selected and crossed for two (F1 and F2) generations. Analyses of shell and mantle pigmentation of the F1 and F2 families showed that there were increasing proportions of individuals with the same color for both shell and mantel edge with generation, i.e. more F2s had black (white) color for both shell and mantle edge than the F1s in black (white) cross families (Table 1). These results suggest that selection based on shell and mantle edge color is effective in the Pacific oyster in Korea, and that the two colors are heritable traits, which were supported with the heritability estimates (Table 3). Spearman correlation coefficients between shell and mantle edge color were 0.25, 0.74, and 0.92 in F0, F1, and F2 generations, respectively, indicating that the relationship between the two colors were stronger in successive generations. Brake el al. (2004) also found the positive correlation (r = 0.578) between the two color traits in the Pacific oyster, i.e. the correlation was statistically significant in two of the three cohorts, in which selection programs for growth were implemented. This result strongly suggest that selection considering both for shell and mantle edge color is very effective, and thus, with generations, an individual with black (white) shell color is more likely to have black (white) mantle edge pigmentation.
Although shell pigmentation had various color patterns, indicating polygenic nature of the trait (Evans et al., 2009), there are evidences that a few major genes are involved in the determination of shell pigmentation. Imai and Sakai (1961) reported that hybrid offspring from the crosses between light and dark strains had intermediate shell pigmentation. Among the 26 full-sib oyster families analyzed by Evans et al. (2009), the shell color had non-normal distributions in eight families and offspring segregation ratio of 3:1 for lighter and darker shell groups was observed in another two families. Hedgecock et al. (2006) reported that a single additively-inherited QTL could explain 32% of the phenotypic variation in total left-shell pigmentation in an experimental population derived from two partially inbred lines. Thus, QTL or other molecular studies are needed to characterize genetic architecture of the shell and mantle edge pigmentation in the Pacific oyster in Korea.
Variance component estimates showed that the estimate values of residual (environment), family (genetic) and phenotype were smaller in F2 than in F1 generation for both shell and mantle edge pigmentation (Table 3). This may partly be due to selection process, i.e. as selection for the color traits was implemented, the individuals within each color cross family would become more homogenous in the next generation, such that genetic variance would become smaller. However, the heritability estimates of mantle edge color decreased, while those of shell color increased as generation went on (Table 3). Further study with an increasing sample size is needed to obtain more reliable estimates of the variance components and thus heritability.
Our results indicate that some proportions of phenotypic variations for the shell and mantle edge colors were explained by genetic variations, enabling effective breeding implementation for the color traits. Because color patterns of aquatic species are often influenced by environmental factors, further studies are needed to investigate how environmental factors influence pattern distributions of the shell and mantle edge pigmentations, as well as to confirm the results of genetic characterization of the color traits in the Pacific oyster in this study.

ACKNOWLEDGMENTS

This work was supported by grants from the National Fisheries Research and Development Institute (NFRDI) in Korea. Jong-Joo Kim was financially supported by the 2013 Yeungnam University Research Grant.

Figure 1.
Distribution of F1 and F2 oysters for shell and mantle edge pigmentation.
ajas-26-12-1659-1f1.gif
Table 1.
Mean and standard deviation of shell and mantle edge pigmentation in F1 and F2 familiesa
No. Black family
White family
F1 F2 F1 F2
Shell color 1 4.69±0.56 5.00±0.00 1.69±1.26 0.22±0.42
2 3.75±0.80 5.00±0.00 1.00±0.49 0.44±0.50
3 3.97±0.84 - 2.18±1.13 1.00±0.00
4 - - - 1.02±0.14
Average 4.19±0.83 5.00±0.00 1.60±1.11 0.67±0.48
Mantle edge pigmentation 1 9.20±1.22 9.12±0.84 5.98±2.74 3.04±2.12
2 8.31±1.80 9.25±0.72 3.96±2.33 3.06±1.77
3 8.15±1.93 - 6.36±3.02 2.46±0.86
4 - - - 2.32±1.10
Average 8.60±1.70 9.20±0.77 5.40±2.88 2.72±1.57

a Numbers of individuals for each family were 45, 32, and 39 for black F1, 54, 51, and 44 for while F1, 34 and 51 for black F2, and 51, 50, 50, and 50 for while F2, respectively.

Table 2.
Analysis of variance testing for the effect of color and family within color on shell and mantle edge pigmentation in F1 and F2 generations of Pacific oysters
Source F1
F2
df MS F p df MS F p
Shell color
  Color 1 406.9 31.5 0.0049 1 1,088.7 103.4 0.0002
  Family (color) 4 52.9 16.2 <0.0001 4 6.2 79.0 <0.0001
  Error 259 210.8 - - 280 0.1 - -
Mantle edge pigmentation
  Color 1 626 13.4 0.0215 1 2,426.8 454.7 <0.0001
  Family (color) 4 47.8 9.0 <0.0001 4 5.7 3.1 0.0174
  Error 259 5.3 - - 280 1.9 - -
Table 3.
Estimation of variance components and narrow sense heritabilities (h2) for shell and mantle edge pigmentation in F1 and F2 generations of Pacific oysters
Source F1 F2
Shell colora
  σ2e 0.81 0.08
  σ2F 0.28 0.13
  σ2g 0.56 0.26
  σ2p 1.38 0.33
  h2 0.41 0.77
Mantle edge pigmentationa
  σ2e 5.29 1.86
  σ2F 0.97 0.08
  σ2g 1.94 0.16
  σ2p 7.23 2.02
  h2 0.27 0.08

a σ2e and σ2F are estimates of variances due to error and families, respectively. σ2g and σ2p are genetic (2*σ2F) and phenotypic variances, respectively.

REFERENCES

Alfnes F, Guttormsen AG, Steine G, Kolstad K. 2006. Consumers’ willingness to pay for the colors of salmon: a choice experiment with real economic incentives. Am J Agri Econ 88:1050–1061.
crossref
Allen SK. 1998. Commercial applications of bivalve genetics: not a solo effort. World Aquaculture 29:38–43.

Brake J, Evans F, Langdon C. 2004. Evidence for genetic control of pigmentation of shell and mantle edge in selected families of Pacific oysters, Crassostrea gigas. Aquaculture 229:89–98.
crossref
Clydesdale FM. 1993. Color as a factor in food choice. Crit Rev Food Sci Nutr 33:83–101.
crossref pmid
Evans S, Camara MD, Langdon CJ. 2009. Heritability of shell pigmentation in the Pacific oyster, Crassostrea gigas. Aquaculcure 286:211–216.
crossref
Gjerde B, Gjedrem T. 1984. Estimates of phenotypic and genetic parameters for carcass traits in Atlantic salmon and rainbow trout. Aquaculture 36:97–110.
crossref
Gjerde B, Schaeffer LR. 1989. Body traits in rainbow trout: II. Estimates of heritabilities and of phenotypic and genetic correlations. Aquaculture 80:25–44.
crossref
Gomelsky B. 2011. Fish genetics: theory and practice. VDM Verlag Dr. Mueller; Saarbrücken, Germany: p. 200

Gomelsky B, Cherfas NB, Ben-Dom N, Hulata G. 1996. Color inheritance in ornamental (koi) carp (Cypprinus carpio L.) inferred from color variability in normal and gynogentic progenies. Isr J Aquac-Bamidgeh 48:219–230.

Guo X, Allen SK. 1994. Viable tetraploids in the Pacific oyster (Crassostrea gigas Thunberg) produced by inhibiting polar body I in eggs from triploids. Mol Mar Biol Biotechnol 3:42–50.

Haskin HH, Ford SE. 1979. Development of resistance to Minchinia nelsoni (MSX) mortality in laboratory-reared and native oyster stocks in Delaware Bay. Marine Fisheries Review 41:54–63.

Hedgecock D, Grupe P. 2006. Mapping genes affecting shell color and shape in the Pacific oyster, Crassostrea gigas. J Shellfish Res 25:738

Imai T, Sakaki S. 1961. Study of breeding of Japanese oyster, Crassostrea gigas. Tohoku J Agric Res 12:125–171.

Lutz GC. 2001. Practical genetics for aquaculture. Fishing News Books; Oxford, UK: p. 235

MIFAFF. 2012. Ministry for Food, Agriculture, Forestry and Fisheries of Korea. Fisheries information service, Annual Statistics of Fisheries Production. (http://www.fips.go.kr) Accessed January 8, 2013.

Naciri-Graven Y, Martin AG, Baud JP, Renault T, Gerard A. 1998. Selecting the flat oyster Ostrea edulis (L.) for survival when infected with the parasite Bonamia ostreae. J Exp Mar Biol Ecol 224:91–107.
crossref
Nell JA. 2001. The history of oyster farming in Australia. Mar Fish Rev 63:14–25.

Nell JA, Perkins B. 2006. Evaluation of the progeny of third-generation Sydneyrock oyster Saccostrea glomerata (Gould, 1850) breeding lines for resistance to QX disease Marteilia sydneyi and winter mortality Bonamia roughleyi. Aquac Res 37:693–700.
crossref
Steine G, Alfnes F, Rørå MB. 2005. The effect of color on consumer WTP for farmed salmon. Mar Resour Econ 20:211–219.
crossref
Thorgaard GH, Spurell P, Wheeler PA. 1995. Incidence of albinos as a monitor for induced triploidy in rainbow trout. Aquaculture 137:121–130.
crossref
Ward RD, Englisj LJ, McGoldrick DJ, Maguire GB, Nell JA, Thompson PA. 2000. Genetic improvement of the Pacific oyster Crassostrea gigas (Thunberg) in Australia. Aquac Res 31:35–44.
crossref
Withler RE, Beacham TD. 1994. Genetic variation in body weight and flesh colour of the coho salmon (Oncorhynchus kisutch) in British Columbia. Aquaculture 119:135–148.
crossref


Editorial Office
Asian-Australasian Association of Animal Production Societies(AAAP)
Room 708 Sammo Sporex, 23, Sillim-ro 59-gil, Gwanak-gu, Seoul 08776, Korea   
TEL : +82-2-888-6558    FAX : +82-2-888-6559   
E-mail : editor@animbiosci.org               

Copyright © 2024 by Asian-Australasian Association of Animal Production Societies.

Developed in M2PI

Close layer
prev next