Analysis of Gene Expression Responses to a Salmonella Infection in Rugao Chicken Intestine Using GeneChips
Article information
Abstract
Poultry products are an important source of Salmonella enterica. An effective way to reduce food poisoning due to Salmonella would be to breed chickens more resistant to infection. Unfortunately host responses to Salmonella are complex with many factors involved. To learn more about responses to Salmonella in young chickens of 2 wk old, a cDNA Microarray containing 13,319 probes was performed to compare gene expression profiles between two chicken groups under control and Salmonella infected conditions. Newly hatched chickens were orally infected with S. enterica serovar Enteritidis. Since the intestine is one of the important barriers the bacteria encounter after oral inoculation, intestine gene expression was investigated at 2 wk old. There were 588 differentially expressed genes detected, of which 276 were known genes, and of the total number 266 were up-regulated and 322 were down-regulated. Differences in gene expression between the two chicken groups were found in control as well as Salmonella infected conditions indicating a difference in the intestine development between the two chicken groups which might be linked to the difference in Salmonella susceptibility. The differential expressions of 4 genes were confirmed by quantitative real-time PCR and the results indicated that the expression changes of these genes were generally consistent with the results of GeneChips. The findings in this study have lead to the identification of novel genes and possible cellular pathways, which are host dependent.
INTRODUCTION
The chicken is an important model organism that bridges the evolutionary gap between mammals and other vertebrates (Hillier et al., 2004). Research on chickens (Gallus gallus) has had a significant impact on fundamental biology. The domestic chicken also provides a major protein source from meat and eggs for most human populations throughout the world. Its economic importance has made it the focus of numerous research projects, including a recent effort to sequence the entire chicken genome (Wicker et al., 2005). Chicken should be used to study Salmonella susceptibility, because in addition to its impact on human health, salmonellosis in young chickens results in economic losses for the poultry industry, amounting to approximately US$64 million to US$114 million annually in the United States (Bryan and Doyle, 1995).
Salmonella enterica is one of the most common causes of food poisoning in humans, mostly caused by poultry products infected by S. enterica serovars Typhimurium or Enteritidis (Rabsch et al., 2001). Following oral ingestion, Salmonella colonize the intestines and invade the intestinal mucosa. In addition to the enteric disease, humans Salmonella serovars Typhimurium and Enteritidis are also capable of causing severe systemic disease in newly hatched chicks and in birds under extreme stress conditions. The infection seldom causes mortality in birds more than 1 month old (Suzuki, 1994). In young chickens infection with Salmonella leads to diarrhea and intestinal lesions and to an influx of heterophils into the gut accompanied by inflammation and damage to villi (Barrow et al., 1987).
In contrast to other species, no genome-wide expression profiles in the chicken in response to Salmonella have been measured. Therefore several processes in the chicken host in response to Salmonella may be unidentified. Furthermore validations of the invitro gene expression observations by in vivo data are scarce. In addition it is not known why some chicken lines are more susceptible to Salmonella infections than others (Barrow et al., 1987; Guillot et al., 1995).
Host gene expression responses to a Salmonella infection have widely been studied. One of the methods to investigate gene expression responses is the use of GeneChips that allow the analysis of the expression of a large number of genes in a single experiment. Indeed, GeneChips have been used to study gene expression responses to Salmonella (Rosenberger et al., 2001). With this approach it was found that in human epithelial cells cultures Salmonella typhimurium induce a classical proinflammatory gene expression pathway with up regulation of several cytokines, kinases and transcription factors (Eckmann et al., 2000; Zeng et al., 2003).
Resistance to systemic salmonellosis in the chicken is a polygenic phenomenon as demonstrated in a number of studies (Lamont, 1998; Kramer et al., 2003a; Malek and Lamont, 2003; Malek et al., 2004; Swaggerty et al., 2004). Studies in chickens have also revealed considerable differences between lines in levels of colonization of Salmonella of the gastro-muscle tract and responses to vaccination (Lamont et al., 2002; Liu et al., 2003). Susceptibility to Salmonella caecal carrier state was investigated in chickens 1 to 6 wk of age. A down-regulation of IFN-g was found in the caecal tonsils of susceptible chickens compared to the resistant animals (Sadeyen et al., 2004). So far, only candidate genes have been investigated for their possible role in the chicken response to a Salmonella infection, but a whole genome approach might give more insight into the genetic aspects of the host response. Gene expression array technology is a powerful tool that has already been used to expand the understanding of host–pathogen interactions. A number of reports have been published about host transcriptional responses to bacterial infection using gene arrays (Rosenberger et al., 2001). However, the effect of Salmonella on host gene expression using GeneChips is so far not studied in chickens. In this study, the response on a Salmonella infection in relation to the genetic background of the host is studied.
In the present study, we describe the gene expression response in the intestine of young chickens after a Salmonella infection. The gene expression differences found with the GeneChips were confirmed using quantitative reverse transcription RT-PCR. Two different chicken groups were also used and the results were compared with each other to determine the role of the genetic background in the host response.
MATERIALS AND METHODS
Chips
Every chip purchased from America Agilent Company had 43,604 points in which every 3 points represent 3 repeats of one gene. Negative controls and housekeeping genes were removed, it had 13,319 probe sequences of chicken.
Experimental animals
The following study was approved by the Institute of poultry, China Academy of Agricultural Sciences in accordance with the Dutch regulations on animal experimentation, eight full sib family of Rugao chickens (China native breeds, Jiangsu province) were used in the present study. The chickens were free of Salmonella by detecting faecal samples. Four were for group A, whereas the other four were for Group B.
Experimental infection
Eight 14-d old chickens of each group (A and B) were randomly divided into 2 groups. The birds were determined to be free of Salmonella when hatching. Of the chicken, four chickens of 14-day old were orally inoculated with 0.2 ml of a bacterial suspension containing 105 CFU S. serovar Enteritidis phage type 4 (nalidixic acid resistant). Four chickens of the control group were inoculated with 0.2 ml saline. The four chickens of each group were sacrificed 24 h post infection. For detection of S. serovar Enteritidis a cloacal swab was taken and after overnight enrichment it was spread on brilliant green agar+100 ppm nalidixic acid for Salmonella determination (37°C, 18–24 h). Pieces of the jejunum were snap frozen in liquid nitrogen and stored at −70°C.
RNA isolation and total RNA purification
Pieces of the jejunum were crushed under liquid nitrogen, 50 to 100 mg tissues of the different chicks were used to isolate total RNA using TRIzol reagent (Agilent), according to instructions of the manufacturer with an additional step. The homogenized tissue samples were resuspended in 1 ml of TRIzol Reagent using a syringe and 21 gauge needle and passing the lysate through 10 times. After homogenisation, insoluble material was removed from the homogenate by centrifugation at 12,000×g for 10 min at 4°C. Total RNA of intestine was isolated by Ribonucleic Acid Analysis, 2100 (Agilent) and was then purified by QIAGEN RNeasy Kit, according to the introductions of Qiagen.
Preparation of DNA probe and fluorescein mark
cRNA samples were purified and marked with kit constructed by QIAGEN, which were synthesized from mRNA by two reverse transcriptions. The concentration and the purity of each sample was analyzed at OD260 nm and OD280 nm with ultraviolet spectrophotometer by Cy3-marker, the content of cRNA was adjusted, the molecular concentration of fluorescence was analyzed, the content of Cy3 at 552 nm was tested and the incorporation efficiency was calculated.
cRNA fragmentation and GeneChip hybridization
The mixed fragmentation liquor was prepared with Cy3 cRNA 875 ng, 10 X Blocking Agilent 11 μl, 25 X Fragmentation Buffer 2.2 μl Nuclease-free water X μl, then incubated in 60°C water for fragmentation for 30 min, 55 μl 2X GEx Hybridization Buffer was added and 100 μl of which was taken on the chip and then they were rollingly hybridizated at 65°C, at 10 rpm, for 17 h.
Washing, scanning, GeneChip data normalization and analysis
The chip was dislodged into lotion 1 for washing for 1 min, and then put into lotion 2 for washing for 1 min (37°C). Then the chip was scanned in an Agilent scanner with a resolution of 5 μm, and the scanner automatically scanned the chip to 100% and 10% PMT for each, respectively.
The 8 GeneChips, four sets from each group were scanned and data was quantified using the Agilent scanner and Genespring software. Spot intensities were calculated, using the median value of all spots for further analysis. Poor-quality spots (flag = 0) were filtered from the raw data of each array before analysis, followed by background subtraction of median intensity signals (F532 median-B532 median) and then rescaled by global normalization (Quantile) and different functional classifications were divided by Gene Ontology (GO). Net intensities less than 500 from the normalized data were removed and the remaining signals are transformed logarithmically. Statistically significant differential gene expression was characterized from four sets of GeneChip data derived from each group, using the unpaired t-test. Because the ratio on the array is expressed in a log2 scale, a ratio of >2.00 or <0.50 corresponds to a more than twofold up- or down-regulation respectively. To compare with the quantitative PCR, the log2 ratios were transformed to normal ratios. In order to select significant gene expression changes, genes showing statistically different (p<0.01) expression levels, representing two-fold or greater were selected and processed for further analysis by quantitative RT-PCR to validate the result.
Quantitative real-time RT-PCR
Oligonucleotide primers were designed to amplify a fragment containing sequences from two adjacent exons in order to avoid contamination with genomic DNA. Glyceraldehyde-3-phosphate dehydrogenase (GAPDH) was considered to be a stably expressed housekeeping gene and was used as an internal reference gene. The primer pairs were used to analyze gene expression and the size of product are shown in Table 1.

Primer pairs used to analyze gene expression by quantitative RT-PCR, and size of product
Four genes were selected from all differently expressed genes for further investigation of their expression. Real-time quantitative RT-PCR was used to evaluate these. The reaction was performed in a volume of 20 μl and carried out in an ABI Prism 7500 Sequence Detection System (Applied Biosystems, Foster City, CA, USA) (Applied Biosystems) programmed to conduct one cycle at 95°C for 30 s, 40 cycles at 95°C for 15 s and 60°C for 34 s. The dissociation curves were analyzed for each PCR reaction to detect and eliminate possible primer-dimer artifacts. Results (fold changes) were expressed as 2−ΔΔCt with ΔΔCt = (Ctij-CtGAPDHj)-(Cti1-CtGAPDH1), where Ctij and CtGAPDHj are the Ct for gene i and for GAPDH in a sample (named j), and Cti1 and CtGAPDH1 are the Ct in sample 1, expressed as the standard (Bourneuf, 2006).
RESULTS AND ANALYSIS
Clinical symptoms of the Salmonella infection
After 24 h oral inoculation the chicks were sacrificed. The cloacal swabs of the control animals were free of Salmonella, while the cloacal swabs of all Salmonella inoculated chicks were positive. Furthermore, the Salmonella infected birds from both groups already showed signs of systemic disease as Salmonella were detectable in the intestine.
Microarray data analysis
Differential expression genes of intestine to a Salmonella infection and GO analysis
There were 588 differentially expressed genes detected, of which 276 were known genes, and of the total number 266 were up-regulated and 322 were down-regulated. Different functional classifications were divided by Gene Ontology (GO) into thoses which were involved in immune system process, transporter activity, metabolic process, cellular process, in response to the Salmonella infection in the intestine as biological regulation and growth. In the part of up and different stages of immune responses in both chicken down regulated genes differentially expressed, TLR5, groups, while CCL1, IL8, CD79B and CCL5 were THBS1, KIT, and FGF10 were identified to be up-regulated identified to be down-regulated, and are shown in Table 2 and 3. Meanwhile, some genes among all these differentially expressed genes that had no annotation in GenBank were screened out and were presumed to be unknown new genes (Tables 2 and 3), in which there were 24 genes that were associated with immune system process, 201 with metabolic process and 300 with cellular process and so on. The distributions of related differentially expressed genes about the immune system process are shown in Figure 1.

Part of up-regulated genes differentially expressed (p<0.01) between group A and B

Part of down-regulated genes differentially expressed (p<0.01) between group A and B
Pie chart of differential genes in immune system process.
Cluster dendrogram of differential expressed genes
The results of the samples and related differentially expressed genes in this study were respectively classified and clustered by Heatmap function of SAS system are shown in Figure 2, in which the abscissa is a sample cluster, namely, 2 experimental groups with 4 in each, whereas the vertical axis is differentially expressed gene clusters. The 588 differentially expressed genes were divided into two major categories, which are shown in Figure 2a, the right side of which is the corresponding probe numbers of differentially expressed genes, and different colors represented the expression strength of the genes in tissues. The color bar is shown in Figure 2b, the concrete expression of a gene in different samples could be seen by using TreeView software, and the gene expression could also be analyzed according to the classification of samples. For example, the differentially expressed gene that corresponded to the probe No. A_87_P018174 was toll-like receptor 5 (TLR5), the expression of which in group A was lower than that in group B from the Figure.
a: Differentially expressed genes cluster dendrogram of group A and B. b: Colorbar scale.
Quantitative RT-PCR analysis of differentially expressed genes
We used quantitative RT-PCR to confirm the differentially expressed genes detected by our microarrays in chicken tissue (n = 4 chickens). We performed quantitative real-time PCR for:
Thrombospondin-1 Fragment (THBS1), Gallus gallus v-kit Hardy-Zuckerman 4 feline sarcoma viral oncogene homolog (KIT), Gallus gallus fibroblast growth factor 10 (FGF10) and Gallus gallus chemokine (C-C motif) ligand 1 (CCL1). All the real-time RT-PCR fold differences were in complete correspondence with the microarray data. This positive correlation suggests that our microarray data is an accurate reflection of levels of gene expression present in the intestine tissue taken from the two chicken groups (Table 4).
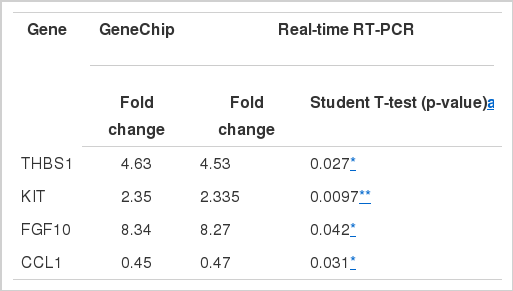
Comparison of GeneChip and real-time RT-PCR analyses
DISCUSSION
So far few articles are published studying gene expression profiles in the chicken and each study used a different array platform. This makes it difficult to interpret and compare results from different experiments. Recently the first draft genome sequence of the red jungle fowl, G. gallus has become available (International Chicken Genome Sequencing Consortium, 2004).
The intestine is a complex system to study in vivo due to the different cell types and multiple functions. To highlight the responses after a Salmonella infection in cellular context the gene expression in the whole intestine of 14-d old chickens was investigated with GeneChips as is reviewed (Amundson et al., 2001). This array contains a comprehensive coverage of 13,319 probes used to construct gene expression profiles in order to screen differentially expressed genes of intestine tissues to a Salmonella infection in Rugao chicken. The advantage of investigating the gene response in vivo above in vitro infection in cell lines is that the cellular context is retained. This context is important to identify complex cellular regulation. As expected, genes that were identified to be up-regulated in response to the Salmonella infection in the intestine were involved in different stages of the immune responses in both chicken groups, such as TLR5, THBS1, KIT, and FGF10. Toll-like receptor 5 (TLR5) senses flagellin of several bacterial species and activates the innate immune system. The avian TLR repertoire exhibits considerable functional diversity compared to mammalian TLRs and evidence of a functional TLR5 in the avian species is lacking. Keestra et al. (2008) found that chicken TLR5 activation by flagellin of S. enterica serovar Typhimurium revealed that chTLR5 consistently yielded stronger responses than human but not mouse TLR5. This species-specific reactivity was not observed with flagellin of serovar Enteritidis. These results show that chickens express a functional TLR5 albeit with different flagellin sensing qualities compared to human TLR5. Tucker et al. (1997) found that TSP-1 is expressed in the spinal cord floor plate, in mesenchyme surrounding the developing paramesonephric duct, at the tips of growing lung bronchioles, in lens and in corneal endothelium. These observations indicate that there is little overlap in the expression patterns of TSP-1 and that it is expressed consecutively during the development of cartilage and neurons. The pattern of TSP-1 expression in vascular tissues and in the floor plate is consistent with possible roles for this glycoprotein in regulating angiogenesis and establishing morphogenetic gradients. Chicken Kit was isolated from a chicken brain cDNA library. The deduced amino acid (aa) sequence of chicken Kit shows 63% identity to mouse Kit, and suggests that chicken Kit shares common structural and functional features with mouse Kit. RNA blot analysis indicated that the expression pattern of the chicken c-kit transcript in chicken organs was similar to that of mouse c-kit in mice, suggesting that chicken Kit has biological roles analogous to those of mouse Kit (Sasaki et al., 1997). In a previous study of Shin et al. (2006), they showed that FGF10 was an early mesenchymal signal that was critically associated with the developmental processes in the proventricular epithelium. Furthermore, virus-mediated Fgf10 over expression results in a hypermorphic epithelial structure and an increase in epithelial cell number. In fibroblasts, wild-type v-Rel induced expression of mip-1beta and nfkb1, while non transforming mutants of v-Rel failed to do so, suggesting a role for these two genes in v-Rel mediated transformation. Finally, these genes are expressed at high levels in cells over expressing wild-type and truncated forms of c-Rel, implying that v-Rel transforms, in part, by induction of c-Rel target genes (Petrenko et al., 1997). Excluding the genes involved in the immune system process, using microarray hybridization methods we alsoisolated a number of other differentially expressed genes. Most of the other genes we identified were related to transporter activity, metabolic process, cellular process, biological regulation and growth (Tables 2 and 3), as defined by the Gene Ontology (Al-Shahrour et al., 2004).
The 588 genes screened by the Agilent microarray were divided into different categories according to their functions, for example, 24 genes associated with immune system process, 201 with metabolic process and 300 with cellular process. Information could be subtle as to the function of each gene and its participation in the relevant biological path. However, GO functional classification reduced the tedious validation of gene function by biological methods and could divide known genes into different functional classifications. GO could also speculate that the ‘unknown’ genes, some of which sequences had no annotation in GeneBank, may be involved in the same biological process, thus new genes can be discovered, but biological methods will be required to verify them. The expression of different samples of a particular gene and the classification of samples according to gene expression could be studied in Heatmap cluster diagram by the use of Java TreeView software, for example, toll-like receptor 5 (TLR5), the expression of which in group A was lower than that in group B as shown in Figure 2. This suggested that the TLR5 gene in the immune system process showed an ascent trend, indicating that the immune response activity was relatively strengthening in Rugao chicken intestine to a Salmonella infection over time. However, the biological process of which needs to be further validated by biological methods. Four differentially expressed genes were selected from our microarray data and analyzed using quantitative RT-PCR to confirm that they were also expressed at different levels in intestine tissue. All the real-time RT-PCR fold differences were in complete correspondence with the microarray data. This positive correlation suggests that our microarray data is an accurate reflection of levels of gene expression present in the intestine tissue taken from the two chicken groups. Further, the high correlation coefficients we achieved between our microarray replicates suggest that the method we used to construct our arrays and carry out microarray hybridization is reliable and highly reproducible.
ACKNOWLEDGEMENTS
This study was supported by National Natural Science Foundation (30972088, 31172199) and Jiangsu Science and Technology Program Support (BE2008359).