Body Weight Changes of Laboratory Animals during Transportation
Article information
Abstract
The majority of laboratory animals were transported from commercial breeders to a research facility by ground transportation. During the transportation, many biological functions and systems can be affected by stress. In this experiment, the change of body weight during the transportation was measured and the recovery periods from the transportation stress established based on the body weight changes. Total 676 laboratory animals which were aged between 3 to 9 wk old were studied. The transportation time taken from container packing to unpacking the container was approximately 24 h. The temperature of animal container was constantly maintained by air-conditioning and heating equipment. Rats were found to be more sensitive than mice. The body weight of rats was significantly decreased 3.71% (p<0.05) compared to the body weight of mice which decreased 0.9% There was no significant difference between the strains in the same species. When the changes of body weights were compared between delivery days, C57BL/6 mice showed the most variable changes compared to other species and strains. Consequently, C57BL/6 was more sensitive to stress than the other strains and the transportation process needs to be standardized to reduce between day variability. To establish the recovery periods from transportation stress, the body weight changes were measured during the acclimation period. Although the body weight of animals decreased during transportation, animals recovered their weight loss after the next day.
INTRODUCTION
The majority of laboratory animals are transported from commercial breeders to a research facility. During the transportation period, animals experience a sudden and large stress situation, although animals are generally supplied by shipped in environmentally controlled ground vehicles (NRC, 2006).
The physiological and behavioral response to stress affects a number of biological functions and systems. If stress is extreme or prolonged, substantial effort is required to regain a state of equilibrium and the animal may suffer as a result (Reilly, 1998). This effort can be compounded by the effects of fear, nausea, hunger, thirst or pain, depending on the species and circumstances under which they are transported. Stress during a journey may also increase the risk of disease for transported animals, yet the potential to monitor animal wellbeing, and to act if it is compromised, is often significantly curtailed during transport (Swallow et al., 2005).
A number of parameters have been used to evaluate stress in animals, such as levels of circulating cortisol, corticosterone and glucose, adrenal gland mass, behavior, food and water consumption and weight loss. These measures are generally used in conjunction with one another to provide a basis for assessing stress (Moberg et al., 2000). The length of the adaptation period is probably related to the severity and duration of the stress experience and the parameters chosen. Many studies have found that transport causes significant changes in the parameters used to assess stress and that varying periods of time are required for values to return to baseline levels. Acute stress from successful transportation is not likely to affect the long-term health of an animal adversely. Studies with rabbits, rats and mice have indicated that alterations in weight gain, hematological parameters, blood corticosterone concentrations and behavioral changes occur after transportation. It has been suggested that normalization of most physiological changes (including corticosterone and body weight) occurs in 2 to 4 d (van Ruiven et al., 1996). Studies in rats and rabbits have recommended adaptation periods of 3 d and 48 h, respectively, yet periods of 3 to 5 d have been recommended for rats used in toxicology testing (Swallow, 2005).
Unfortunately, there was a little information regarding weight loss due to transportation of laboratory animals between commercial breeder and research institutions. The purpose of this study is to measure the body weight changes during the transportation period in an animal transportation system. Furthermore, to determine the recovery periods of laboratory animals from the transportation stress based on the body weight changes.
MATERIALS AND METHODS
Animals
Specific pathogen free (SPF) ICR (CD-1) mice, C57BL/6N mice, CD (SD) rats, Wistar rats were purchased from ORIENT BIO Inc. (Korea).
During transportation, the animals were held in a filtered container (55.5 cm×35.5 cm×15 cm, Width×Length ×Height). Animals were provided with adequate bedding and fed on pelleted, dry diets with agar as the water source. Only temperature was controlled during the transportation period.
During the acclimation, the animals were housed in polycarbonate cages (size 42.5 cm×28.5 cm×11.0 cm for rats, 27.5 cm×23.0 cm×11.0 cm for mice, Width×Length× Height) with a water bottle. The polycarbonate cages were kept in an animal room with controlled temperature (22± 3°C) and humidity (50±20%), and a 12-h light/dark cycle. The animals were fed rodent chow 5L70 (Labdiet, USA) and filtered tap water ad libitum.
Delivery truck temperature
The temperature of truck container was automatically controlled between 15 to 18°C. However, the inside temperature of the animal container was usually higher (3–4 °C) than the truck container. The temperature record during the transportation was transmitted to the truck driver. During the 2 months of the study the temperature record was analyzed for a total 8 deliveries. The ambient temperature on the same date at Daejeon was surveyed by the publication of the meteorological administration.
Body weight measurement
Animals were ordered based on their age and body weights and were selected for shipment on this basis by the supplier. The body weights were measured during the animal selection for packing by the breeder. Thereafter animals were packed in the transportation container and delivered on the next day by truck. The conditions of the transport container were checked and the temperature record of truck container checked when the animals were delivered. When the container was opened the status of animal health checked and the body weights of animals were measured.
Statistical analysis
All values are expressed as means±SD. Two-group comparisons used Student’s t-test. Body weight differences were analyzed using one-way ANOVA followed by Tukey’s multiple-range comparison test (Version 5.0, GraphPad Prism for Windows).
RESULTS
Delivery temperature
The delivery truck had an air-conditioner that was set at around 15 to 18°C. Because the inside temperature of animal container was 3 to 4°C higher than the truck container the temperature of the animal container ranged between 18 to 22°C. The average temperature of delivery truck container was 16.7±1.1°C (n = 8), while the local temperature was between −0.6°C to 13.9°C. The temperature of the truck container was maintained continuously regardless of outside temperature.
Comparison of body weight by species and strain
Total 676 animals were used: ICR (CD-1) 321 mice, C57BL/6 92 mice, CD (SD) 210 rats, and Wistar 53 rats. The changes of body weights before and after transportation are summarized in Table 1 and Table 2.
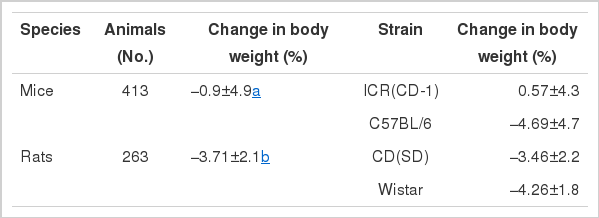
Body weight changes of animals during transportation

Body weight difference before and after transportation of mice and rats
The body weight of rats was significantly (p<0.05) decreased compared with that of mice during transportation. There was no significant difference between strains in the same species.
Out of a total of 413 mice ordered, 1 animal out of 413 mice (0.24%) was over weight compared to the ordered range, but when we received the mice after approximately 24 h from animal selection and packing, 46 out of 413 mice (11.1%) were out of the ordered range. A total of 23 animals (5.6%) were over weight and 23 (5.6%) animals were under weight from the ordered range. The results are summarized in Table 2. Out of a total of 263 rats ordered, one rat (0.4%) was over weight before transport and 12 rats (4.6%) were out of range after transport. Among the 12 animals, three rats (1.1%) were over weight and nine rats (3.4%) were under weight. The results are summarized in Table 2.
The influence of delivery days on body weight
The influence of the inter-days effects on the body weights were summarized in Table 3. The inbred mice, C57BL/6, showed significant changes of body weight by inter-days. The other groups did not show a significant difference.

The influence of different delivery days on body weight changes in mice and rats
Recovery period of body weight
In order to check for recovery time of body weight within species from the transportation stress, body weight of mice and rats was newly measured by the same age, the body weight changes are summarized in Figure 1. Body weight of mice and rats either decreased or stayed the same on the transportation day, but the body weight recovered during the next day. Three days after transportation, the animals could be considered recovered.
Comparison of body weight change between rats and mice strains.
DISCUSSION
Regulations and Guidelines for the Transportation of Research Animals are published: the AATA Manual for the Transportation of Live Animals (AATA, 2000), the IATA Live Animals Regulations (IATA, 2005), and a Report of the Transport Working Group Established by the Laboratory Animal Science Association (Swallow et al., 2005). With regard to the transportation of animals, the act contains standards for consignment (delivery of animals to an entity for transport), primary transportation enclosure, primary conveyance, food and watering requirements during transportation, terminal facilities, care in transit, and handling. These standards helped achieve an animal’s well-being and safe arrival in good health, with minimal distress.
However, it is clear that transport is still a significant stressor that may have an impact on both animal welfare and on the scientific validity of any future studies involving the animals or their offspring (Claassen, 1994; Reilly, 1998). Laboratory animals generally experience numerous unfamiliar environmental and psychological influences such as noises, temperatures, handling, shaking and smells during the process of transportation (Shim et al., 2009). Many studies have found that transport causes significant changes in the parameters used to assess stress and that varying periods of time are required for values to return to baseline levels. For example, laboratory mice lost 5% of their initial weight under the best conditions and genotype was not important in controlling initial weight and activity level (Wallace, 1976). These experiments found that body weight of rats and mice was decreased by 3.7% and 0.9%, respectively indicating that rats were more sensitive than mice. An inbred line was more sensitive than an outbreed line, C57BL/6 mice lost 4.69% of their body weight and ICR (CD-1) mice gained 0.5% of their body weight. These results indicated that outbred mice may be less sensitive than inbred mice and stress is an individually sensitive and variable factor that appears to be body weight or age dependent. ICR mice at 15 to 20 g range of body weight showed a slight increase pattern, however, these results were not significant. Also, there was no statistical significance between outbred strains. In rats, body weight of CD (SD) and Wistar rats decreased by 3.46% and 4.26%, respectively. Again this indicates that rats are more sensitive than ICR mice to stress-related situations.
In this experiment, there were some variations that depended on delivery days with the body weight changes of C57BL/6 mice showing significant changes depending on delivery days. It is believed that a standardization of transportation process is needed to minimize body weight changes during transportation. Newly arrived animals require a period of acclimation. Acclimation period was regarded as a stabilization period which permits physiological and behavioral adaptation to the new environment before animal use. As described in the literature, plasma corticosterone levels increased immediately after movement and returned to baseline within 24 h. and many investigators allow 2 or 3 d to a week or more for animals to recover after transportation and to acclimatize to their new environment. To confirm to optimize acclimation period, the body weights of recovery period were measured. Although the body weight of mice and rats decreased during transportation, it recovered on the next day. Based on the results, 3 d are enough time for recovery of body weights and for the acclimatization period of rodents in an animal house environment. There appeared to be no problems using rodents in experiments from the fourth day after transportation.