Influence of Rain Tree Pod Meal Supplementation on Rice Straw Based Diets Using In vitro Gas Fermentation Technique
Article information
Abstract
The objective of this study was to determine the roughage to concentrate (R:C) ratio with rain tree pod meal (RPM) supplementation on in vitro fermentation using gas production technique. The experiment design was a 6×4 factorial arrangement in a CRD. Factor A was 6 levels of R:C ratio (100:0, 80:20, 60:40, 40:60, 20:80 and 0:100) and factor B was 4 levels of RPM (0, 4, 8 and 12 mg). It was found that gas kinetic, extent rate (c) was linearly increased (p<0.01) with an increasing level of concentrate while cumulative gas production (96 h) was higher in R:C of 40:60. In addition, interaction of R:C ratio and RPM level affected NH3-N and IVDMD and were highest in R:C of 0:100 with 0, 4 mg of RPM and 40:60 with 8 mg of RPM, respectively. Moreover, interaction of R:C ratio and RPM level significantly increased total volatile fatty acids and propionate concentration whereas lower acetate, acetate to propionate ratios and CH4 production in R:C of 20:80 with 8 mg of RPM. Moreover, the two factors, R:C ratio and RPM level influenced the protozoal population and the percentage of methanogens in the total bacteria population. In addition, the use of real-time PCR found that a high level of concentrate in the diet remarkably decreased three cellulolytic bacteria numbers (F. succinogenes, R. flavefaciens and R. albus). Based on this study, it is suggested that the ratio of R:C at 40:60 and RPM level at 12 mg could improve ruminal fluid fermentation in terms of reducing fermentation losses, thus improving VFA profiles and ruminal ecology.
INTRODUCTION
In the process of ruminal fermentation, 2–12% of ingested gross energy is converted to methane, which not only lowers the efficiency of feedstuff utilization, but also contributes to global warming (Johnson and Johnson, 1995). Methane from livestock accounted for 38% of the green house gases emitted (McGinn et al., 2004). Therefore, inhibition of methane production from livestock can improve feed efficiency and potentially have long-term environmental benefits. Dietary manipulation can help suppress methane emission from ruminants by inhibiting rumen microbes involved in methane formation, or by diverting hydrogen away from methane production during ruminal fermentation (McGinn et al., 2004). The type of feeds offered to the ruminant can have a major effect on ruminal methane production. Methane production decreased when the proportion of dietary concentrate increased (Yan et al., 2000). The roughage to concentrate (R:C) ratio has an impact on the rumen fermentation and hence the acetate: propionate ratio. An increased proportion of concentrate diet changes ruminal volatile fatty acid (VFAs) concentrations in such a way that less acetate and more propionate (Walichnowski and Lawrence, 1982) is produced. However, increased levels of concentrates may result in health problems e.g. acidosis and high cost of production.
Several secondary compounds contained in plants can be used for rumen manipulation and be a cost-effective way to improve the performance of ruminants. Effects of some medicinal plants, plant extracts or essential oils on ruminal fermentation have already been reported (Evans and Martin, 2000). Tropical foliages or legumes normally contain high or medium contents of secondary compounds. Among these compounds are the saponins and tannins, which have been shown to exert a specific effect against rumen protozoal (Wang et al., 2000; Animut et al., 2008) and reduced ruminal methane production (Grainger et al., 2009). Protozoa contributes hydrogen for the reduction of CO2 to CH4 by the methanogens. Methane production is higher when protozoa are present than when they are absent or present in low in numbers (Jouany and Lassalas, 1997). There are many reports indicating the inhibitory effect of tannins on rumen protozoa. For instance, Hess et al. (2006) reported that supplementation with a tannin-rich legume with 25 g tannins/kg dietary dry matter (DM) could decrease methane emission by 13% without affecting energy retention. Chanthakhoun et al. (2011) found that Phaseolus calcaratus hay, 2.8% of condensed tannins (CT), reduced methane gas production in swamp buffalo. However, the mechanisms of inhibition of rumen protozoa have not been known (Patra and Saxena, 2011). However, higher levels (5–9%) tannins may reduce plant cell wall digestibility by binding bacterial enzymes and/or forming indigestible complexes with cell wall carbohydrates (Barry, 1983; Reed et al., 1990).
Rain tree (Samanea saman) is local tree legume grown in tropical and sub-tropical area. Pods are black-brown, filled with a sticky, sweet, brownish pulp and falls during the dry season. It is edible and nutritious for livestock and make an excellent feed supplement (George and Craig, 2006). Rain tree pod contains 18.1% of crude protein (CP), 4.0% of CT, 18.2% of total sugar and 8.4% of sucrose which gives them a potential to use in rumen manipulation aimed at improving the performance of ruminants. (George and Craig, 2006). Therefore, the objective of this study was to determine roughage to concentrate (R:C) ratio with rain tree pod meal (RPM) supplementation on improving ruminal fermentation in dairy steer rumen fluid using an in vitro gas production technique.
MATERIALS AND METHODS
Diets and experimental design
Twenty-four total mixed diets were formulated according to a 6×4 factorial arrangement in a completely randomized design (CRD). The diets were 6 levels of R:C ratio (100:0, 80:20, 60:40, 40:60, 20:80 and 0:100) with 4 levels of rain tree pod meal (RPM) (0, 4, 8 and 12 mg). Concentrates were formulated to contain cassava chip, rice bran and molasses as an energy source while, coconut meal, palm kernel meal and urea as the protein sources. The 3.5% urea treated rice straw was used as a roughage source, by adding 3.5 g urea in 100 ml water to 100 g air-dry (91% DM) straw. The relevant volume of urea solution was sprayed onto a stack of whole straw bales and then covering the stack with a plastic sheet for a minimum of 10 days before feeding directly to animals (Wanapat, 2000). The RPM was prepared by oven-drying at 60°C for 3 days then grinding. Feed ingredients and chemical composition of the diets are shown in Table 1.

Ingredients and chemical composition (g/kg DM) of concentrate, 3.5% urea treated rice straw and rain tree pod meal used in the experiment
Animals and inocula
Two, 1-year-old, rumen fistulated dairy steers with an initial BW of 250±15 kg were used as rumen fluid donors. Dairy steer rumen fluid was collected from animals fed with a R:C of 60:40 (14% CP and 78.6% TDN, dry matter basis). Animals were housed in individual pens and had continuous access to fresh water and vitamin/mineral block for 15 days.
On day 15, about 1,000 ml rumen liquor was taken through the cannula of each dairy steer immediately before the morning feeding and strained through four layers of cheesecloth into an Erlenmeyer flask.
In vitro fermentation of substrates
Samples of each total mix substrate (200 mg) were weighed into 50 ml serum bottles. Ruminal fluid from each dairy steer was mixed with the artificial saliva solution of Menke and Steingass (1988) in a proportion 2:1 (ml/ml) at 39°C under continuous flushing with CO2. Thirty millilitres of rumen inoculum mixture were added into each bottle under CO2 flushing. Bottles were sealed with rubber stoppers and aluminium caps and incubated at 39°C for 96 h.
Sample and analysis
During the incubation, the gas production was measured immediately after incubation and after 0, 1, 2, 3, 4, 6, 8, 10, 12, 24, 36, 48, 72 and 96 h by using a pressure transducer and a calibrated syringe. Cumulative gas production data were fitted to the model of Ørskov and McDonald (1979) as follows:
where a = the gas production from the immediately soluble fraction, b = the gas production from the insoluble fraction, c = the gas production rate constant for the insoluble fraction (b), t = incubation time, (a+b) = the potential extent of gas production. y = gas produced at time “t”.
Inoculum ruminal fluid was sampled at 0, 4, 6, 12 and 24 h post inoculations. Rumen fluid samples were then filtered through four layers of cheesecloth. Samples were divided into 3 portions; the first portion was centrifuged at 16,000×g for 15 min, and the supernatant was stored at −20°C before NH3-N analysis using the micro-Kjeldahl methods AOAC (1990) and VFA analysis using HPLC (Samuel et al., 1997). The second portion was fixed with 10% formalin solution in a sterilized 0.9% saline solution for a total direct count of protozoa made by the methods of Galyean (1989) based on the use of a hemocytometer (Boeco, Hamburg, Germany). The final portion was stored at −20°C for DNA extraction (Yu and Morrison, 2004). In vitro degradability was determined after termination of incubation, when the contents were filtered through pre-weighed Gooch crucibles and residual dry matter was estimated. The percent loss in weight was determined and presented as in vitro dry matter degradability (IVDMD). The dried feed sample and residue left above was ashed at 550°C for determination of in vitro organic matter degradability (IVOMD) (Tilley and Terry, 1963). Content of condensed tannins in RPM was analysed by using the modified vanillin-HCl method based on Burns (1971). Calculation of ruminal methane (CH4) production using VFA proportions according to Moss et al. (2000) as follows:
Rumen microbial population
Community deoxyribonucleic acids (DNA) extraction
Community DNA was extracted from 2.0 ml of rumen fluid of each sample by the RBB+C method (Yu and Morrison, 2004), which was shown to substantially increase DNA yields. The quality and quantity of these DNA samples were also determined by agarose gel electrophoresis and spectrophotometry.
Primers and polymerase chain reaction (PCR)
Primers for Fibrobactor succinogenes, Fs219f (5′GGT ATG GGA TGA GCT TGC-3′) and Fs654r (5′-GCC TGC CCC TGA ACT ATC-3′), were selected to allow amplification (446-bp product) of all 10 F. succinogenes strains deposited in GenBank. For Ruminococcus albus primers, Ra1281f (5′-CCC TAA AAG CAG TCT TAG TTC G-3′) and Ra1439r (5′ CCT CCT TGC GGT TAG AAC A-3′) (175-bp product). Ruminococcus flavefaciens primers, Rf154f (5′-TCT GGA AAC GGA TGG TA-3′) and Rf425r (5′-CCT TTA AGA CAG GAG TTT ACA A-3′), were also selected to allow species–specific amplification (295 bp) of all seven R. flavefaciens strains deposited in GenBank. All these primer sets were previously published by Koike and Kobayashi (2001). For methanogens primers, forward primers (5′-TTCGGTGGATCDCARAGRGC-3′) and reverse primers (5′-GBARGTCGW- AWCCGTAGAATCC -3′) were employed as described by Denman et al. (2005). PCR conditions for F. succinogenes were as follows: 30 s at 94°C for denaturing, 30 s at 60°C for annealing and 30 s at 72°C for extension (48 cycles), except for 9 min denaturation in the first cycle and 10 min extension in the last cycle. Amplification of 16S rRNA for the other two species was carried out similarly except an annealing temperature of 55°C was used. The PCR conditions for methanogens were as follows; 30 s at 94°C for denaturing, 30 s at 58°C for annealing and 90 s at 72°C for extension (35 cycles) (Wright et al., 2004).
Real-time PCR
The targeted bacteria were cellulolytic bacteria (F. succinogenes, R. albus and R. flavefaciens) and methanogens. To establish a quantitative assay, we amplified target 16s rDNA of each species by using specific primers and PCR conditions as described previously, the purified DNA was quantified by spectrophotometry by comparing the products with serial 10- fold dilutions from 101 to 108 DNA copies of the previously quantified DNA standards. Real-time PCR amplification and detection were performed in a Chromo 4TM system (Bio-Rad, USA). In brief, Biostools QuantiMix Easy SYG Kit was used for PCR amplification. Samples were assayed in duplicate in a 20 μl reaction mixture contained 4–6 mM MgCl2, 10 μl of Mastermix (including; Taq DNA polymerase, reaction buffer, dNTP mixture, MgCl2 and SybrGreen), 2 μl of DNA template, and 0.8 μl of each primer (10 μM/μl).
Statistical analysis
All data were analyzed as a 6×4 factorial arrangement in a completely randomized design (CRD) using the general linear procedure in PROC GLM of SAS (1996). The statistical model included terms for R:C ratio, RPM level, and the R:C ratio×RPM level interactions. Trend of ratios responded was performed by orthogonal polynomials.
RESULTS
Gas kinetics and cumulative gas production of each substrate treatments are presented in Table 2. Gas kinetics, extent rate (C) was linearly increased while, rate (a+b) was linearly decreased with increasing level of concentrate. Cumulative gas production at 96 h was influenced by different R:C ratios which were higher (p<0.05) in R:C of 40:60. In addition, interaction of R:C ratio and RPM level affected IVDMD and was highest in R:C of 40:60 with 8 mg of RPM while, IVOMD was quadratically increased with increasing level of concentrate in the diet (Table 2).
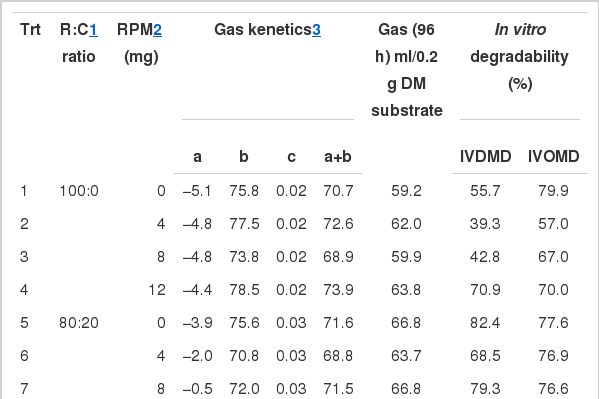
The effect of roughage to concentrate ratio with rain tree pod meal on gas kinetics, gas production and degradability from in vitro incubation with rumen fluid
The NH3-N concentration of all treatments ranged from 13.9–32.1 mg/dl (Table 3). In the in vitro gas production technique, NH3-N concentration was highest in R:C of 0:100 with 0 and 4 mg of RPM (32.1 and 30.9 mg/100 ml, respectively). While NH3-N was found to be the lowest in R:C of 100:0 and 40:60 with 12 mg of RPM (13.9 and 14.5 mg/100 ml, respectively).
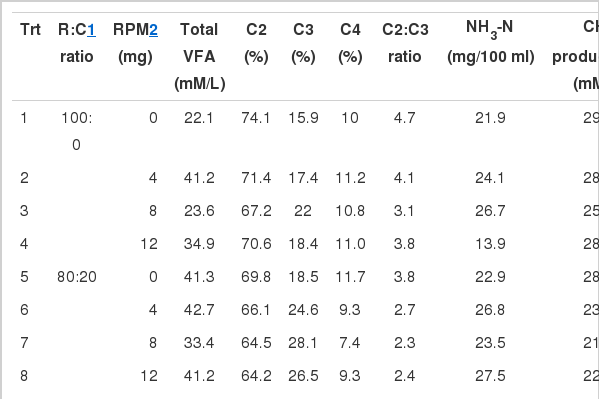
The effect of roughage to concentrate ratio with rain tree pod meal on in vitro volatile fatty acids (VFAs), NH3-N, methane production and protozoal population
Interaction between R:C ratio and RPM level affected the total VFAs and individual VFAs production (Table 3). Total VFA concentrations in R:C of 20:80 with 8 mg of RPM (53.2 mM/L) were higher than other treatments (p<0.05). In addition, R:C of 0:100 and 20:80 with 8 mg of RPM and 40:60 with 12 mg of RPM resulted in a higher (p<0.01) proportion of propionate (33.2, 32.9 and 32.1 mM/L, respectively) and a lower (p<0.01) proportion of acetate and acetate to propionate ratio. While the proportion of butyrate was highest (p<0.01) in R:C of 0:100 and 20:80 with 12 mg of RPM (13.7 and 13.1 mM/L, respectively). Calculation of ruminal methane (CH4) production using VFA proportions according to Moss et al. (2000) showed that methane production was influenced by interaction of R:C ratio and RPM level, which was lower (p<0.05) in R:C of 0:100 and 20:80 with 8 mg of RPM and 40:60 with 12 mg of RPM (18.1, 18.3 and 18.8 mM/L). Under the current study, the two factors, R:C ratio and RPM level affected the protozoal population which was lower (p<0.05) in R:C of 20:80 and 40:60, respectively and RPM level at 12 mg.
External standards for real-time PCR were prepared from a simulated rumen matrix. For each standard, linear regressions derived from the threshold cycle [C(T)] of each DNA dilution versus the log quality (Figure 1) were calculated. Logarithms of the DNA concentration (copies/ml) were plotted against the calculated means (Figure 1), obtaining a straight line of equations y = −0.3122x+10.55, y = −0.2864x+12.10, y = −0.3718x+11.72, y = −0.1337x+9.57 and y = −0.2692x+11.99 (where y is the log of DNA concentration and x is the Ct), with a linear correlation coefficient (r2) of 0.997, 0.997, 0.993, 0.995 and 0.991 for total bacteria (Figure 1a), methanogens (Figure 1b), F. succinogenes (Figure 1c), R. flavefaciens (Figure 1d) and R. albus (Figure 1e), respectively. These equations were used to quantify DNA from rumen digesta samples. The accuracy of each real-time PCR was validated by quantifying known numbers of target species templates (Total bacteria, Methanogens, F. succinogenes, R. flavefaciens and R. albus) and is shown in Table 4. The interaction of R:C ratio and RPM level had an effect on the total bacteria present, which highest (p<0.01) in R:C of 20:80 with 8 mg of RPM (43.6×10⁹). The number of methanogens present linearly increased (p<0.05) with an increasing level of concentrate in the diet. However, the percentage of methanogens in the total bacterial population linearly decreased with an increasing level of concentrate and RPM. Predominant cellulolytic bacteria (R. flavefaciens, F. succinogenes and R. alus) were variable between substrate treatments. The F. succinogenes population was found to be the highest across substrate treatments especially in R:C of 60:40 with 8 mg of RPM (8.3×10⁸ copies/ml) as compared to R. flavefaciens, and R. albus. However, the R. flaveflaciens population was found highest in R:C of 60:40 with 12 mg of RPM (8.1×10⁷ copies/ml), whereas R. albus was higher in R:C of 60:40 and RPM level at 12 mg.

The standard curves obtained by plotting the logarithm of DNA concentration for Total bacteria (a), Methanogens (b), F. succinogenes (c), R. flavefaciens (d) and R. albus (e) versus threshold cycle (Ct) for population quantification by using real time PCR.
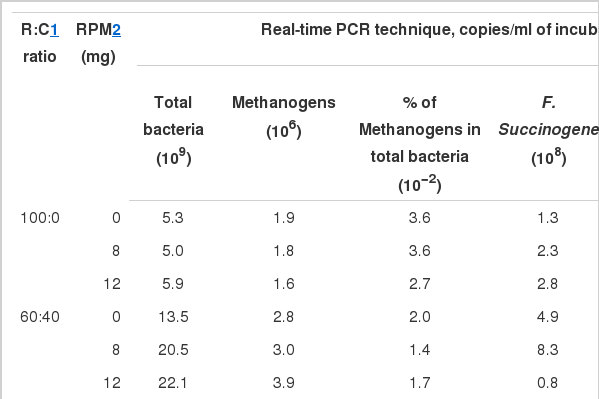
The effect of roughage to concentrate ratio with rain tree pod meal on bacterial population, methanogens and cellulolytic bacteria
DISCUSSION
Gas kinetics and cumulative gas production was influenced by different R:C ratios, especially the constant rate (c) which linearly increased with an increasing level of concentrate. While cumulative gas production was highest in R:C of 40:60. These findings suggest that the inclusion of high levels of concentrate results in an increasing rate and extent of fermentation of the inoculums. Similarly with Lunsin and Wanapat (2010) who reported that gas production and gas kenetic were linearly increased with increasing levels of concentrate from 30 to 70%. However, a high level of concentrate may lower the pH and impact on the microbial population (Slyter, 1976).
The in vitro degradability of both DM and OM quadratically increased with an increasing level of concentrate. This could be due to a corresponding increase of microbes which then increased degradability. However, an all concentrate diet reduced the population of microorganisms under the current study.
The NH3-N concentration was highest in R:C of 0:100 with 0 and 4 mg of RPM. These results may be due to a higher enzymatic breakdown of the dietary soluble fraction in high levels of concentrate. While NH3-N was found lowest in R:C of 100:0 and 40:60 with 12 mg of RPM (13.9 and 14.5 mg/100 ml, respectively). This result could be due to the effects of tannins contained in RPM which protect crude protein from degradation by the formation of tannin-protein complexes in the rumen, thereby increasing metabolizable protein supply to the duodenum (Mueller-Harver, 2006; Waghorn, 2008). Puchala et al. (2005) also reported that ruminal NH3-N concentrations were lower in goats fed CT-containing pasture Sericea lespedeza than crabgrass/tall fescue. However, the present level was similar to the level reported as an optimal to improve rumen ecology, digestibility and intake (Wanapat and Pimpa, 1999).
An interaction between R:C ratio and RPM level was found and which affected the total VFA concentrations. This effect was greatest in R:C of 20:80 with 8 mg of RPM. In addition, the propionate produced was highest while the ratio of acetate to propionate and methane production was lowest in R:C of 20:80 with 8 mg of RPM and 40:60 with 12 mg of RPM, respectively. The high proportion of propionate was caused by a decreased methane production at the low roughage ratio due to tannins contained in RPM. The expected shift of hydrogen from the methane pathway made it available to be used to produce propionate. Effects of tannins on increased propionate and reduced acetate to propionate ratio have been found to vary with diets and applications. A similar shift in propionate production has been reported by Bhatta et al. (2009). Moreover, Chanthakhoun et al. (2011) reported that feeding Phaseolus calcaratus hay (2.8% CT) at 600 g/hd/d in swamp buffalo resulted in increased production of propionate. These results indicate that a high level of concentrate can be used with RPM up to 12 mg in in vitro studies for reducing fermentation losses and improving VFA profiles. However, the use of high levels of concentrate should be taken into consideration regarding rumen ecology and animal health problems when applied to the in vivo system.
The R:C ratio and RPM level affected the protozoal population which was lower in a R:C of 20:80 and 40:60, respectively and increased at level 12 mg RPM. Newbold et al. (1997) found that protozoal numbers decreased when animals were fed with tannin containing foliage. Similarly with Bhatta et al. (2009) who reported that tannins suppress methanogenesis by reducing the protozoal population in vitro. Moreover, Van Soest (1982) reported that an increasing level of concentrate reduced the protozoal population. Similarly with Mackie et al. (1978) who reported that protozoal concentrations usually begin to decrease when the level of concentrate exceeds 60%. On the other hand, Franzolin and Dehority (1996) reported that the average concentration of Entodinium in steers decreased when fed a 90% concentrate diet. In contrast with De Semet et al. (1992) who reported that the concentration of protozoa in ruminal contents generally increases with the addition of concentrates to roughage diets. This observation is supported by Cherdthong et al. (2010) who found that protozoal populations linearly increased with an increasing level of concentrate.
Total bacteria were highest in R:C of 20:80 with 8 mg of RPM (43.6×10⁹). While the percentage of methanogens in total bacteria was lower in R:C of 20:80 and 40:60, respectively and 12 mg RPM. These results could be due to the effect of a high level of concentrate and tannin contained in RPM. Vinh et al. (2011) found the density of methanogens in the rumen appeared to be influenced by diet and particularly by the fiber content of the diet. Singh and Singh (1997) reported a decrease in the numbers of methanogens when cattle were fed high concentrate diet. In agreement with Poungchompu et al. (2009) who reported that a high level of concentrate diet remarkably reduced rumen methanogens. Moreover, plants containing tannins could reduce methanogens as reported by Bhatta et al. (2009), Field et al. (1989) and Animut et al. (2008).
Predominant cellulolytic bacteria in in vitro incubation were 8.3×10⁸, 8.1×10⁷ and 9.5×10⁵ copies/ml for F. succinogenes, R. flavefaciens, and R. alus, respectively. Wanapat and Cherdthong (2009), Koike and Kobayashi (2001) and Russell and Rychlik (2001) reported that F. succinogenes was the most dominant bacteria among the three species of cellulolytic bacteria. Moreover, the level of concentrate in the diet could influence the population size or the proportion of cellulolytic bacteria numbers in the rumen. In addition, the three cellulolytic bacteria numbers examined in the present study were significantly different, responding to level of concentrate. As the results showed, the population of F. succinogenes was lowest in R:C of 20:80, while R. flavefaciens and R. albus numbers quadratically decreased with an increasing level of concentrate in the diet. Similarly to Cherdthong et al. (2010) who reported that the numbers of the three cellulolytic bacteria decreased with an increasing level of concentrate. Moreover, Wora-anu et al. (2000) found that cellulolytic bacteria decreased with increased concentrate ratio in the diet. It is possible that dietary conditions reduced the numbers of cellulolytic bacteria. Furthermore, the type of feed, environmental factors such as temperature, pH and the existence of cations and soluble carbohydrate have been suggested as factors governing bacterial attachment (Miron et al., 2001). In the present study, the quantification of bacteria DNA demonstrated a decrease in the numbers of the three cellulolytic bacteria (F. succinogenes, R. flavefaciens and R. albus) with higher levels of concentrate.
CONCLUSIONS
Based on this study it can be concluded that the ratio of R:C at 40:60 and RPM level at 12 mg could improve ruminal fluid fermentation end-products in terms of increased total volatile fatty acid, propionate production and rumen microbes while acetate to propionate ratio, methane production, methanogens and protozoal population decreased. These results revealed a potential use of RPM as a supplement to improve rumen fermentation for ruminant feeding.
ACKNOWLEDGEMENTS
The authors would like to express most sincere thanks to the Tropical Feed Resources Research and Development Center (TROFREC), Thailand Research Fund (TRF) through the Royal Golden Jubilee PhD Program, Department of Animal Science, Faculty of Agriculture, Khon Kaen University, for kind financial support, experimental animals, laboratory and the use of research facilities.