Transfer of Orally Administered Terpenes in Goat Milk and Cheese
Article information
Abstract
The objective of the present study was to investigate the relationships between terpenes’ intake and their presence in animal tissues (blood and milk) as well as in the final product (cheese). Eight dairy goats were divided in two balanced groups, representing control (C) and treatment (T) group. In T group oral administration of a mixture of terpenes (α-pinene, limonene and β-caryophyllene) was applied over a period of 18 d. Cheese was produced, from C and T groups separately, on three time points, twice during the period of terpenes’ oral administration and once after the end of experiment. Terpenes were identified in blood by extraction using petroleum ether and in milk and cheese by the use of solid phase micro-extraction (SPME) method, followed by GC-MS analysis. Chemical properties of the milk and the produced cheeses were analyzed and found not differing between the two groups. Limonene and α-pinene were found in all blood and milk samples of the T group after a lag-phase of 3 d, while β-caryophyllene was determined only in few milk samples. Moreover, none of the terpenes were traced in blood and milk of C animals. In cheese, terpenes’ concentrations presented a more complicated pattern implying that terpenes may not be reliable feed tracers. We concluded that monoterpenes can be regarded as potential feed tracers for authentification of goat milk, but further research is required on factors affecting their transfer.
INTRODUCTION
Traceability has become one of the target systems for quality assurance of animal products through various steps within the food chain from farm to consumer. It is defined according to the European Regulation (ER) 178/2002, as system that has “the ability to trace and follow a food, feed, food producing animal or ingredients, through all stages of production and distribution” (Dalvit et al., 2008). Since modern consumers request ample information on feeds, farming system and the origin of animal products (Prache et al., 2005), farmers and commercial organizations have developed identification schemes using “quality labels” (Morand-Fehr et al., 2007). These quality labels are based on a variety of certification systems, which have been applied for animal products that involve mainly administrative controls and onsite inspections at the farm.
Lately, plant secondary metabolites (PSM) (Duncan et al., 1994; Estell, 2010), a diverse array of biologically active compounds (Duncan and Poppi, 2008), have been proposed as feed tracers for the identification of animal products (Prache et al., 2005). Generally, feed tracers are defined as the compounds that are not synthesized by the animals, whilst their occurrence in animal products or tissues is unambiguously due to the consumed diet. According to Spencer et al. (2008), the requirements for a compound to be classified as feed tracer are: a) robustness of the related qualitative and quantitative analytical methods, b) sensitivity to changes in intake of the diet of interest, c) specificity to the ration of interest and d) linear relationship between dietary intake and feed tracer concentration in animal tissues, considering the factors that involve, absorption, metabolism and excretion of the potential tracer. In the class of PSM the most widespread compounds in nature are terpenes, however, their concentration in plants varies greatly among plant species, plant part, phenological stage (Llusia et al., 2006; Ait Said et al., 2011), environmental conditions and management practices (Mariaca et al., 1997). Among terpenes, the most widespread are the monoterpenes α-pinene and limonene (Mariaca et al., 1997; Tornambe et al., 2006) and the sesquiterpene β-caryophyllene (Clericuzio et al., 2000) which are detected in considerably higher concentrations in forbs and woody plants as compared to gramineaeus vegetation (Duncan and Poppi, 2008).
Although published data, on the use of feed tracers in animal products identification, mostly focus on sheep and cows (Martin et al., 2005; Tornambe et al., 2006; Abilleira et al., 2010; Poulopoulou et al., 2011), the respective literature on goats is limited (Fedele et al., 2004). Browsers, such as goats, are more likely to consume a diet of high terpenes’ content (Vasta et al., 2008), while sheep and cows feed on forages with negligible contents of these compounds (Duncan and Poppi, 2008). Moreover, despite several qualitative and few quantitative reports on the presence of PSM in dairy products, data on the conformity of terpenes as feed tracers according to the above set of criteria are missing.
In the present study, a mixture of two monoterpenes, α-pinene and limonene, and a sesquiterpene, β-caryophyllene, were dosed orally to goats under controlled experimental conditions and their concentrations in blood, milk and cheese were determined and correlated. The choice for predetermined doses of pure terpenes was made in order to achieve precision on the daily intake of terpenes, thus eliminating variation due to fluctuation in terpenes’ concentration in herbage. The aim of the study was to investigate the transfer capacity of these terpenes to blood, milk and cheese, after oral administration to goats and to test the ability of them being used as feed tracers.
MATERIALS AND METHODS
Experimental design
Eight adult healthy goats (live weight 55 kg, SD 6.4 kg) (crossbreed native×Alpine) were used for the present study. The animals were housed at the experimental unit of the Department of Nutritional Physiology and Feeding at the Agricultural University of Athens. During the 20 d of the experiment all goats were housed in the same pen and had unrestricted access to fresh tap water, their management conforming to the guidelines of the Faculty of Animal Science and Aquaculture of the Agricultural University of Athens. The animals were fed in group and the diet was based on alfalfa hay (8 kg/d), wheat straw (2 kg/d) and a commercial pelleted concentrate mixture (8 kg/d) which consisted, on a dry matter basis, of 10% crude protein; 4% fiber; 1.2% Ca; 0.9% P; vitamins and minerals. The ration was offered ad libitum twice daily (in equal portions) at a rate to fully satisfy their maintenance and milk production requirements.
The animals were divided in two groups, Control (C) and Treatment (T) animals, according to their body weight and milk production (yield 1.2 kg/d). Goats of the T group were orally administered with 1 g of each one of the following terpenes: α-pinene, limonene and β-caryophyllene (Sigma Aldrich: No.2320878 USA, No.2278135 Switzerland and No.2017461 Spain, respectively). A mixture of all three terpenes in soybean oil was prepared to provide 1 g of each in 10 ml and T group goats were orally dosed, with this amount, each morning prior to feeding, for a period of 18 d. Each one of the C group goats received 10 ml of plain soybean oil at the same time.
Blood plasma sampling and analysis
At 0, 2, 4, 8 and 12 h after the first dosing, blood samples were collected by jugular venipuncture into heparin tubes and the procedure was repeated at 1, 2, 5, 7, 15, 18, 19 and 20th d of the experiment, just after the animals were milked. Whole blood was centrifugated at 1,700 g for 10 min at 4°C and blood plasma was collected and stored at −80°C until analysis. Terpenes’ analysis was performed through GC-MS according to Poulopoulou et al. (2011).
Milk and cheese analyses
Milking was performed daily, milk yields were recorded and individual milk samples were collected and analyzed for fat, protein, lactose, total solids and non fat solids contents using Milkoscan FT, CombiFoss 6000 (Foss Electric Denmark) or stored at −20°C until terpenes’ analysis. The concentrations of terpenes in milk were determined using the solid phase micro-extraction (SPME) method and a GC-MS analyzer according to the method described by Poulopoulou et al. (2011).
Cheese making process and analysis
Bulk milk collected separately for C and T groups and “Kefalotiri”, a traditional Greek hard cheese, prepared three times at days 2, 12 and 22 after the start of the experiment. Cheese was prepared according to the standardized procedures of the Department of Dairy Science at the Agricultural University of Athens, as reported by Poulopoulou et al. (2011). Cheese samples were analyzed in triplicate for total solids, fat, crude protein and water soluble protein according to IDF standards (IDF, 1982; 1991; 1993). Cheese terpenes’ concentrations were determined using the solid phase micro-extraction (SPME) method and a GC-MS analyzer according to the method described by Poulopoulou et al. (2011).
Statistical analysis
The analysis of data was performed by analysis of variance (ANOVA) using the generalized linear model (GLM) in the Statgraphics software (Statgraphics, 2000). The effects of the treatment and the day for plasma and milk terpenes’ concentrations were used in the statistical model. The effect of the animal was used as random effect in the analysis. The data are presented as mean±SEM.
The model that was used was:
where:
a = is the overall mean
i = 1 to 8, animal number, bi ~ N(0, σb2)
j = control, α-pinene, limonene, β-caryophyllene
k = 1,….n, sampling day
e = random residual, eijk~N(0, σε2)
RESULTS
Milk production and chemical characteristics of milk and cheese
Average milk yield during the experiment was 1.2 kg/head/d and did not differ statistically between C and T groups of animals (Table 1). Milk chemical composition showed no significant differences between the two groups of animals (Table 2). Moreover, the same was the case for gross chemical characteristics of the three cheese batches between C and T group of animals (Table 3).
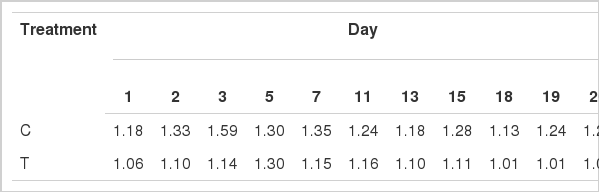
Evolution of goats’ milk production (kg/head/d) during the trial for the control (C) and treatment (T) groups of animals

Chemical composition of goat milk produced by control (C) and treatment (T) groups of animals at different days during the trial
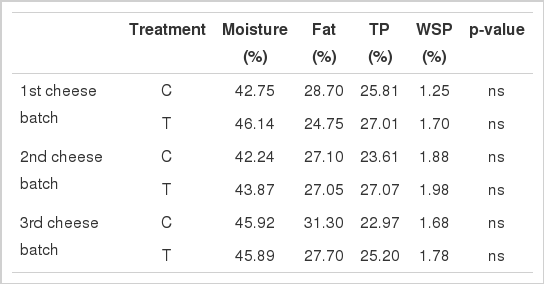
Chemical characteristics of goats’ cheese produced by control (C) and treatment (T) groups of animals during three time points (1, 2 and 3) in experiment
Terpenes’ concentration in blood plasma, milk and cheese
During the first 24 h after terpenes’ oral administration the concentration of α-pinene and limonene in blood plasma demonstrated a peaking pattern with the peak value 4 h after the initial dose, where the concentration of limonene was about 3 times higher than α-pinene (Figure 1). However, 8 h after dosing, all three terpenes were detected in near zero concentrations in blood samples of T group, as it was the case for β-caryophyllene which did not appear at all since the initial dose (Figure 1). In blood samples of the C animals, none of the studied terpenes were detected (not shown). The concentration of α-pinene and limonene in blood plasma showed an increasing pattern until the 7th day, which was higher for limonene (p<0.05), while β-caryophyllene was detected in very low concentrations in blood samples of the T animals (Figure 2). Subsequently, the concentrations of α-pinene and limonene showed a decreasing pattern, after the 7th d, reaching near to zero concentrations at the end of the experiment (Figure 2).
Mean α-pinene, limonene and β-caryophyllene concentration (µg/ml) for the first 24 h in goats’ blood plasma receiving 1g/head/d of each substance. The primary axis is the concentration in µg/ml of α-pinene and limonene and the secondary axis is the concentration in µg/ml of β-caryophyllene. Bars on each mean represent standard errors of mean values.

Mean α-pinene, limonene and β-caryophyllene concentration (µg/ml) in goats’ blood plasma receiving 1 g/head/d of each substance. The primary axis is the concentration in μg/ml of α-pinene and limonene and the secondary axis is the concentration in µg/ml of β-caryophyllene. Bars on each mean represent standard errors of mean values.
The analysis of milk samples demonstrated that α-pinene and limonene were present in all T group samples after the third day of the trial, showing a variable pattern thereafter (Figure 3). More specifically, both terpenes showed a general increasing pattern, until the cessation of dosing, which was promptly followed by a decline (Figure 3). The concentration of α-pinene was higher than that of limonene during trial (p<0.05). Moreover, β-caryophyllene was not detected in any T group milk samples while; none of the studied terpenes was traced in milk samples of C animals (not shown).
Mean α-pinene and limonene concentration (µg/ml) in goats’ milk receiving 1 g/head/d of each substance. Bars on each mean represent standard errors of mean values.
All administered terpenes were detected in the cheese made from T animals in all batches (Figure 4). Nevertheless, in the first cheese batch limonene was deteted for both C and T groups (~2 ppm), while, α-pinene was detected in T group (~2 ppm) and only in traces in cheese of the C group. In the second batch, all three terpenes were detected in cheese from T group with limonene concentration reaching ~5 ppm, while, in cheese from the C group, only limonene was detected (0.4 ppm). The concentration of all three terpenes declined at the third cheese batch of T group while only limonene was detected at a concentration of 0.4 ppm in cheese of the C group on this case (Figure 4).
Concentration (ppm) of α-pinene, limonene and β-caryophyllene in ripe cheese produced from goat milk of control (C) and treatment (T) groups of animals during three time points (1, 2 and 3) in experiment.
DISCUSSION
Transfer of terpenes from diet to animal products and their potential towards identification of the origins of sheep and cows’ milk and cheese has been the subject of several studies (Viallon et al., 1999; Viallon et al., 2000; Coulon et al., 2004; Martin et al., 2005; Prache et al., 2005). However, respective data on goats are scarce.
Since the variability of terpenes’ profile and concentrations within and between plants is high, a certain amount of pure terpenes was chosen for the present study in order to secure that the animals were lump dosed with a terpene concentration that remained constant during the trial. The daily amount of terpenes dosed to the animals agrees well with the ones goats normally consume when foraging and was in line with previous studies (Dziba and Provenza, 2008; Utsumi et al., 2009; Poulopoulou et al., 2011). However, the feeding pattern of goats, in free range conditions, clearly distributes the daily consumption of terpenes over a longer time span during the day, which is further modified by the gradual release of cell contents in the rumen.
Average milk yield was not significantly affected by the oral administration of terpenes in this study. Nevertheless, Malecky et al. (2009) reported that when a high concentration of monoterpenes’ mixture was administered to cannulated dairy goats, milk yield was lower compared to the milk produced by goats receiving a low monoterpenes’ mixture. Similar results were obtained by Tornambe et al. (2006), who reported that milk yield was lower for cows grazing terpene rich pasture, as compared to cows fed on a low terpenes pasture. Thus, it appears that animal species is a factor that possibly affects milk yield in animals consuming a diet rich in terpenes.
Terpenes’ blood plasma concentrations showed peak values 4 h after administration. Following that, a decrease was observed for all three terpenes in plasma, reaching zero concentrations at 24 h, which was milder for β-caryophyllene. This 24 h pattern of terpenes’ concentration in goats’ blood after a single dose has also been observed in other studies (Boyle et al., 2002; Boyle et al., 2005; McLean et al., 2008). However, when Boyle et al. (2002) administered different concentrations (1%, 2% and 4% of the diet) of 1,8-cineole in possums, peak levels were detected in blood 20 min, 1 h and 2 h after dosing respectively, and the authors concluded that terpenes’ peak concentration in blood plasma could be dose depended. Poulopoulou et al. (2011) found peak concentrations of terpenes 2 h after oral administration to ewes, concluding that animal species might be a factor influencing the pattern of blood terpenes’ concentration after a single dose.
Although several studies examined the short term effect of terpenes’ consumption to their concentration in blood (Boyle et al., 2002; Boyle et al., 2005), this study presents data on the pattern of the respective concentration in blood plasma over a longer period. In the present 20 d trial, blood concentration for all three terpenes varied between days. After a lag phase of 3 d, terpenes developed blood levels varying significantly between days and sharply declined after termination of the oral administration. Since the amount of terpenes administered to the animals was constant between the days, these findings imply that factors other than diet and dose can possibly influence terpenes’ concentration in blood plasma. Such factors might be related to the biotransformation ability of the liver and the enzymes involved in this procedure (McLean and Duncan, 2006). The observed pattern of blood terpenes’ concentration is possibly related to the specific pharmacokinetics of the compounds, which is the case for all xenobiotics entering blood circulation (McLean and Duncan, 2006). Thus, after their distribution by the cardiovascular system within the body, these compounds enter tissues where enzymes may convert them into metabolites that are transferred again in the blood and become excreted in urine or, alternatively, liver produces metabolites that can be secreted into the bile and voided in the faeces (McLean and Duncan, 2006).
Both dosed monoterpenes, α-pinene and limonene, were traced in all milk samples 3 d after dosing onset and developed gradually to higher levels, while control group had no terpenes at all. Therefore, it is likely that they could be used as feed tracers in cases where the animals are in the pasture for at least 3 d. The same conclusion was reached in other studies (Priolo et al., 2004; Poulopoulou et al., 2011). Monoterpenes’ concentration in milk demonstrated an increasing pattern, which was more prominent after 7th day, but showed considerable variability between days. De Noni and Batelli (2008) reported great variability in terpenes’ concentration of cow’s milk when the animals were fed on terpene rich pasture and attributed that to the biochemical phenomena occurring in the rumen which are responsible for both degradation and hydrogenation of terpenes. Moreover, McLean et al. (1993) reported that although terpenes are well absorbed from the gut, as all lipophilic compounds, they require metabolism before excretion in the urine. Terpenes have been reported to be metabolized and excreted by the animals at different sites such as rumen (Viallon et al., 2000), lower intestine, liver, kidneys etc., where efficiencies are affected by a multitude of factors (Villalba et al., 2006).
Poulopoulou et al. (2011) in a similar study on sheep, reported up to ten times lower terpene concentrations in blood and, at the same time, up to ten times higher concentrations in milk compared to this study. It appears that animal species is an important factor influencing terpenes’ concentrations in animal biological fluids. Different feeding choices made by sheep and goats, associated with morphophysiological differences between these animals are well documented in literature (Hofmann, 1989; Hadjigeorgiou et al., 2003). Goats, compared to sheep, have a smaller reticulorumen volume, higher fermentation rate in the rumen, faster passage rate through the digestive tract, faster absorption of VFA, etc. (Hofmann, 1989; Duncan and Poppi, 2008; Tsiplakou et al., 2011), which would very likely affect terpenes metabolism.
The three terpenes were not traced in cheese at the same ratio as they were dosed to the animals. Monoterpenes, α-pinene and limonene, were detected in cheese produced from T goats. Nevertheless, although limonene peaked well in the T cheeses, it was also detected, though in lower concentrations, in C cheeses. In contrast, β-caryophyllene, which was not detected in any milk samples, was identified in T cheeses. That makes questionable the use of this sesquiterpene as feed tracer, at least for goats, although in studies with cows, β-caryophyllene was more efficient feed marker than monoterpenes (Tornambe et al., 2006). Since cheese is a condensed product of milk, substances present in low concentrations in milk are easier to be detected in cheese. Moreover, cheese is a fermented product and ripening may considerably alter the terpenes’ profile through biotransformation (de Carvalho and da Fonseca, 2006). Nevertheless, Cornu et al. (2005) reported that terpenes can modify the dynamics or the activity of the microbial ecosystem during cheese preparation and ripening, but the mechanisms behind this procedure are not clear. However, Revello-Chion et al. (2010) found no difference in terpenes’ profile between grazing cow milk and the respective ripened cheese.
The assignment of a substance as feed tracer is a complex task. The great variability observed in terpenes’ concentration reveals that there may be large differences in metabolism and transfer from plasma and milk to cheese between terpenes, individual animals and animal species. Absorbed terpenes when entering into the rumen or in animal tissues are thought to be converted into a variety of metabolites, which might be capable to return to their original structure under certain circumstances. This capacity may distort the terpenes’ profile, found in studies such as this one, therefore a study investigating the presence of various terpenes’ metabolites might shed light into this phenomenon. Thus, terpenes’ use as potential feed tracers and their efficacy for discriminating animal products at a given time should be tested more throroughly.
ACKNOWLEDGEMENTS
The first author was in receipt of a postgraduate studies scholarship, through the Hellenic State Scholarship Foundation, which is gratefully acknowledged.