Principal Milk Components in Buffalo, Holstein Cross, Indigenous Cattle and Red Chittagong Cattle from Bangladesh
Article information
Abstract
The aim of the present study was to get a total physical and chemical characterization and comparison of the principal components in Bangladeshi buffalo (B), Holstein cross (HX), Indigenous cattle (IC) and Red Chittagong Cattle (RCC) milk. Protein and casein (CN) composition and type, casein micellar size (CMS), naturally occurring peptides, free amino acids, fat, milk fat globule size (MFGS), fatty acid composition, carbohydrates, total and individual minerals were analyzed. These components are related to technological and nutritional properties of milk. Consequently, they are important for the dairy industry and in the animal feeding and breeding strategies. Considerable variation in most of the principal components of milk were observed among the animals. The milk of RCC and IC contained higher protein, CN, β-CN, whey protein, lactose, total mineral and P. They were more or less similar in most of the all other components. The B milk was found higher in CN number, in the content of αs2-, κ-CN and α-lactalbumin, free amino acids, unsaturated fatty acids, Ca and Ca:P. The B milk was also lower in β-lactoglobulin content and had the largest CMS and MFGS. Proportion of CN to whey protein was lower in HX milk and this milk was found higher in β-lactoglobulin and naturally occuring peptides. Considering the results obtained including the ratio of αs1-, αs2-, β- and κ-CN, B and RCC milk showed best data both from nutritional and technological aspects.
INTRODUCTION
Milk has a diverse composition of nutrients. The milk composition is subjected to change in response of genetics, breeding, feeding, number and stage of lactation and health status of the animal. Misra et al. (2008) compared four breeds of buffalo and showed breed variation in fat, total solids and solids-not-fat content. Islam et al. (2008) reported significantly more fat, protein and total solids in Red Chittagong Cattle (RCC) milk compared to crossbred (Holstein cross [HX], Jersey cross and Sahiwal cross) cow’s milk.
The composition of milk may also change over a period of time and may vary from country to country as a result of interaction effects of several factors like breeding program and feeding strategy. Lindmark-Mansson et al. (2003) reported that casein (CN) content in raw milk decreased from 2.61% (in the year 1970) to 2.56% (in the year 1995 through 1996) and whey protein (WP) content increased from 0.73% to 0.81% during the same period of time. Similar results in buffalo milk were also reported by Zicarelli (2004). Furthermore, Schonfeldt et al. (2012) called for more country specific milk composition data. Therefore, a more detailed overview of milk composition in terms of principal components is needed to set a standard on technological properties for processing the milk. The dairy industry in each country has challenges regarding breeding and nutritional strategy to produce milk with optimum quality for different purposes.
The composition of milk largely indicates its nutritional value and technological properties (Heck et al., 2009). The individual CNs, especially αs1-CN, α-lactalbumin (α-LA) and β-lactoglobulin (β-Lg) are considered as major milk allergens (El-Agamy, 2007; Downs et al., 2013). And more controversially, β-CN (variant A1, A1+B) is claimed to be more associated with type-I diabetes (Elliott et al., 1999), whereas, Bell et al. (2006) reported a lower incidence of type-I diabetes and cardiovascular diseases in a population consuming milk with high levels of β-CN variant A2. Butter from the milk with more unsaturated fatty acid (USFA) is suggested to have lower atherogenic index. In a technological perspective, such butter will be more spreadable, softer and less adhesive (Bobe et al., 2003). Milk protein, CN and fat content were found strongly positively correlated with the cheese yield (Pretto et al., 2013). Hallen et al. (2010) concluded that low concentration of κ-CN in milk is a risk factor for non-coagulation of milk. In addition to the individual CNs and casein micellar size (CMS) that influence the milk coagulation properties, milk fat globule size (MFGS) may also be important in cheese manufacturing. Michalski et al. (2004) found more firm and flexible ripened Emmental cheese from milk with larger MFGS than the milk with smaller ones.
The breeding strategy presently followed in Bangladesh takes into account only the volume of milk. Though milk fat and cchana (mainly protein curd) based milk pricing are also in practice. The information on milk composition can also be used to adjust the breeding practices to optimize milk quality (Glantz et al., 2009). Therefore, details on milk composition are important.
Buffalo milk is less studied than the cow’s milk. To our knowledge, naturally occurring peptides (NOP) from raw dairy milk has not been reported yet. Details on the true protein (TP), individual CN types and content, CN number, WP content and composition, non-protein nitrogen (NPN), CMS, free amino acids (FAA), fatty acid (FA) composition, MFGS, lactose, glucose, galactose, and individual minerals are important for technological and nutritional properties of milk. Some of this information can also be used to select animals in a breeding program to produce desirable quality milk.
The aim of the present study was to characterize and compare the principal components in buffalo (B), HX, Indigenous cattle (IC) and RCC milk from Bangladesh according to the protein content and types, CMS, naturally occurring peptides, free amino acids, fat content, FA composition and type, MFGS, carbohydrate and mineral content.
MATERIALS AND METHODS
Milk samples
Raw milk from B, IC and RCC were collected from the Bangladesh Livestock Research Institute and HX milk was collected from Central Cattle Breeding Station and Dairy Farm, Savar, Dhaka-1341, Bangladesh. The B cows were fed on ca. 4 kg straw with 0.250 kg of molasses/head/d, ca. 4 kg of concentrate mixture (wheat bran:khesari bran:wheat crust:oilcake:fishmeal:salt:premix = 3:0.75:0.30:0.20:0.04: 0.125:0.075)/head/d. The RCC and IC were supplied with ca. 3 kg of concentrate mixture (wheat bran:khesari bran:sesame oil cake:soybean oil cake:oyster shell crust:corn crust:common salt = 140:25:15:20:5:7.5:1)/head/d. The B, RCC, and IC were also supplied with german (Echinochloa crus-galli) and napier (Pennisetum purpureum) grass. They were also allowed grazing on road side grass (of various types, non-descriptive). The HX cows were fed on german (Echinochloa crus-galli), napier (Pennisetum purpureum), oat (Avena sativa) and para (Brachiaria mutica) grass. In addition, they were supplied with ca. 2.75 kg concentrate mixture (wheat bran:broken maize:khesari:soyabean:DCP:salt = 50:15:15:17:2:1)/head/d for first 3 L of milk. The HX cows also got additional 0.5 kg of that concentrate mixture for the production of every additional liter of milk. The milk production during the sampling time was 1.5 to 3.0 L, 2.5 to 8.5 L, 2.5 to 5.8 L and 1.3 to 5.0 L in B, HX, IC, and RCC, respectively. Different individuals of each group of animals were at different number and stage of lactation. All the milk samples were taken from the morning milking. Pooled milk sample of B was obtained from nine buffalo cows and for HX, IC and RCC, milk from twenty five, fifteen and nineteen cows, respectively were obtained. The collected pooled milk was then divided into several cellstar tubes (Greiner Bio-One, Maybachstrasse, Frickenhausen, Germany), approximately 40 mL/tube. The content of each tube was preserved with 1 bronopol tablet (D & F control systems, Inc. Boston, MA, USA). Samples for protein, CMS and MFGS analyses were kept at 4°C and samples for other analyses were frozen at −20°C.
Protein composition and types, casein micelle size, naturally occurring peptides and free amino acids
The TP, CN, WP, and NPN analyses of the milk were done by micro-Kjeldahl method according to Devold et al. (2011). In brief, the samples were digested by one digestion tablet (Kjeltabs Auto, Thompson and Capper Ltd., Runcorn WA7 1PH, UK) and 3 mL H2SO4 (96 to 97%; Merck, Darmstadt, Germany) in a Kjeldahl tube on an auto-digester (Foss Teactor, Foss analytical lab, Hoganas, Sweden) for 80 to 90 min at 420°C. Distillation and titration was carried-out on a Foss Kjeltec 8400 analyzer unit (Software version 1.5.18, Foss analytical lab, Hoganas, Sweden). The ratio of CN and WP was calculated and so was the CN number (CN×100/true protein).
The individual CNs (αs1-, αs2-, β- and κ-CN) and WPs (α-LA and β-Lg) were quantified by capillary zone electrophoresis (Agilent Technologies No. DE01603565, Santa Clara, CA, USA) and Agilent Chemstation software (Rev. B.03.02 [341]). A method described by Mestawet et al. (2013) was used. Briefly, skimmed milk was mixed with the sample buffer at a ratio of 1:1.5. Then it was vortexed, incubated for an hour at room temperature and centrifuged at 5,000 rpm at room temperature for 5 min. Both the samples and run buffer were filtered through 0.45 μm filter unit (Millipore Corp. Carrigtwohill, County Cork, Ireland). For the separation, a positive polarity at 45°C with a linear voltage gradient from 0 to 25 kV in 3 min, followed by a constant voltage of 25 kV for 45 min with 20 mM sodium acetate (Merck, Darmstadt, Germany) buffer at pH (3±0.1) were employed. The individual CN ratio (αs1: αs2:β:κ) was calculated from their relative concentration.
The CMS was measured by Zeta Sizer 3000 HS (Malvern Instruments Ltd. Malvern, Worcestershire, UK), a method according to Devold et al. (2011). Ten microliter milk was diluted into 8 mL simulated milk ultrafiltrate filtered through a 0.22 μm filter (Millipore Corp. Carrigtwohill, County Cork, Ireland). Then the diluted samples were filtered through a 0.8 μm filter (Millipore Corp. Carrigtwohill, County Cork, Ireland) and the temperature was adjusted to 25°C before measurement.
For the NOP analysis, a method by Qureshi et al. (2012) with some modifications was used. The molecular weight cut-off spin column membrane (Molecular weight 10 kDa, regenerated cellulose, VWR, Cork, Ireland) was prepared by loading 400 μL milli-Q water and centrifuged at 1,000 rpm, at room temperature for 30 min. Then 330 μL of skimmed milk was loaded onto the column and centrifuged at 13,000 rpm, at 4°C for 45 min. The milk filtrate was then desalted. Desalted samples were kept at −20°C until analyzed. Before analysis, 10 μL of 0.5% formic acid was added to the samples and loaded on a nano-ACQUITY Ultra Performance Liquid Chromatograph (UPLC, Waters, Milford, USA). The UPLC was coupled with a Quadrapole-Time of Flight (Q-TOF) Ultima Mass Spectrometer (MS; Micromass, Manchester, UK). The resulted peak list files were searched against the National Center for Biotechnology Information (NCBI) protein sequence databases. An in-house Mascot server (version 2.3; Matrix Sciences, London, UK) was used. Analyses were done for both single and multiple charged peptides.
A modified method described by Qureshi et al. (2012) was used to measure the content of FAA in milk. Milk was mixed at a ratio of 1:1 with 0.1 M HCL (Merck, Darmstadt, Germany). One milliliter of this HCL contained 0.4 μmol L-norvalin (Sigma, St. Louis, USA) and 0.4 μmol piperidine-4-carboxylic acid (Fluka, St. Louis, USA) as internal standards.
Fat, milk fat globule size and fatty acid composition in neutral lipids, free fatty acids and polar lipids
Milk fat content was estimated by using an auto milk analyzer (Lactostar, Funke-Gerber, Berlin, Germany). The MFGS was measured by the method of Jones (2003), using Master Sizer 2000 (Malvern Instrument, Uppsala, Sweden). Milk was diluted by 35 mM EDTA (VWR International, Radnor, PA, USA) at a ratio of 1:1 and incubated for 30 min at room temperature followed by vortex. For the measurement, ca. 1.5 mL sample was used.
For the FA composition, total lipid was extracted by a modified method according to Folch et al. (1957). Twenty milliliter of chloroform (VWR International, Radnor, PA, USA) and methanol (Merck, Darmstadt, Germany) mixture (2:1) was added to 1 mL milk followed by adding internal standards (IS). Tri-nonadecanoin (10 mg/mL in chloroform) and nonadecanoic acid (1 mg/mL in chloroform) were used as IS, both from Larodan AB, Malmo, Sweden. The content was then incubated on a shaker at 150 rpm, at room temperature for 15 min. After incubation, 4 mL NaCl (0.9% in water) was added. Then it was vortexed and centrifuged at 2,000 rpm, at room temperature, for 10 min. The organic phase was collected and dried under N2 gas. The dried lipids were dissolved in 1 mL chloroform and were fractionated into neutral lipid (NL), free fatty acids (FFA) and polar lipid (PL) by a modified method according to Ruiz et al. (2004). To elute the PL, only methanol was used. These fractions were also dried under the N2 gas. Two milliliter hexane (Merck, Darmstadt, Germany) was added to the tubes containing dried NL and PL. Methylation of FFA was done by adding 1 mL boron tri-fluoride – methanol complex (14% BF3 in CH3OH, Sigma Aldrich, Seelze, Germany) and incubated at 70°C for 5 min. Two milliliter hexane was added to it and the upper phase was transferred in to GC-vials. Methylation of NL and PL and analysis of NL, FFA, and PL were performed according to Devle et al. (2012). In brief, metallic sodium (Merck, Darmstadt, Germany) was dissolved in methanol (3 mg/mL) to make the sodium methanolate solution. For the methylation of NL and PL, sodium methanolate (1.5 mL/sample) was added and the content was incubated on a horizontal shaker set at 350 rpm, at room temperature for 30 min. Then the sample tubes were left at a vertical position for 10 min and hexane phase was transferred in to GC-vials. An Agilent 6890 Series gas chromatograph (GC; Agilent Technology, Wilmington, DE, USA) coupled with an Autospec Ultima MS (Micromass Ltd., Manchester, England) was used for the FA composition analysis.
Content of carbohydrates
The carbohydrate analysis was done by a modified method according to Narvhus et al. (1998) using High Performance Liquid Chromatography technique. One gram milk was diluted by 2.5 mL milli-Q water. The analysis was carried out with an Aminex HPX-87H column (Bio-Rad laboratories, Hercules, CA, USA) at 30°C connected to a – Perkin Elmer Series 200 pump (Perkin Elmer, Waltham, MA, USA), Perkin Elmer series 200 auto sampler (Perkin Elmer, Shelton, USA) and Perkin Elmer LC oven 101 (Perkin Elmer, Shelton, USA). Five milli molar H2SO4 (Merck, Darmstadt, Germany) was used as the mobile phase with a flow rate of 0.4 mL/min. Lactose, glucose and galactose were identified according to the standards (lactose, glucose and galactose, all from Merck, Darmstadt, Germany) using Perkin Elmer series 200 refractive index detector (Perkin Elmer, Norwalk, USA).
Minerals content
Total mineral content was measured by using the Lactostar auto milk analyzer (Funke-Gerber, Berlin, Germany). The quantity of the individual minerals was measured by inductively coupled plasma optical emission spectroscopy (ICP-OES; Optima 5300DV, Perkin Elmer, Shelton, USA). Five milliliter sub-boiled HNO3 (65 to 70%; VWR International, Radnor, PA, USA) were added to 1 to 2.5 mL of milk. Then it was heated at 250°C for 15 min in an Ultraclave (Milestone microwave Ultraclave III, Sorisole, Italy). After heating, milli-Q water was added to make a final volume of 50 mL, and analyzed. A standard curve of each mineral was used for quantification.
Statistical analysis
All the analyses were run in triplicate. The one way analysis of variance (ANOVA) and mean separation (Tukey’s test) were done by Minitab 16 (Minitab Ltd., Brandon Court, Coventry, UK).
RESULTS
Protein composition and types, casein micelle size, naturally occurring peptides and free amino acids
The results on protein composition and types and CMS are given in Table 1. The content of TP and CN were 37.80 and 28.83 g/kg milk, respectively in RCC milk and this was higher than others milk. The highest CN number was 77.12 in B milk and in RCC milk it was 76.28. The lowest CN:WP ratio was 2.1 in HX and highest in B milk was 3.37. The αs1-CN content did not vary among the different milk. However, the content of αs2-CN in B milk was 2.3 times of RCC milk. And the κ-CN content in B milk was very high, – almost double of the cow’s milk. Milk of IC and RCC were found much higher in β-CN content compared to B and HX milk. Proportionate amount of αs1-, β- and κ-CN were found higher in RCC milk. In WP, highest content of α-LA was found in B milk but the β-Lg content was almost half of all the cow’s milk. The largest CMS was 188.73 nm and smallest was 157.07 nm, found in B and IC milk, respectively.
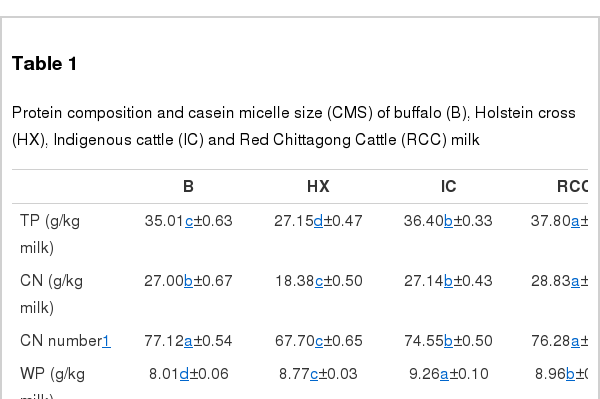
Protein composition and casein micelle size (CMS) of buffalo (B), Holstein cross (HX), Indigenous cattle (IC) and Red Chittagong Cattle (RCC) milk
The present study has identified many NOP – 45, 79, 19 and 12 in B, HX, IC and RCC milk, respectively. Four peptides – FPIIV, GPVRGPFPII, EPVLGPVRGPFP and EPVLGPVRGPFPII from β-CN were identified in common to all the four types of milk. Only those peptides that have been previously reported bioactive sequence (s) (matched with peptides reviewed by Meisel, 1998; Clare and Swaisgood, 2000; Silva and Malcata, 2005) are listed in Table 2. Some of the bioactive fragments like TTMPLW, GPVRGPFPIIV, KVLPVPQ, and YQEPVL were detected as a part of several different larger peptides.
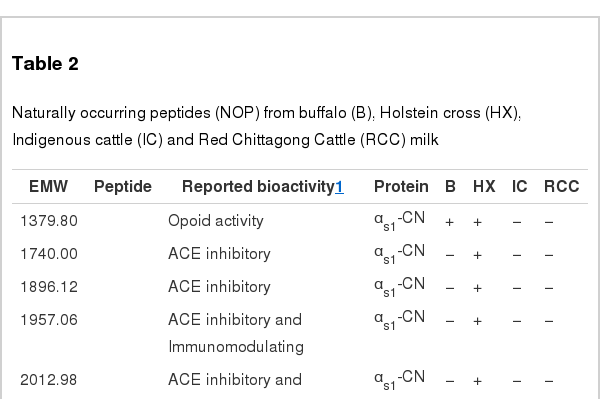
Naturally occurring peptides (NOP) from buffalo (B), Holstein cross (HX), Indigenous cattle (IC) and Red Chittagong Cattle (RCC) milk
Table 3 summarizes the content of FAA in the milk. All the amino acids varied significantly except glutamic acid and asparagine. Highest concentration of all the amino acids was found in B milk. The milk of HX did not differ from B in leucine, valine, lysine, methionine, phenylalanine, arginine, and tyrosine content. The IC milk shared the higher content of threonine, alanine and aspartic acid with B milk, whereas, RCC and B milk contained approximately the same amount of valine, threonine, alanine, aspartic, and serine.
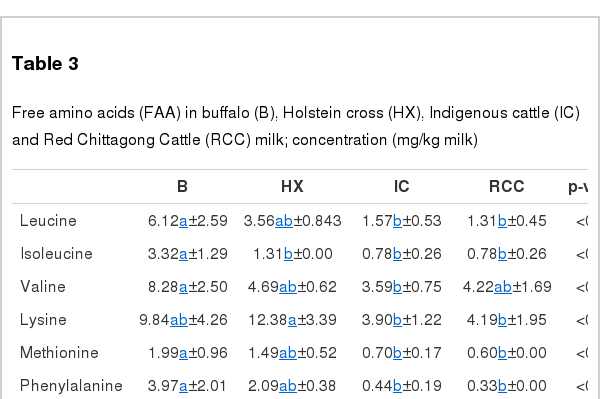
Free amino acids (FAA) in buffalo (B), Holstein cross (HX), Indigenous cattle (IC) and Red Chittagong Cattle (RCC) milk; concentration (mg/kg milk)
Fat, milk fat globule size and fatty acid composition in neutral lipids, free fatty acids and polar lipids
The results on fat (g/kg milk) and FA composition (% of total FA in each lipid class) are presented in Table 4. The fat content varied significantly among all the milk. The highest fat content was 58.40 g/kg in B and lowest was 37.13 g/kg in HX milk.

Fat content (g/kg milk) and fatty acid composition (% of total fatty acid in each class of lipid) in neutral lipid (NL), free fatty acids (FFA) and polar lipid (PL) of milk from buffalo (B), Holstein cross (HX), Indigenous cattle (IC) and Red Chittagong Cattle (RCC)
In NL, among all the saturated FA (SFA) only C20:0 showed non-significant variation. The B milk had the highest C4:0 (1.43%), C15:0 (2.04%), C17:0 (1.54%), and C18:0 (16.72%) content. All the cow’s milk was found similar in their C6:0 and C8:0 content and more than in B milk. The HX and B milk did not differ in their C17:0 content. Milk of IC had the highest C12:0, C14:0, and C16:0. In respect of all the SFA, IC, and RCC milk were found similar. In addition to C6:0 and C8:0, HX milk was also found similar to RCC milk in C4:0, C14:0 and C16:0 content. And finally all the cow’s milk was found similar in their total SFA content, more than the B milk. In USFA, only C10:1n-6 cis did not differ significantly. Milk from B showed the maximum content of all USFA (except C14:1n-5 cis) and of total USFA. The content of C18:1n-9 cis, C18:2n-6 cis, C18:1n-7 trans, C18:2n-7 trans, and total USFA in B milk was 31.52%, 0.90%, 1.22%, 0.48%, and 36.48%, respectively. Similarities in all the cow’s milk were found in their C18:1n-9 cis, C18:2n-6 cis, C18:1n-7 trans and total USFA content.
All three cow’s milk FFA fraction did not vary in C10:0, C12:0 and C14:0 content, however, higher than B milk. The content of C14:1n-5 cis was low in B and HX milk compared to IC and RCC.
In the PL fraction, B milk had the lowest C14:0 and C16:0 and the highest C18:0. As compared to the cows’ milk, B milk also had lower total SFA (40.86%) and higher total USFA (59.13%).
The results on MFGS (μm) are summarized in Table 5. The mean MFGS (d4,3) was largest in B (12.29 μm) and smallest in RCC (3.41 μm) milk. Compared to the cows’ milk, all through the distribution (d0.1…0.9), B milk had significantly larger MFGS (except at d0.1).
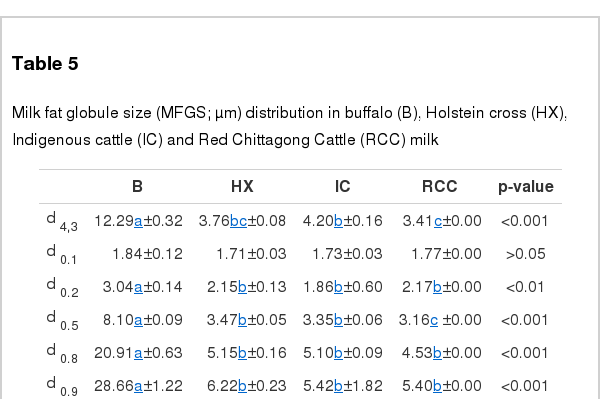
Milk fat globule size (MFGS; μm) distribution in buffalo (B), Holstein cross (HX), Indigenous cattle (IC) and Red Chittagong Cattle (RCC) milk
Content of carbohydrates and minerals
Table 6 represents the results of the carbohydrates and mineral composition. All the four different milk types showed significant difference in their lactose content. The order of lactose content was RCC>IC>B>HX. Glucose content was found similar in B, IC, and RCC milk and significantly more than in HX milk. The IC and RCC milk were found similar and intermediate in their galactose content while B had the maximum galactose and minimum was in HX milk.

Content of carbohydrates and minerals in buffalo (B), Holstein cross (HX), Indigenous cattle (IC) and Red Chittagong Cattle (RCC) milk
Total mineral and all individual mineral content also varied significantly. The highest total mineral content was 8.53 g/kg milk found in RCC milk and IC milk was similar to it. The B milk was found rich in Ca content (1.48 g/kg milk) and RCC in P content (1.14 g/kg milk). But the Ca:P ratio was higher in B milk followed by HX>RCC>IC. Compared to others, B milk was also found rich in Mg and Mn content.
DISCUSSION
Protein composition and types, casein micelle size, naturally occurring peptides and free amino acids
The proteins, CN content and type and CMS in milk are very important for coagulation properties and cheese production. The TP content in B milk was comparable to the observation of Khan et al. (2007) who reported 37.67 g/kg crude protein in water buffalo milk. Islam et al. (2008) studied the quality of milk from different genotypes and reported 3.11% and 4.06% crude protein in HX and RCC milk, respectively, which is comparabale with the present study. The CN number in the present study is about 5 to 15% less than the results on Dutch dairy milk obtained by Heck et al. (2009). Higher CN number is favorable for cheese yield. Milk of B and RCC had higher CN number than HX and IC, where HX was exceptional low.
The content of individual CNs was also varied, except αs1-CN. The differences in CN composition is mainly due to the genotypic differences of the animals as described by Farrell Jr et al. (2004). Different genetic variants showed significant differences in milk production trait, milk composition, protein composition and technological properties. The average αs1:αs2:β:κ-CN is generally recorded as 4:1:4:1 and according to Barlowska et al. (2011), this ratio is diverse. The diversity is related to genetic polymorphism, post translational modification, stage of lactation and feeding regime. The ratio reveals that RCC milk is exceptionally high in αs1- and β-CN content. Higher αs1-CN is related with delayed milk coagulation time and increased curd firming time. Whereas, increased β-CN content decreases the milk coagulation time and curd firming time (Bonfatti et al., 2013). However, according to St-Gelais and Hache (2005), rennet coagulation properties are related not only to CN content but also to the proportion of β-CN and αs-CN present in milk. They conclude that milk with relatively high proportion of β-CN showed poorer coagulation properties. On the other hand, the presence of more κ-CN is generally related with improved coagulation properties. But Bonfatti et al. (2013) found low rennet coagulation time (RCT) in milk with low κ-CN and the glycosylated κ-CN had unfavorable effects on RCT. According to Addeo et al. (1977), 40% of B milk κ-CN is carbohydrate free while it is only 25% in cow’s milk. So, considering all the CNs, B milk should have better coagulation properties than the cows’ milk. And this was confirmed in a preliminary study using formagraph (results not shown).
In our study the CMS was smallest in IC milk and largest in B milk. According to Glantz et al. (2010) smaller CMS gives stronger gels. Milk that contains more κ-CN is reported to have smaller CMS, however, this was not shown in our study.
Milk protein is also well known for its nutritional importance. In the context of TP and CN content, RCC and IC milk were higher than B and HX milk. The general ratio of CN and WP in cow’s milk is 4:1 (Lara-Villoslada et al., 2005). In our results the CN:WP ratio varied greatly, showing the highest ratio in B and lowest in HX milk. As compared to Heck et al. (2009) and Farrell Jr et al. (2004), it seems to be a genotypic variation. A higher proportion of WP is nutritionally favorable, however, immunogenically unfavorable, especially with regard to β-Lg. The lowest content of β-Lg in B milk, almost half of the others milk, could makes it more preferable for the individuals with milk allergy. In addition, HX milk is preferable for those who needs a proportionately low CN milk, like babies, since the content is more human like.
The present study has identified many NOP with previously reported bioactive sequence (s) for ACE-inhibitory, opoid, immunomodulatory and mineral binding effects from in vitro studies. Milk from HX was high in ACE-inhibitory peptides that prevent the formation of angiotensin-II (vasoconstrictor) and hydrolysis of bradykinin (vasodilator). Opoid peptide has similarities to opium and acts as opoid receptor ligands with agonistic activity. We found B milk rich in opoid peptide sequences. Immunomodulatory peptides stimulate the immunity and HX contained more of these peptides than others. Mineral binding peptides are caseinophospho-peptides that act as the biocarriers of divalent cations; in this study HX milk was rich in this. The peptide chain of identified NOP is longer compared to previously reported bioactive fragments. It may enhance the delivery of bioactive peptides to the target organs, suggested by Hayes et al. (2007). Accordingly larger peptides may be digested in the gastrointestinal tract and release a smaller part that may act as a bioactive peptide.
The concentration of all of the FAA, which can easily be absorbed, was higher in B milk than others milk. Beside participating in the protein syntheis, they also exert some important physiological roles e.g. γ-amino butyric acid (GABA) acts in neurotransmission. Moreover, they may also have importance in the sensory quality of milk as Drake et al. (2007) reported the contribution of glutamic acid to the umami taste in cheese.
Fat, milk fat globule size and fatty acid composition in neutral lipids, free fatty acids and polar lipids
Even though the B milk fat content was less than 72.67 g/kg as reported by Khan et al. (2007) in the water buffalo, our results are within the range of 3.37 to 14.42% reported by Meena et al. (2007). And compared to others milk, HX had 5 to 21 g less fat in milk. It’s higher milk production than B, IC, and RCC may contribute to this variation.
Feed and the microbial activity are two main sources of the milk FA variation. In addition, there are a number of factors like – animal status, feeding regime etc. that may influence the FA composition. The animals under the present study are of different genotype and only RCC and IC received the same feeding. In the NL, FFA, and PL fractions of all the milk of present study, C16:0 was the dominating FA followed by C18:0 and C14:0. We observed a lower concentration of C4:0 in all milk. Timmen and Patton (1988) reported that the underfeeding of animals depressed the production of C4:0 and C16:0 compensated by increased C18:1n-9 cis. Compared to Menard et al. (2010), our results showed lower amounts of C4:0 and C16:0 (only in B milk) and higher C18:1n-9 cis. Lower concentration of C4:0–C10:0 indicates the animals were underfed or in negative energy balance (Van Knegsel et al., 2005). However, Devle et al. (2012) and Menard et al. (2010) also reported a lower concentration of C4:0–C8:0 in Norwegian cow and Mediterranean buffalo milk, respectively.
The variation in C15:0 and C17:0 indicates the variation in ruminal activity of buffalo and cow as they are synthesized by the rumen bacterial flora. But Heck et al. (2012) suggested that a part of these two FAs derives from the blood, meaning that the influence of animal’s diet also is of importance. Similarities between IC and RCC also agree with this as they were on the same diet. But HX milk had similarities with B milk in C17:0 though on different diets. Half of the C16:0 derives from de novo synthesis in the mammary gland and the rest half along with C18:0 originates from dietary lipids and mobilization of adipose tissue. So, the quality of the feed and the body condition score of the lactating animal is important regarding these two FAs.
Both the conjugated linoleic acid (CLA) isomer (C18:2n-7 trans) and precursor (C18:1n-7 trans) were higher in B milk. Similarly the ω6 (C18:2n-6 cis, also a precursor of CLA) FA was also higher in B and we were able to detect ω3 (C18:3n-3 cis) only in B milk. In FFA content, B was found poorer than the cow’s milk. And to best of our knowledge, we did not find any published article that describes the individual FFA of buffalo and cow’s milk. Unlike Menard et al. (2010), B milk contained more total USFA and less total SFA in NL and PL compared to cow’s milk and no such differences were observed in FFA. All through the FA composition, the similarities between IC and RCC indicate the importance of feed in FA composition as they are of different genotype. And their similarities with HX might be indicative for the genotypic importance in FA composition. Menard et al. (2010) maintained cow and buffalo on same diet and management. But they found significant differences in fatty acid composition (except C4:0, C6:0, C18:1 t10 and C18:1 t12); revealing the importance of genotype and ruminal activity in fatty acid composition. Being of different genotype and fed differently, RCC milk was found similar to B milk in C16:1n-7 cis and C18:2n-7 trans content in NL fraction and few others in FFA and PL fractions.
In general the MFGS varies from 1 to 20 μm in diameter. Along with the fat content, season, number and stage of lactation are the main factors influencing the MFGS. The B milk showed the largest MFGS in the present study. This may be because of higher fat content as the mammary gland has a limited capacity of producing fat globule membrane material. So the fat droplets seem to grow and become larger before they are covered with the membrane in the secretory apical membrane. However, Menard et al. (2010) observed a smaller diameter (5.18 μm d4,3) in buffalo milk with 73.4 g/kg fat compared to our results – 12.29 μm d4,3 in milk with 58.40 g/kg fat. Schafberg et al. (2007) suggested a difference between buffalo and Bos Taurus with respect to the milk fat globule synthesis in their mammary gland. The MFGS of B milk also showed more variation throughout the size distribution and this is in agreement with Akhundov (1959). Menard et al. (2010) also reported more variation in buffalo MFGS than in the cow’s milk. And the cows’ MFGS d4,3 obtained from the present study is comparable with their results.
Carbohydrates and minerals content
The lactose content was 47.48 g/kg in B milk. This is similar to the report of Khan et al. (2007) who found 47.55 g/kg lactose in water buffalo milk. Hossain and Dev (2013) found 4.59% lactose in cow’s milk which is comparable with IC and HX milk in our study. However, RCC was a bit higher – containing 52.65 g/kg lactose. It is interesting to observe the differences between the concentration of glucose and galactose within the milk type. Because, to synthesize lactose, 1:1 glucose and galactose is required. The source of galactose is glucose and part of the galactose also participates in the biosynthesis of glycoproteins and glycolipids (Fox, 2009). This may be one of the possible reason of the presence of more galactose compared to glucose. In addition, α-LA is important in the regulation of the lactose synthesis; RCC was lowest in α-LA but highest in lactose content. The positive correlation between α-LA and lactose is at the end of the lactation (Farrell Jr et al., 2004). We used pooled samples having milk from animals of different stage of lactation. Among the sampled nineteen RCC cows, most of the cows were at early or mid lactation. There might be a threshhold of α-LA to influence the lactose synthesis and RCC may have above of the threshold.
The minerals content in all milk from the different animals is comparable with the report of Medhammar et al. (2012). In B milk, the amount of Ca was higher than the P content. However, Patino et al. (2007) reported more P than Ca in different buffalo breeds. Genotypic variation may be a matter of concern as Glantz et al. (2012) found more Ca and P in milk with β-CN A2 than β-CN A1, and the influence of κ-CN was A>B>E. Ariota et al. (2007) observed a strong correlation between fresh cheese yield and Ca and P content. They also found a negative relationship between Ca:P and rennet coagulation time and positive relationship between A30 and soluble Ca and P content. So, the B milk seems to have advantages in this respect compared to others. In B milk, Mg, Na, and K are comparabale with Patino et al. (2007) but Zn content was higher while Cu and Mn were lower. In HX milk, all the individual minerals were comparable with Medhammar et al. (2012). And IC and RCC milk were also found similar to that report except for Ca and P that were higher. Feeding and nutritional status of the animals may also strongly contribute to the variation among the animals. The variation can also be explained by breed differences and the differences in stage of lactation as reported by Patino et al. (2007).
CONCLUSIONS
All the animals showed considerable variation regarding the principal components in milk. In earlier studies, buffalo milk showed advantages compared to cow’s milk with regard to milk components. However, this study showed that Red Chittagong Cattle and Indigenous cattle milk were more favorable because of their higher true protein, casein, β-casein, lactose and total mineral content. Nevertheless, to select quality milk for curd based milk products (cheese and sweetmeats) depending on highest protein, casein, casein number, casein:whey protein, ratio of αs1-, αs2- β- and κ-casein and fat content, Red Chittagong Cattle and buffalo milk showed the best data. All the cow’s milk contained small casein micelles. But they had lower κ-casein and Ca:P than the buffalo milk, meaning that other factors may play a role in the micellar formation as well.
Buffalo and Red Chittagong Cattle milk should also be preferred from a nutritional point of view because of their high protein content and type, free amino acids, naturally occurring peptides, fat content, conjugated linoleic acid precursors and isomers, total unsaturated fatty acid, lactose, minerals, Ca, P, Mg, Mn and Zn. They were also low in αs1-casein and β-lactoglobulin, the two major milk allergen.
The Indigenous cattle milk was more or less similar to Red Chittagong Cattle milk regarding all most all the milk components. Milk of Holstein cross cows was found high in β-lactoglobulin, naturally occuring peptides and total saturated fatty acid.
This work may be regarded as a benchmark for future work on the Bangladeshi dairy cattle for milk and milk products. And the animal breeder should take into consideration the information on milk components before desgining a breeding policy to get higher milk production with desirable quality.
ACKNOWLEDGMENTS
The authors thank the Food and Health Programme, IKBM, NMBU, Norway for financing the laboratory work and the States Education Loan Fund (Lanekassen), Norway for financing the PhD student M. A. Islam. We are gratefull to the Department of Livestock Services (DLS), GOB, Farmgate, Dhaka, Bangladesh for allowing to take the milk samples from Bangladesh and Veterinary control in Norway to take those samples in Norway. We also extend our gratitude to Mr. Moznu Sarker, PKSF, Dhaka, Bangladesh for his kind help during the sampling in Bangladesh. Our thanks also to Ragnhild Aaboe Inglingstad and Hanne Marie Devle, IKBM, NMBU, Norway for their help in laboratory.


