Identification of Exonic Nucleotide Variants of the Thyroid Hormone Responsive Protein Gene Associated with Carcass Traits and Fatty Acid Composition in Korean Cattle
Article information
Abstract
The thyroid hormone responsive protein (THRSP) gene is a functional gene that can be used to indicate the fatty acid compositions. This study investigates the relationships of exonic single nucleotide polymorphisms (SNPs) in the THRSP gene and fatty acid composition of muscle fat and marbling score in the 612 Korean cattle. The relationships between fatty acid composition and eight SNPs in the THRSP gene (g.78 G>A, g.173 C>T, g.184 C>T, g.190 C>A, g.194 C>T, g.277 C>G, g.283 T>G and g.290 T>G) were investigated, and according to the results, two SNPs (g.78 G>A and g.184 C>T) in exon 1 were associated with fatty acid composition. The GG and CC genotypes of g.78 G>A and g.184 C>T had higher unsaturated fatty acid (UFA) and monounsaturated fatty acid (MUFA) content (p<0.05). In addition, the ht1*ht1 group (Val/Ala haplotype) in a linkage disequilibrium increased MUFAs and marbling scores for carcass traits (p<0.05). As a result, g.78 G>A and g.184 C>T had significantly relationships with UFAs and MUFAs. Two SNPs in the THRSP gene affected fatty acid composition, suggesting that GG and CC genotypes and the ht1*ht1 group (Val/Ala haplotype) can be markers to genetically improve the quality and flavor of beef.
INTRODUCTION
Beef quality depends not only on the marbling score but also on the fatty acid composition. The fatty acid composition of adipose tissue in livestock has been recognized as an important carcass trait influencing meat quality because a higher monounsaturated fatty acid (MUFA) concentration leads to a lower fat melting point, which affects the softness of fat and beef flavor (Melton et al., 1982; Yang et al., 1999). Beef with the most desirable flavor has lower percentages of saturated fatty acids (SFAs) and polyunsaturated fatty acids (PUFAs) and higher percentages of MUFAs in carcass fat (Dryden and Marchello, 1970; Westerling and Hedrick, 1979; Melton et al., 1982). In addition, the MUFA concentration has important implications for human health (Rudel et al., 1995).
Stearic acid (C18:0) is a primary determinant of fat hardness (Smith et al., 1998; Wood et al., 2004; Chung et al., 2006). Oleic acid (C18:1) is a major MUFA, accounting for the highest percentage of fatty acids in bovine adipose tissue, and is positively correlated with the marbling, flavor, and tenderness of beef and the softness of fat (Westerling and Hedrick, 1979; Kim et al., 2002; Lee et al., 2004; Smith et al., 2009). Therefore, genetic factors that enhance the conversion of stearic acid (C18:0) into oleic acid (C18:1) enhance the tenderness, marbling, and flavor of beef (Yang et al., 1999). As shown in Jenkins (1993), a majority of dietary fatty acids are chemically reduced by microorganisms in the rumen and absorbed as SFAs. However, it is known that diet also influences bovine fatty acid composition (Cabezas et al., 1965; Edwards et al., 1961). Zembayashi et al. (1995) demonstrated that the adipose tissue of Japanese Black cattle contains a higher proportion of MUFAs than that of Holstein, Japanese Brown cattle and Charolais. These results suggest that fatty acid composition may be controlled by genetic factors such as genes closely related to lipid synthesis and fatty acid metabolism (Narukami et al., 2011).
The thyroid hormone responsive protein (THRSP) gene encodes a nuclear protein, closely associated with the regulation of fatty acid synthesis in lipogenic tissue based on several studies of its tissue distribution and correlation with lipogenesis (Jump et al., 1985; Freake et al., 1986; Perez-Castillo et al., 1987). The THRSP has been reported to act at the transcription level to regulate genes that encode enzymes required for the synthesis of long-chain fatty acids (Cunningham et al., 1998). Knockout studies have reported THRSP null mice to show a marked deficiency in de novo lipogenesis and revealed that the THRSP may work in the cytoplasm by tethering the fatty acid synthase to the microtubule (Lafave et al., 2006).
Noteworthy is that the THRSP gene encodes a protein called Spot14 or S14. The adipose tissue and liver are predominant sites of S14 expression. In addition, the THRSP gene has been identified to be associated with de novo lipogenesis (Zhu et al., 2005). S14 is a protein with 150 amino acids, and it is abundantly expressed in lipogenic tissue and is regulated in a manner similar to that for other enzymes involved in fatty acid synthesis (Colbert et al., 2010). Therefore, this study was aimed to evaluate the associations between single nucleotide polymorphisms in the THRSP gene carcass traits and fatty acid composition in Korean cattle.
MATERIALS AND METHODS
Animals and phenotypic data
A total of 612 Korean cattle (known as Hanwoo in Korea), bred in Gyeungbuk, Korea, were considered in this study for data on genotypes and carcass traits. All feeding conditions for steers were controlled under the livestock management of the calving place (n = 14). The steers were the progeny of 10 sires. Carcass phenotypes and marbling scores were measured 24 h after slaughter. To measure carcass traits, the steers were dissected and samples were collected at the last rib and the first lumber vertebra according to the Animal Product Grading System of Korea. The steers were slaughtered at 941±72 days of age, and average carcass weight was 427.25 kg. Backfat thickness and marbling scores were measured or scored in the left carcass cut across the vertebra between the last thoracic vertebra and the first lumbar vertebra. The degree of marbling was scored from 1 (trace) to 9 (very abundant) according to the Korean Beef Marbling Standard, in which the higher the score, the more abundant the intramuscular fat, and the mean was 5.39 (Table 1). Genomic DNA was extracted from the m. longissimus dorsi muscle by using the COSMO GENETECH kit (COSMO Co, Ltd., Seoul, Korea).
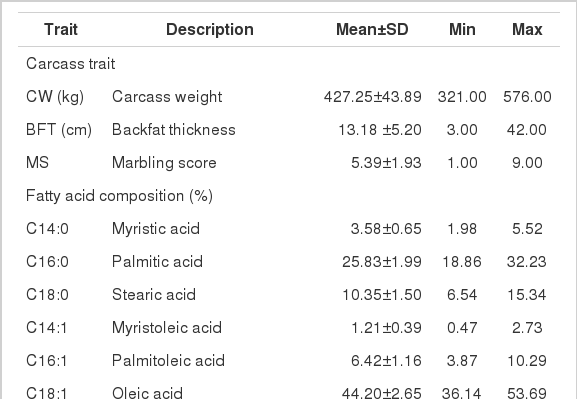
Means and standard deviations for carcass traits and fatty acid composition in Korean cattle
According to Folch et al. (1957), total lipids were extracted from approximately 500 mg of the m. longissimus dorsi muscle by using chloroform: methanol (2:1, vol/vol) and then methylated with sodium methylate by following O’Keefe et al. (1968). Samples were filtered through a filter paper in a water bath (40°C). The filtrate was mixed with distilled water, from which the layer of methanol and water was removed. Chloroform and lipid layers were removed using nitrogen gas. The samples were then treated with BF-3 methanol (14%) and subjected to trans-methylation at 65°C. Fatty acid contents was analyzed by gas-chromatography (PerkinElmer, Inc., Waltham, MA, USA), and fatty acids that were analyzed included myristic acid, palmitic acid, stearic acid, myristoleic acid, palmitoleic acid, oleic acid, linoleic acid, and linolenic acid. The compositions and functions of fatty acids were used as phenotypes in the analysis of genetic relationship (Table 1).
Single nucleotide polymorphism genotyping
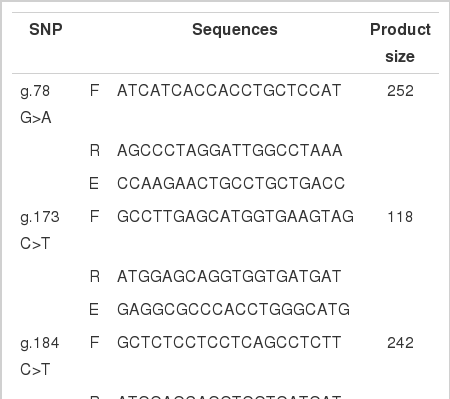
Exonic SNPs in the THRSP gene were selected based on the nucleotide sequence of the bovine THRSP gene in GenBank (Accession No. AC_000186.1), and selected SNPs were subjected to a preliminary analysis. For the eight SNPs, primers for amplification and extension were designed for single-base extension by using PRIMER 3.0, a web-based software package (Supplementary Table 1).
Primer extension reactions were performed using the SNaPshot dNTP Primer Extension Kit (Applied Biosystems, Foster City, CA, USA). For primer extension, exonuclase 1 and shrimp alkaline phosphatase were added to the reaction mixtures. Samples were cultured at 37°C for 1 h and then inactivated at 72°C for 15 min. Polymerase chain reaction products were analyzed based on the Genescan 120 LIZ standard and HiDi formamide (Applied Biosystems, Foster City, CA, USA), followed by denaturation at 95°C for 5 min. Electrophoresis was performed using the ABI PRISM 3130XL Genetic Analyzer and analyzed using GeneMapper v.4.0 (Applied Biosystems, USA).
Statistical analysis
The Hardy-Weinberg equilibrium (HWE) was tested for each locus by comparing expected and observed genotype frequencies through the Chi-square statistic. Associations between phenotypes (carcass traits and fatty acid composition) and individual SNPs in the 612 samples were analyzed based on a mixed analysis of covariance linear model using SPSS v19.0 (SPSS Inc., Chicago, IL, USA). The linear model used was as follows:
where Yijk is the phenotypic observations, μ is the overall mean of each trait, Si is the random effect of a sire, Pj is the fixed effect of the calving place (14 classes), Gk is the fixed effect of the SNP genotype, β is a regression coefficient, age is a covariate for age in days at slaughter, and eijk is a random residual. Significant differences in the mean value between different genotypes were calculated using Duncan’s multiple range test at p<0.05, and additive and dominance effects were estimated using the regression procedure in SAS 9.2.
This genetic association model was used for the analysis of haplotypes as well as individual SNPs by replacing the genotype effect with the haplotype effect. For the haplotype analysis, the linkage disequilibrium (LD) between SNP pairs was measured using D′ and r2. The HaploView software package was used in the LD analysis. Haplotypes were constructed using Haploviewer v4.2, and associations between haplotypes and phenotypes in a population of Korean cattle were analyzed. With this software package, the phase probability of each polymorphic site for all haplotypes was calculated for each individual.
RESULTS
All eight SNPs (g.78 G>A, g.173 C>T, g.184 C>T, g.190 C>A, g.194 C>T, g.277 C>G, g.283 T>G and g.290 T>G) located at the exon suggested by the National Center for Biotechnology Information were collected to identify association between SNPs in the THRSP gene and fatty acid composition. The exon 1 region was located at 33–485 bp in the genomic DNA of the 5,907 bp THRSP gene. According to a pair-wise LD analysis with the g.78 G>A and g.184 C>T SNPs, the THRSP gene could be conducted in the LD block, the 107 bp region spanning from exon 1.
According to a preliminary analysis of the genotype frequency of the eight SNPs in the exon of the THRSP gene, there were only two polymorphic loci in Korean cattle. This outcome was statistically analyzed to determine genotypic and allelic frequency, heterozygote, Minor allele frequency (MAF) and HWE. The genetic frequency of two polymorphic SNPs (g.78 G>A and g.184 C>T) were calculated based on Mendel’s law of segregation, and the resulting values were 0.361 and 0.481, respectively. The genotype frequency (%) of g.78 G>A was 59.3, 34.0, and 6.7 for GG, GA, and AA, respectively, and that of g.184 C>T was 17.3, 46.0, and 36.7 for CC, CT, and TT, respectively. MAF was less than 0.100 and segregation was not well observed based on the LD analysis, which reduced analysis accuracy (Eberle et al., 2006; Lee et al., 2006). Based on this analysis, these two selected SNPs had values of 0.237 and 0.404 respectively, exceeding 0.100, and their genotypes did not deviate from the HWE (p>0.05).
Previous studies have demonstrated significant effect of unsaturated fatty acid (UFA) (Alexander et al., 2007) and MUFA (Hoashi et al., 2008) content on the flavor of beef. Based on these studies, the composition of fatty acids and the carcass phenotype were analyzed for a single genotype in Korean cattle (Table 2). This analysis revealed significant differences depending on the SNP of the THRSP gene.
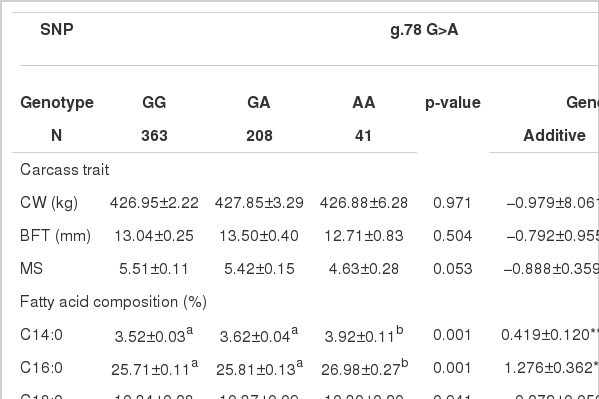
Effects of two polymorphic SNPs in the THRSP gene on carcass traits and fatty acids composition
Carcass traits and two SNPs (g.78 G>A and g.184 C>T) were not related in this sample of Korean cattle. In addition, stearic acid (C18:0), myristoleic acid (C14:1) and palmitoleic acid (C16:1) were not related to the SNPs. However, for UFAs, cattle with the GG genotype of g.78 G>A and the CC genotype of g.184 C>T had the highest oleic acid content of 44.47% and 45.60% respectively, and MUFA content of 53.23% and 54.46%, respectively, in contrast to the content of SFA (p<0.001).
Based on the LD of the haplotype block, two representative SNPs located within exon 1 in the THRSP gene based on Haploviewer v4.2 were determined through a frequency analysis. The haplotype frequency of Ht1 (Valnine [GTC] of g.78 G>A and Alanine [GCG] of the g.184 C>T combination) was 0.404012; that of Ht2 (Valnine [GTC] of g.78 G>A and Valnine [GTG] of the g.184 C>T combination) was 0.359007; and that of Ht3 (Isoleucine [ATC] of g.78 G>A and Valnine [GTG] of the g.184 C>T combination) was 0.236981.
The haplotype block included g.78 G>A and g.184 C>T in exon 1. Haplotypic associations of blocks were found in fatty acid composition (p<0.05, Table 3). In addition, the haplotypes were further associated with marbling score (p<0.025), but not with carcass weight and back fat thickness (p>0.05, Table 3) as shown in the single locus analysis.
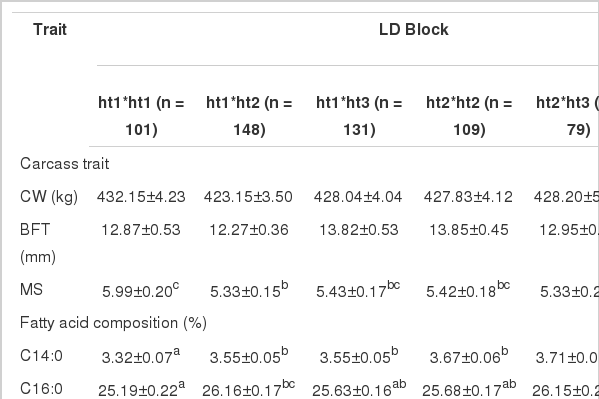
Haplotype effects of polymorphic SNPs in the THRSP gene on carcass traits and fatty acids composition
DISCUSSION
In this study, the relationships between exonic SNPs of THRSP gene, fatty acids, and carcass traits were examined for Korean cattle. As shown in Table 2, the two selected SNPs had significant relationships with oleic acid and MUFAs. In addition, the C187T (A51V) SNP was related to the tenderness and water holding capacity (WHC) of Qinchuan cattle. According to the multi-comparison results, tenderness was significantly higher for the CC genotype than for CT (p<0.05), and the WHC of TT was significantly higher than that of CT (p<0.05) (Zhang et al., 2009). The THRSP gene has consistently been found to be highly-correlated with marbling content in breeds widely known to possess an extremely high level of capacity for marbling such as Japanese Black or Wagyu (Wang et al., 2005; Wang et al., 2009).
On the other hand, the C187T SNP associated with increased fat yield as was shown by the T allele of THRSP in Italian Brown cattle (Mancini et al., 2013). The inconsistency between these findings and the results of the present study can be explained by the use of different breeds. Also, Saatchi et al. (2013) reported that THRSP genotypes of Illumina 54K bovine SNPchip significantly affected the C14:0, C14:1, C16:0, C16:1, C18:0 and cis-9 C18:1 fatty acids in Angus. The SNPs in Saatchi et al. (2013) studied are located in the part of the intron in the THRSP gene, which is different from the positions of the two SNPs in the present study, and this may explain the slightly inconsistent results. However, there is some consistency in that each SNP in the THRSP gene had a relationship not only with fatty acids but also with the marbling score.
The LD coefficients (r2) between individual SNPs, which reached the 5% level of genome-wide significance for single-marker associations, was calculated to assess the LD, and haplotype blocks were identified using the so-called “four-gamete rule” (Wang et al., 2002). In the four-gamete rule approach, the population frequency of four possible two-marker haplotypes is computed. If all four are observed with the frequency of at least 0.01, then recombination is deemed to have taken place. Blocks are then formed by consecutive markers where only three gametes are observed. In this study, this analysis was conducted using Haploviewer v4.2 (Barret et al., 2005).
A powerful LD was observed between g.78 G>A and g.184 C>T. As shown in Table 2, the two SNPs had no effect on the marbling score (p>0.05) based on the single locus analysis. However, according to Table 3, the haplotype had a significantly effect on the marbling score (p<0.05), and the contents were higher than the single locus analysis. The genotype of the ht1*ht1 group (Val/Ala haplotype) had a significantly greater effect on the marbling score than other genotypes. The genotype of the ht3*ht3 group (Iso/Val haplotype) was found to be 4.18, which had the lowest significant effect on the marbling score. No haplotypic effects (p>0.05) were detected on the contents of stearic acid (C18:0), myristoleic acid (C14:1) and palmitoleic acid (C16:1), as were the single SNP genotypes.
The highest oleic acid (C18:1) content was found for the genotype of the ht1*ht1 group (Val/Ala haplotype) (45.80%, p<0.001). In addition, the highest MUFA and linolenic acid (C18:2n3; omega3) content was found for the genotype of the ht1*ht1 group (Val/Ala haplotype) (54.65% and 0.42%, respectively). On the other hand, SFA content was relatively low in the genotype of the ht1*ht1 group (Val/Ala haplotype) and higher in genotype of the ht3*ht3 group (Iso/Val haplotype) (p<0.05).
Table 2 compares the effects of single genotypes. The highest (45.60%) oleic acid (C18:1) content was observed in the CC genotype of g.184 C>T, and the lowest (41.87%) content, in the AA genotype of g.78 G>A. On the other hand, the genotypes of the ht1*ht1 group (Val/Ala haplotype) and ht3*ht3 group (Iso/Val haplotype) groups showed oleic acid (C18:0) content of 45.80% and 41.59%, respectively. In addition, the largest difference in MUFA content was 0.19% between the genotype of the ht1*ht1 group (Val/Ala haplotype) and the CC genotype of g.184 C>T for the single genotype. Further, the smallest difference in MUFA content was 0.32% between the ht3*ht3 group (Iso/Val haplotype) and the AA genotype of g.78 G>A for the single genotype. The results for linolenic acid (C18:2n3; omega-3) content are similar to those for oleic acid (C18:0) and MUFA content. However, linoleic acid (C18:2n6; omega-6) content provided opposite results. These results imply that the strong LD between SNPs can be attributed to relationships between genes that can influence a combination of multiple variations, not a single variation.
Previous studies have found that the THRSP gene encodes a protein called Spot14 or S14 (Zhu et al., 2005). S14 is expressed only in lipogenic tissue, and the S14 mRNA levels are strongly correlated the lipogenic rate for each type of tissue (Jump et al., 1985). The SNPs may change their function by producing missense codons. The S14 region is located in the 43 to 495 bp coding sequence of the 1,404 bp THRSP gene. In this study, two selected SNPs were nonsynonymous. The sequence of g.78 G>A, was substituted by ATC, which changed the codon for valine to isoleucine. In addition, the SNP g.184 C>T changed the GCG codon to GTG, which changed the amino acid from valine to alanine. Therefore, the selected SNPs were associated with fatty acid synthesis and composition and located in the THRSP gene sequence.
Harvatine and Bauman. (2006) reported that conjugated linoleic acid (omega-6) inhibits S14 gene expression in bovine mammary glands. Trans-10, cis-12 CLA is often referred to as having antiobesity effects because of its ability to reduce body fat accretion in several species (Wang et al., 2004). In addition, clinical studies have shown that long-chain omega-3 PUFAs (n-3 PUFA) have beneficial effects on human health and that high levels of n-6 PUFAs in humans are closely related to certain diseases such as cancer, cardiovascular disease, and various mental disorders (Reidiger et al., 2009). As shown in Table 3, the lowest linoleic acid content and the highest oleic acid and MUFA content in the ht1*ht1 group (Val/Ala haplotype). This indicates that the selected SNPs were associated with fatty acid synthesis and composition because the SNPs led to codon changes in the THRSP gene, altering the S14 protein.
The results suggest that an increase in the homozygous genotype with the ht1*ht1 group (Val/Ala haplotype) at g.78 G>A and g.184 C>T may genetically improve the quality of beef by increasing UFA content and intramuscular marbling scores. The simultaneous use of multiple markers may accelerate genetic improvements through additive and/or epistatic effects, as demonstrated in Ryu et al. (2012).
In conclusion, Korean cattle with the individual genotype of GG or CC at the exonic SNP of g.78 G>A and g.184 C>T in the THRSP gene showed high MUFA content and low SFA content. In addition, this genotype showed higher marbling scores. These individual SNPs and their haplotypes may be important genetic targets for improving beef quality, which should benefit the Korean cattle industry.
Information of primer sequences of SNPs on the THRSP gene in Korean cattle
ACKNOWLEDGMENTS
This research was supported by the Yeungnam University research grants in 2013.