Genetic Relationships of Carcass Traits with Retail Cut Productivity of Hanwoo Cattle
Article information
Abstract
This study aimed to estimate genetic correlation between carcass grading and retail productivity traits and to estimate the correlated response on retail productivity traits through selection for carcass grading traits in order to assess the efficacy of indirect selection. Genetic parameters were estimated with the data from 4240 Hanwoo steers using mixed models, and phenotypes included carcass weight (CWT), back fat thickness (BFT), eye muscle area (EMA), marbling (MAR), and estimated lean yield percentage (ELP) as the carcass grading traits, and weight and portion of retail cuts (RCW and RCP), trimmed fats (TFW and TFP) and trimmed bones (TBW and TBP) as the lean productivity traits. The CWT had positive genetic correlations with RCW (0.95) and TFW (0.73), but its genetic correlation with RCP was negligible (0.02). The BFT was negatively correlated with RCP (−0.63), but positively correlated with TFW and TFP (0.77 and 0.70). Genetic correlations of MAR with TFW and TFP were low. Among the carcass grading traits, only EMA was positively correlated with both RCW (0.60) and RCP (0.72). The EMA had a relatively strong negative genetic correlation with TFW (−0.64). The genetic correlation coefficients of ELP with RCP, TFW, and TFP were 0.76, −0.90, and −0.82, respectively. These correlation coefficients suggested that the ELP and EMA might be favorable traits in regulating lean productivity of carcass.
INTRODUCTION
Hanwoo (Korean cattle) have been raised for at least 2000 years in the Korean Peninsula and were used as draught animals until the 1960s. Today, they are an important beef breed in Korea (Kim and Lee, 2000). The main aim of the beef cattle industry is to increase the lean meat yield. Therefore, genetic improvements that could increase the lean meat yield of retail cuts recovered from carcasses and decrease inedible fats and bones are a major goal for beef cattle breeders. Genetic variance explains a large amount of the variability in traits such as the weight and portion of retail cuts, and the amount of trimmed fat and bone, suggesting that direct selection could improve lean productivity. However, genetic parameters of meat traits of Hanwoo cattle have not been studied because genetic improvement through direct selection is impractical in Korea since commercial meat processing, such as de-boning, separating, and packing of lean products, is performed on a stock unit basis rather than a carcass basis. This results in a lack of information on each carcass. Indirect selection might be an alternative to direct selection if indicator traits have a strong genetic correlation with target traits. In addition, phenotypic data on indicator traits are easily measurable.
Several scientists have proposed methods to predict direct and indirect selection responses (Falconer, 1989; Bourdon, 2000). Grion et al. (2014) studied indirect selection responses in feed intake and weight gain through single-trait selection for feed efficiency in beef cattle.
We selected the following variables as candidate indicator traits to improve lean yield productivity: cold carcass weight (CWT), back fat thickness (BFT), eye-muscle area (EMA), marbling score (MAR), and estimated lean yield percentage (ELP). Retail cuts (retail cut weight [RCW] and retail cut percentage [RCP]), trimmed fats (trimmed fat weight [TFW] and trimmed fat percentage [TFP]), and the weight and portion of trimmed bone (trimmed bone weight [TBW] and trimmed bone percentage [TBP]) were selected as target traits. The candidate traits were measured in each carcass prior to being sold on the wholesale market in Korea. The response of target traits to indirect selection was assessed by examining the heritability of the candidate indicator traits and the target traits and the genetic correlation between these traits.
MATERIALS AND METHODS
Animals and traits
Data on carcass traits were collected from Hanwoo steers raised on private farms in Kangwon province, South Korea, for 48 months from January 2009 to December, 2012. They were castrated when they were approximately six months and fed commercial concentrate feed with rice straw during the fattening period. All the concentrate-finished steers were transported to same abattoir, which was a 1 h distance by truck from all the fattening farms. They were held overnight without feed at the abattoir and slaughtered the next morning. Slaughtering and carcass grading were carried out according to the standard industrial procedures recommended by the Korean government (the Ministry of Agriculture, Food and Rural Affairs, MAFRA, 2007).
After slaughtering, the carcasses were halved and chilled for another night in the chilling room. Both sides of the carcass were weighed, and the sum of the CWT (kg) was calculated. The left side of the carcass was cross-sectioned at a position between the last thoracic vertebra and the first lumbar vertebra. Official graders then calculated the EMA (cm2), BFT (mm), MAR, and ELP (%). The MAR was graded from 1 (poor) to 9 (best) according to the Korean Beef Marbling standard (MAFRA, 2007), The ELP was calculated according to the Korean Beef Grading Standard as follows.
After obtaining the measurements, the carcasses were transferred to an adjacent packing facility where each carcass was separated into 10 wholesale cuts: neck; rib loin; strip loin; tender loin; top round; outside round; blade and clod; rib; fore and hind shank; brisket, and flank. The cuts were processed into trimmed, boneless retail cuts by removing excessive inter-muscular fats and surface fats, except for rib bones, which were left in rib cuts (less than 5 mm cover fat was left on the retail cuts). All the retail cuts and trimmed bones were weighed and recorded per steer. The sums of the weights from 10 retail cuts and the TBW from each carcass were calculated. The TFW was calculated by deducing the RCW and the TBW from the CWT, as the fat weight was not measurable. The RCP, TBP, and TFP were expressed as a ratio of the CWT. The slaughtering and evaluation of the carcass parameters were conducted as described previously by Kim et al. (2010).
Data were collected on 5,756 steers over 4 years. Of these, the records of 4,240 steers aged 554 to 1,440 days with at least one known parent were selected for inclusion in the current study. None of the records contained unrealistic values presumed to be recording errors. Of the 4,240 steers in the final dataset, the identity of both parents was known in 4,193 steers, dam identity was known in 38 steers, and sire identity was known in 9 steers. Their phenotypic means are presented in Table 1.

Simple statistics for variables used in the study
Genetic parameter estimation
A pedigree file was built by tracing the ancestors back as far as possible using the data base of the Korean Animal Improvement Association. The pedigree included 11,521 Hanwoo with 430 sires and 6,851 dams. The numbers of sires and dams in the database with steer progeny were 101 and 3,613, respectively.
Genetic parameters were estimated with a mixed analytical model, which included slaughter year-month effect with 48 levels and linear and quadratic covariates effect for age at slaughter (days) as fixed effects. The genetic effect of animal additives and random residuals were included as random effects.
Variance components were estimated using the WOMBAT package (Meyer, 2006) and heritability and correlation coefficients were estimated using single- and two-trait analysis.
Selection response estimation
The direct selection response (RY) of each target trait to single trait direct selection of the target trait (Y), the indirect selection response (CRY) of each target trait to the selection of indicator traits (X), and the ratio of the indirect selection response to direct selection response (CRY/RY) were calculated by the following equations (Falconer, 1989).
where iY is the selection intensity of target trait Y, hY is the square root of the heritability of target trait Y, σAY is the genetic standard deviation of target trait Y, iX is the selection intensity of indicator trait X, hX is the square root of heritability of indicator trait X, rA is the genetic correlation coefficient of target trait Y with indicator trait X.
Assuming a selection intensity of 1 for all the selection-related traits (i.e. selection differential with a phenotype standard deviation of 1), the equation (3) can be simplified as follows.
RESULTS
Heritability of indicator and target traits
The heritability estimates for every trait using the single-trait analysis did not differ from those with the two-trait analysis (Table 2). The moderate heritability estimates for CWT, BFT, and EMA in this study were similar to the means of the heritability estimates in a review by Bertrand et al. (2001) who reported means of 0.39, 0.34, and 0.47 for CWT, BFT, and EMA, respectively.

Heritability estimates from single- and two-trait analyses of the traits studied
The heritability estimates for the six target traits were also moderate for 0.24 (TBP) and 0.48 (RCW). The heritability estimate of 0.48 for RCW in the present study is similar to the figure of 0.51 reported earlier by Rios-Utrera and Van Vleck (2004) in a review of 11 studies. The heritability estimate for TFW was 0.28, which is small compared to the mean of 0.52 reported by Rios-Utrera and Van Vleck (2004) based on an analysis of seven studies. The TBW was 0.37, which is smaller than that (0.43 to 0.75) reported in other studies (Koch et al., 1982; Gregory et al., 1995; Shackelford et al., 1995; Morris et al., 1999; Rios-Utrera et al., 2005; Pabiou et al., 2009).
In this study, the heritability estimate for ELP was 0.38, whereas it was 0.33 for RCP. These are relatively similar to figures reported in earlier studies. For example, Rios-Utrera and Van Vleck (2004) reported average heritability of 0.28 for ELP and 0.54 for RCP in their review. Shackelford et al. (1995) reported larger heritability estimate for RCP than ELP (0.67 and 0.52, respectively).
Genetic correlation of indicator traits with target traits
The genetic and phenotypic correlation coefficients of the five indicator traits with the six target traits are presented in Table 3. The genetic correlation coefficient of CWT with RCW and TFW was +0.95 and +0.73, respectively, and the genetic correlation coefficient of CWT with RCP was weak (+0.02). BFT had a negative correlation with RCP (−0.63) and a positive correlation with TFW and TFP (+0.77 and +0.70, respectively). Among the indicator traits, only EMA was positively correlated with both RCW and RCP (+0.60 and +0.72, respectively). In addition, EMA had a relatively strong negative genetic correlation with TFP (−0.64). The genetic correlation coefficient of MAR with TFW and TFP was low, which is economically favorable for beef production because selection to increase the MAR, an important factor in determining carcass price, would not be expected to have negative effects, such as decreasing retail cut productivity. In this study, the genetic correlation coefficient of ELP with RCP, TFW, and TFP was +0.76, −0.90, and −0.82, respectively. The correlation coefficients were larger than the phenotypic correlations (+0.54, −0.65, and −0.58, respectively). The large correlation coefficients indicate that the ELP equation can be used to predict the breeding value of TFW and TFP.
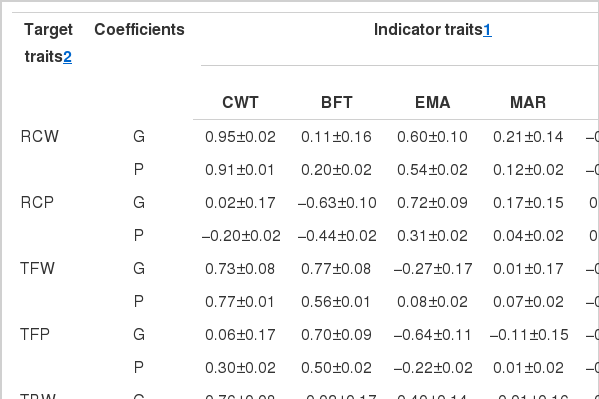
Genetic and phenotypic correlation coefficient between indicator traits and target traits
Selection responses of target traits
The indirect selection response of the target traits by selecting indicator traits (correlated response per generation) was compared to the direct selection responses of the target traits after one generation by selecting the target traits (expected genetic gain per generation). The indirect and direct selection responses and the ratio of the indirect to direct responses were estimated under the assumption of a selection intensity of 1 for all traits (Table 4). The direct selection response of RCW expected one generation after direct selection of RCW was 13.64 kg, and the indirect selection response of RCW by selecting CWT was 12.40 kg. Thus, the ratio of indirect selection to direct selection in this case was 91%.
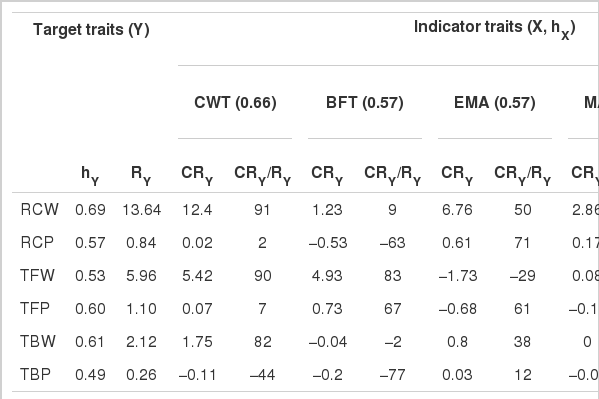
Direct and indirect selection responses of target traits
The direct selection response expected after one generation by the selection for increased RCP was 0.84%. The indirect selection response of RCP to single-trait selection for reduced BFT, increased EMA, or increased ELP was 0.53%, 0.61%, and 0.70%, respectively, which was 63%, 71%, and 83%, respectively, of the direct selection response expected.
The ratio of the indirect to direct selection response was high for TFW (105%) when the correlated response was estimated by selection for ELP. Thus, the genetic correlation between ELP and TFW was strong (−0.90). At the same time, the heritability of ELP was estimated to be larger than that of TFW (0.38 and 0.28, respectively).
The indicator traits BFT, EMA, and ELP appear to have a relatively strong correlated response to TFP, with ratios of indirect to direct selection responses that were 67%, 61%, and 85%, respectively. As a result, the correlated response of TFP to the selection of ELP was stronger than that to the selection of BFT or EMA.
DISCUSSION
Heritability estimates of indicator and target traits
Moderate to high heritability estimates for five indicator traits (CWT, BFT, EMA, MAR, and ELP) in current study, ranging from 0.33 (BFT) to 0.47 (MAR), concur with those from other recent studies on Hanwoo (Hwang et al., 2008; Won et al., 2010) and on other exotic beef breeds (Crews, et al., 2008; Oyama, 2011). Differences in breed and environment likely explain the variance. Variance may also be due to different definitions of ELP. In the current study, the phenotype of ELP was based on measurements of CWT, BFT, and EMA, and these parameters were measured at a position between the last thoracic vertebra and the first lumbar vertebra. In addition to these three parameters, Kim et al. (2006) included rib thickness in their equation and measured all the traits at the 6–7th rib section. Rios-Utrera et al. (2005) used CWT, BFT and EMA measurements at the 12th rib section, as well as the percentage of kidney, pelvic, and, heart fat, which was determined by subjective observation of the carcass. Crews and Kemp (2001) estimated ELP using measurements of CWT, BFT, and EMA at the 12–13th rib section.
Heritability estimates for the six target traits, RCW, RCP, TFW, TFP, TBW, and TBP, were also moderate, ranging from 0.24 (TBP) to 0.48 (RCW), suggesting that direct selection may be effective in improving these traits. However, the heritability estimates of RCP, TFP, and TBP in the present study are relatively small (0.33, 0.36, and 0.24, respectively) compared to those of other studies (Shackelford et al., 1994;1995; Wheleer et al., 1997; Splan et al., 1998; Rios-Utrera and Van Vleck, 2004). The relatively low estimates in the present study might be due to the different breeds studied, as shown by Gregory et al. (1995) and Reverter et al. (2000), where heritability estimates differed by breed. The source of the data (i.e., a commercial packing plant) could be another reason. Generally, in private packing plants in Korea, fat trimming level of retail cuts can vary, depending on purchaser demand, within a permissible limit. The differences of fat trimming may increase environmental variation in RCP, TFP, and TBP and thereby lower heritability estimates of these traits.
Comparing the heritability estimates of the target traits with those of the indicator traits demonstrated that the heritability estimates of the former were relatively low, especially for RCP, TFW, and TBP. The relatively low heritability estimates for the target traits can improve target traits by indirect selection, as shown in equation (4).
Genetic correlation of indicator traits with target traits
Among the five indicator traits, MAR was weakly correlated with the six target traits. However CWT, BFT, EMA and ELP showed a moderate to high genetic correlation with most of the target traits. The EMA exhibited a strong and positive genetic correlation with RCW and RCP and a negative genetic correlation with TFP. These favorable relationships suggest that EMA may be an efficient single indicator trait that can be used to increase the lean yield. Many other studies have reported favorable genetic relationships of EMA with RCW, RCP, and TFP (Koch et al., 1982; Gregory, et al., 1995; Wheleer et al., 1997; Rios-Utrera et al., 2005).
The estimates of the genetic correlation coefficient of ELP with RCP was strong and positive (+0.76) in this study. It is similar to that reported by Wheeler et al. (1997) who found an estimated genetic correlation of −0.76 between the USDA yield grade and actual product percentage. It is also similar to the estimate of +0.70 between the predicted lean meat percentage and the actual lean meat yield percentage of the 10–12th rib section of Canadian beef cattle reported by Bergen et al. (2006a). This result implies that the equation used in the present study is as good as United States Department of Agriculture (USDA) or Canadian equations at predicting actual RCP.
On the other hand, the absolute value of the genetic correlation coefficient of ELP was higher with TFW than with RCP in the present study. This differs somewhat to the results of Rios-Utrera et al. (2005) where the absolute values of both coefficients were the same. The higher correlation coefficient between ELP and TFW in the current study may be partly due to the greater weight assigned to the fat related trait, BFT, in the equation used to calculate ELP. Higher correlation of ELP with TFW than with RCP incurred larger correlated response in TFW (105%) than in RCP (83%) (Table 4).
Although BFT and MAR are both fat-related traits, their genetic correlations with TFW and TFP exhibited different patterns, with BFT showing strong genetic correlations with both TFW and TFP, MAR showing weak genetic correlation with TFW and TFP. This suggests that BFT and MAR may be under different genetic control. In fact, the results of a preliminary analysis in the current study revealed a negligible correlation (−0.05, data not shown) between BFT and MAR. This is in agreement with that of previous studies of Hanwoo by Choy et al. (2005), Hwang et al. (2008), Won et al. (2010), who reported figures of +0.09, +0.03, and +0.02, respectively. Bergen et al. (2006b) also reported low negative genetic correlation coefficients of −0.01 to −0.16 in a Canadian beef herd. However, many studies of exotic beef breeds have found moderate and positive genetic correlations of MAR or the intramuscular fat percentage with BFT (Gregory et al., 1994; Gregory et al., 1995; Reverter et al., 2000; Wheeler et al., 2004; Rios-Utrera et al., 2005) and moderate to high and positive correlations with TFW and/or TFP (Gregory et al., 1995; Wheleer et al., 1997; Rios-Utrera et al., 2005).
Selection responses of target traits
Falconer (1989) and Bourdon (2000) proposed using the correlated response of target traits to the selection of indicator traits, in addition to equations of correlated response, to improve important traits that are too difficult or expensive to measure or have low genetic variability in nature. Several studies have estimated direct and correlated responses of economically important traits of cattle (Koch, 1978; Koch et al., 1982; Bertrand et al., 2001; Grion et al., 2014). The results of all these studies showed that the correlated response can be employed to select indicator traits and improve target traits.
In this study, indirect selection responses were also identified that can likely be used to improve target traits. For example, selection for decreased BFT resulted in favorable and relatively large correlated responses in RCP, TFW, and TFP, selection for increased EMA led to relatively large correlated response in RCW, RCP, and TFP, and selection for increased ELP led to relatively large correlated responses in RCP, TFW, and TFP. In all cases, the ratio of the indirect to direct response was more than 50%. These results suggest that BFT, EMA, and ELP could be targeted to improve lean production. The ratio of the indirect to the direct selection response of RCP to selection for BFT in the current study was 63%, which is very similar to the 60% reported by Koch et al. (1982).
The ratio of the indirect to direct selection response might be employed to evaluate the efficiency of indirect selection. In this study, all the ratios, except in the case of TFW in response to selection for ELP, were less than 100%, indicating that indirect selection is less efficient than direct selection. Other studies also found that correlated responses to indirect selection were smaller than to direct selection responses in many cases (Marshall, 1994; Oliver et al, 2001; Toral et al., 2011). Although it is less efficient than direct selection, indirect selection may be a promising avenue of research in Korea because the measurement of retail cut yield is expensive, time-consuming and difficult to perform accurately.
CONCLUSION
This study showed that the selection of specific carcass traits led to a strong correlated response of traits related to lean productivity. In particular, the selection of EMA resulted in correlated favorable responses to both RCW and RCP, and the magnitudes of the responses were more than 50% of the direct selection response. The ELP was weakly correlated with RCW but exhibited a strong genetic correlation with RCP and a strongly negative correlation with TFW and TFP. Single-trait selection of ELP also resulted in relatively strong correlated responses. The findings indicate that among the five indicator traits measured, EMA or ELP seems to be the most favorable trait for selection to improve the lean productivity of Hanwoo cattle.