Effect of Soybean Meal and Soluble Starch on Biogenic Amine Production and Microbial Diversity Using In vitro Rumen Fermentation
Article information
Abstract
This study was conducted to investigate the effect of soybean meal (SM) and soluble starch (SS) on biogenic amine production and microbial diversity using in vitro ruminal fermentation. Treatments comprised of incubation of 2 g of mixture (expressed as 10 parts) containing different ratios of SM to SS as: 0:0, 10:0, 7:3, 5:5, 3:7, or 0:10. In vitro ruminal fermentation parameters were determined at 0, 12, 24, and 48 h of incubation while the biogenic amine and microbial diversity were determined at 48 h of incubation. Treatment with highest proportion of SM had higher (p<0.05) gas production than those with higher proportions of SS. Samples with higher proportion of SS resulted in lower pH than those with higher proportion of SM after 48 h of incubation. The largest change in NH3-N concentration from 0 to 48 h was observed on all SM while the smallest was observed on exclusive SS. Similarly, exclusive SS had the lowest NH3-N concentration among all groups after 24 h of incubation. Increasing methane (CH4) concentrations were observed with time, and CH4 concentrations were higher (p<0.05) with greater proportions of SM than SS. Balanced proportion of SM and SS had the highest (p<0.05) total volatile fatty acid (TVFA) while propionate was found highest in higher proportion of SS. Moreover, biogenic amine (BA) was higher (p<0.05) in samples containing greater proportions of SM. Histamines, amine index and total amines were highest in exclusive SM followed in sequence mixtures with increasing proportion of SS (and lowered proportion of SM) at 48 h of incubation. Nine dominant bands were identified by denaturing gradient gel electrophoresis (DGGE) and their identity ranged from 87% to 100% which were mostly isolated from rumen and feces. Bands R2 (uncultured bacterium clone RB-5E1) and R4 (uncultured rumen bacterium clone L7A_C10) bands were found in samples with higher proportions of SM while R3 (uncultured Firmicutes bacterium clone NI_52), R7 (Selenomonas sp. MCB2), R8 (Selenomonas ruminantium gene) and R9 (Selenomonas ruminantium strain LongY6) were found in samples with higher proportions of SS. Different feed ratios affect rumen fermentation in terms of pH, NH3-N, CH4, BA, volatile fatty acid and other metabolite concentrations and microbial diversity. Balanced protein and carbohydrate ratios are needed for rumen fermentation.
INTRODUCTION
Among the several feed ingredients used as animal feed over the years, two most commonly used are soybean meal (SM) and starch. Soybean meal has been a part of staple diet of high-producing dairy and beef cattle in developed countries. It is well degraded in the rumen and produces ammonia, amino acids, and peptides for ruminal microbial protein synthesis. Positive effects on feed intake, milk yield and milk protein content were observed in dairy cows when supplemented with SM (MacDonald et al., 1998). On the other hand, starch has been used as a source of carbohydrates and as a binder in calf milk replacers. It is a potentially entirely digestible in the rumen, but its solubility and its digestion rate can vary largely according to the source of starch and the technological process (Offner et al., 2003). However, it is also rapidly digested and does not promote chewing and saliva recycling and thus can induce ruminal acidosis. Consequently, its inclusion must be limited in ruminant diets.
Rumen bacteria require sources of nitrogen, minerals, vitamins, and growth factors for their growth; however, nitrogen and energy are required in the largest quantities and must be simultaneously available to stimulate rapid growth of bacteria. Both dietary and ruminal microbes are the sources of amines in ruminants. Thus, greater amounts of amines are available for absorption in ruminants than other species. Nevertheless, increased contents of dietary amines tend to reduce dry matter intake (Van Os et al., 1995), nitrogen degradability in the rumen of steers, particularly by the biogenic amine (BA) putrescine (Dawson and Mayne, 1997), have negative effects on visceral organs and meat quality (Fusi et al., 2004) of ruminants, hence it has been considered disadvantageous. Functional studies regarding the relationship between BA histamine concentration and hyperacidity during metabolic studies has been reported in non ruminants as well as in ruminants. In ruminants, the absorption of histamine leading to systemic acidosis is due to luminal acidity-induced ruminal epithelial damage and not histamine as reported Aschenbach and Gabel (2000). On the other hand, a close relationship between ruminal and histamine profiles in preacidotic stages induced by high concentrate diet fed to cattle was reported (Motoi et al., 1984), but the effects of various ratios and synchronization of protein and carbohydrates on rumen fermentation and their effects on rumen microbial diversity and BA production were not thoroughly investigated. Hence, this study was conducted to determine the effects of SM and soluble starch (SS) on BA and microbial diversity using in vitro ruminal fermentation.
MATERIALS AND METHODS
Two gram samples with different ratios of SM to SS were investigated through in vitro analysis. The treatments involved 2g mixtures of varying ratios of SM:SS as follows: Control (no substrate added), 10:0, 7:3, 5:5, 3:7, and 0:10 (expressed on 10 parts basis). Rumen fluid was collected from cannulated Holstein Friesian cattle, immediately strained through four layers of surgical gauze and placed in amber bottles with an oxygen free headspace. The collected rumen fluid was then sealed and immediately transported to the laboratory. Upon arrival in the laboratory, Russell and Van Soest (1984) buffer solution and rumen fluid were mixed at a 4:1 ratio and adjusted to pH 6.7. Next, 100 mL of prepared medium was dispensed into 160 mL serum bottles anaerobically under O2-free CO2 and incubated at 39°C and 90 rpm for 0, 12, 24, or 48 h. Total gas, pH, ammonia nitrogen (NH3-N), CH4, BA, volatile fatty acid (VFA) and other metabolites were analyzed after incubation.
Analyses for in vitro fermentation parameters
Total gas production at different stages was measured in each serum bottle using a sensor machine (Laurel Electronics, Inc., Costa Mesa, CA, USA), while pH was measured with a Pinnacle series M530p meter (Schott Instruments, Mainz, Germany) after uncapping each of the bottles. The NH3-N concentration (Chaney and Marbach (1962), VFA and other metabolites (high performance liquid chromatography (HPLC), Agilent Technologies 1200 series, Tokyo, Japan) (Tabaru et al. (1988) and Han et al. (2005) and expected CH4 production was calculated from the relationship between CH4 and short chain fatty acids (Demeyer and Van Nevel, 1975). Moreover, the expected CH4 production was determined from the relationship between CH4 and VFA (Gagen et al., 2012) using the following calculation:
The BA concentrations were analyzed by high performance liquid chromatography (HPLC). Amine separation was conducted using HPLC (Waters Ltd., Milford, MA, USA) and a Varian column (Pursuit×Rs 5u C-18 250×4.6 mm) (Varian Inc., Lake Forest, CA, USA) with a fluorescence detector (Waters 470, Waters Corporation, Milford, MA, USA) set to an excitation wavelength of 330 nm and an emission wavelength of 418 nm. Amine compounds were identified and quantified based on comparison with standard curves constructed from pure compounds (histamine, methylamine, ethylamine and tyramine). The assay sensitivity for each amine was calculated by extrapolation from a dilution curve and was taken as the lowest concentration required to produce a signal-to-noise ratio of 3:1 (Snyder et al., 1997). The chromatographic data used was generated by a Mellenium32 System (Waters Millipore, Milford, MA, USA) program. HPLC samples were centrifuged at 16,609×g for 5 min at 4°C and then filtered through 0.2 μm millipore filters. Next, samples and 6 N HCl were vortexed and hydrolyzed in an oven at 110°C for 24 h, after which an Eyela SB-1000 evaporator (Tokyo Rikakikai Co. Ltd., Tokyo, Japan) was used to remove the HCl. The majority of the solutions used for HPLC were obtained from Sigma-Aldrich (Seelze, Germany). Prior to sample analysis, a standard with an r2 between 0.98 and 1.0 was developed.
Fermented samples (preserved) were extracted using Wizard Genomic DNA Purification Kits (Promega, Madison, WI, USA), after which 16S rDNA PCR amplification was performed using the 27F and 1492R universal primers. Denaturing gradient gel electrophoresis (DGGE) was conducted using a D-Code Universal Mutation Detection System (BioRad, Hercules, CA, USA). To amplify the V3 region of the bacterial 16S rDNA amplicons, 341F-GC and 518R were used (Nubel et al., 1996). Amplicons of the V3 region of 16S rDNA were used for sequence-specific separation by DGGE as described by Muyzer and Smalla (1998). The DGGE gel was scanned at 400 dpi and similarity indices were calculated for pairs of DGGE profiles. The number of DGGE bands and similarity indices were calculated from the densitometric curves of the scanned DGGE profiles using the Molecular Analyst 1.12 software (BioRad, USA) with the Pearson product-moment correlation coefficient (Hane et al., 1993) from the Central Microbiology Laboratory of SCNU in Korea.
A total of eight purified dominant bands were sent to Macrogen, Seoul, Korea for sequencing, and the results were compared to sequences available in the GenBank database using the BLAST tool of the National Center for Biotechnology Information and EzTaxon.
Statistical analysis
Data were analyzed by analysis of variance using the general linear model for a randomized complete block design. All treatments were conducted in triplicate and Duncan’s Multiple Range Test was used to identify differences between specific treatments. A p<0.05 was considered to indicate statistical significance. All analyses were carried out using Statistical Analysis Systems (SAS) version 9.1 (2002).
RESULTS
Total gas production of samples containing different SM to SS ratios during in vitro fermentation for various incubation times are shown in Table 1. Total gas production increased as incubation time increased. Production in control (21.33 mL) was lowest (p<0.05) among treatment groups, while treatments with higher levels of SM had higher (p<0.05) gas production than those with higher proportions of SS. As expected, pH decreased as incubation increased (Table 1). Moreover, the treatments with higher proportions of SS had lower pH values than those with higher proportions of SM after 24 and 48 h of incubation. In addition, the NH3-N concentration changed from 0 to 48 h, with the greatest levels (p<0.05) occurring in exclusively SM containing mixture (28.75 mM) (Table 1). Exclusively SS had the lowest (p<0.05) NH3-N concentration in all of the groups after 24 h of incubation. As shown in Table 1, increasing CH4 concentrations were observed from 0 to 48 h of incubation. At 12 h of incubation, the highest (p<0.05) CH4 concentration was observed on exclusively SM. After 24 h incubation, exclusively SM and 5:5 ratio had the highest (p<0.05) CH4 concentrations at with 70.72 and 67.17 mM, respectively and then after 48h of incubation, the highest (p<0.05) levels were observed in exclusively SM, 7:3, 5:5, and 3:7 ratio with 80.12, 81.27, 80.18, and 75.93 mM, respectively.

Total gas, pH, ammonia-nitrogen (NH3-N) and methane (CH4) production during in vitro rumen fermentation using different ratios of soybean meal and soluble starch
The BA concentration of rumen microbial in vitro fermentation is shown in Table 2. Most of the BA was higher or only detected with higher proportions of SM. The histamine concentration was highest (p<0.05) in exclusively SM with 3.230 mM followed by 7:3, 3:7, 5:5, exclusively SS and control, respectively after 48 h of incubation. Methylamine, putrescine and cadaverine were only detected in exclusively SM and 7:3 ratios. In addition, highest (p<0.05) amine index and total amine were observed in exclusively SM and 7:3. Table 3 shows the VFA and other metabolite concentrations during in vitro rumen fermentation at different incubation times. A higher proportion of SS was associated with significantly higher total volatile fatty acids (TVFA), propionate and butyrate production than higher proportions of SM (Table 3). After 24 h of incubation, highest (P<0.05) propionate concentration was observed in 5:5, 3:7 and exclusively SS proportions with 20.45, 20.77, and 21.48 mM, respectively and after 48 h of incubation it was highest (p<0.05) in exclusively SS with 24.96 mM. Conversely, the highest (p<0.05) concentration of acetate was observed in samples with the highest proportion of SM, exclusively SM and 7:3, after 48 h of incubation with 47.04 and 43.87 mM, respectively.
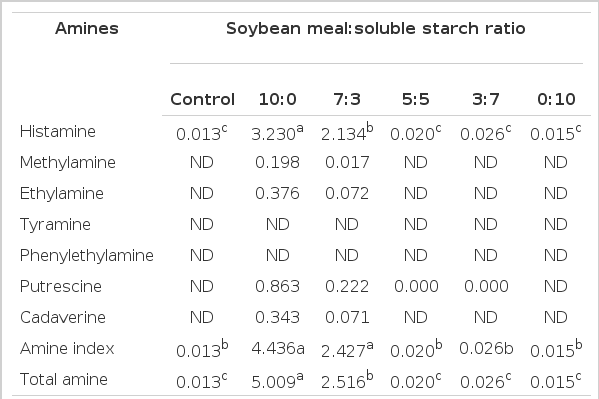
Biogenic amine concentration (mM) at 48 h during in vitro rumen fermentation using different ratios of soybean meal and soluble starch

Volatile fatty acids (VFA) concentrations (mM) during in vitro rumen fermentation using different ratios of soybean meal and soluble starch
The similarity index and negative image of 16S rDNA amplified DGGE band profiles was obtained using total genomic DNA extracted from in vitro fermentation after 48 h of incubation (Figure 1). The Unweighted Pair Group Method with Arithmetic mean (UPGMA) showed that treatment groups were divided into control, exclusively SM, 7:3 and 5:5, 3:7, exclusively SS with 75% similarity. In group 1, exclusively SM, and 7:3 ratio were 91% similar to each other and 85% similar to the control. In group 2, 5:5, and 3:7 ratios were 94% similar to each other and 89% similar to exclusively SS. Nine dominant bands were selected, cut, sequenced and identified (Table 4). The sequences were found to be 87% to 100% homologous with those available in the GenBank database, most of which were from bacteria isolated from the rumen. R2 and R4 bands were found on higher proportion of SM while R3, R7, R8, and R9 bands were found in higher proportion of SS.
Negative image and similarity index of 16S rDNA amplified DGGE band profiles using total genomic DNA extracted after 48 h of in vitro rumen fermentation using different ratios of soybean meal and soluble starch. DGGE, denaturing gradient gel electrophoresis; SM, soybean meal; T1 = Control; T3 = SM 7: SS 3; T5 = SM 3: SS 7; SS, soluble starch; T2 = SM 10: SS 0; T4 = SM 5: SS 5; T6 = SM 0: SS 10.

Dominant bands from 16S rDNA amplified DGGE of in vitro rumen fermentation using different ratios of soybean meal and soluble starch
DISCUSSION
Rumen fermentation since the beginning of the century revealed that availability of rumen-degradable proteins (non-protein nitrogen and rumen degradable true protein) and energy (ruminally fermentable carbohydrate) in feeds as well as their synchronization are important in ruminants’ diet. The provision of both rumen-degradable proteins and energy simultaneously to the rumen is called synchronization (Seo et al., 2010). The determination of rumen microbial species, their environmental and nutritional requirements, and the characteristics of feeds have been thoroughly investigated, with energy and nitrogen sources being the primary focus of attention. However, rumen fermentation is affected by pH and turnover rate, which are determined by intake levels, feeding systems, particle size and quality of forage, and proportion and type of carbohydrate ingested. Some of these attributes have been investigated in this study.
As SM is known to have high degradability which is further subjected to rumen microbial fermentation during metabolism and conversion of the substrates, higher gas production of samples containing higher proportions of soybean can be expected. It could also be due to high contents of easily fermentable starches, sugars, or hemicelluloses as substrate to rumen microbes for gas production. Getachew et al. (2004) reported that the digestibility of the measured organic matter was closely related to that predicted from gas production and the crude protein and ash contents of feeds. They also found a high correlation between metabolizable energy measured in live animals and that predicted from gas production. On the other hand, the pH decreased as the incubation time increased, which was comparable to the results obtained by Russell and Baldwin (1979), who reported that these changes were due to the production of lactic acid. Martin and Streeter (1995) also observed that the pH was lower in SS than SM, and that the concentrations of most fermentation products were much higher than those observed in the absence of carbohydrates, and our results corroborate with these finding. Starch hydrolysis or fermentation by microorganisms caused increases amounts of lactic acid and alcohol, which are responsible for decreased pH in the rumen (Walker and Harmon, 1995). As a result, low fiber digestion occurs when the pH value decreases below 6.2 due to decreased levels of fiber degrading bacteria. Also, decreased in pH can lead to subacute ruminal acidosis (SARA) (Plaizier et al., 2008). Reduced ruminal efficiency, liver and lung abscesses, and laminitis are all thought to be related to SARA (Stone, 2004).
Higher CH4 concentrations were found in SM than SS. This might have been due to the nutrient composition of feed, grain type and processing, and microbial digestibility. High CH4 production might also be attributed to the high contents of easily fermentable starches, sugars, or hemicelluloses as substrate to rumen microbes for gas production. Van Kessel and Russell (1996) stated that highly digestible carbohydrate undergoes rapid decomposition inside the rumen and causes a reduction in ruminal pH, which inhibits the activity of CH4 producing microorganisms and protozoa. Thus, low CH4 production was observed in response to a high proportion of SS.
The NH3-N level depends on the presence of microbial protein in the rumen (Mamuad et al., 2014), which also depends on the level of the carbohydrate level. Specifically, if the carbohydrate level increases, then both NH3 and microbial protein will decrease, although microbial protein synthesis efficiency depends on the quantity of carbohydrate fermentation. According to Kim et al. (2012), the levels of NH3-N in the rumen are generally high when feeds are more digestible. The mixture with only SM which had high protein content as substrate produced high concentration of NH3-N. However, Fenderson and Bergen (1976) reported that when steers were fed with high protein rations, it resulted to high ruminal ammonia levels and elevated plasma urea nitrogen concentrations. This might lead to ammonia toxicity.
Amines are produced by decarboxylation of amino acids via enzymes produced by putrefactive bacteria as well as many species and strains of lactic acid bacteria. Microbial species associated with fermented food and beverages releases exogenous decarboxylases which forms BA. They are biologically active compounds with aliphatic (putrescine, spermidine, spermine), aromatic (dopamine, tyramine, phenylethylamine), or heterocyclic (histamine, serotonin) structures. Several BA play critical roles in human and animal physiological functions such as regulation of body temperature, stomach volume and pH, and brain activity. Ruminants potentially receive amines from both dietary and ruminal microbial sources and thus have potentially greater amount available for absorption than other species (Phuntsok et al., 1998). Steidlova and Kalac (2002) mentioned that high levels of BAs are common in silages prepared from forages with high protein content (e.g., alfalfa, clover, some grasses). They also reported that high levels of BAs were observed in maize silages. BAs are also present in all natural products in which protein degradation has occurred. Thus, treatments with high proportion of SM (highly degradable protein) were observed to be also high in BAs. In addition, increased contents of dietary amines have been found to be undesirable in ruminant nutrition.
Methylamine, which is also a BA, is used as a substrate for methanogenesis (Thauer, 1998). This explains the high CH4 concentration observed in high proportion of SM which was also detected with high concentration of methylamine. In addition, high proportion of SM (high protein content) also leads to production of high concentration of histamine. Aschenbach and Gabel (2000) added that absorption of ruminal histamine is an important cause of systemic histaminosis in ruminants suffering from ruminal acidosis. They also added that histamine absorption is linked to luminal epithelial damage, which is primarily induced by luminal acidity and not by histamine. However, histamine is thought to worsen blood circulation in limbs. Furthermore, high histamine concentration might lead to SARA and might cause bovine laminitis (Krizek et al., 1993).
Polyamines such as putrescine are important in the synthesis of proteins, RNA, and DNA, and are therefore essential for cell proliferation and growth (Aschenbach and Gabel, 2000). However, putrescine is the causative factor in ketonemia and high concentration of putrescine leads to ketonemia (Tveit et al., 1992). Consequently, putrescine infusion treatment significantly reduced nitrogen degradability in the rumen of steer (Dawson and Mayne, 1996). On the other hand, tyramine infusion has been shown to increase pH and isovalerate proportion in rumen fluid Tveit et al. (1992). Our observations that higher pH was associated with (the detection of) tyramine in feed containing higher proportions of SM correspond with those of Tveit et al. (1992).
van Beers-Schreurs et al. (1998) stated that the quantity of VFA depends on the amount and composition of the substrate and thus SM and SS were converted into different concentrations of VFA. Mamuad et al. (1998) added that lower VFA concentrations reflect lower amounts of fermented substrate, lower quantities of microbial activity and lower energy intake. Soybean meal fermentation is lower than SS. Hence, lower VFA concentrations were observed in SM substrate than SS. Our results agrees with those of Van Nevel and Demeyer (2014), who found that feeding diets rich in soluble carbohydrates and starch to ruminants resulted in increased propionate and CH4 production and a decreased acetate: propionate ratio.
Groupings of different treatments based on similarity index showed that changes in ruminal fermentation were affected by the substrate used for fermentation. Mao et al. (1977) reported rumen microbial community changes in response to variations in the type and level of the feed. Williams (2008) reported enhanced growth of Selenomonas ruminantium and Streptococcus bovis in response to high SS levels, which is in accordance with the high level of SS, which were identified as Selenomonas sp. Martin and Streeter (1986) added that S. ruminantium, the predominant ruminal bacterium, uses the succinate-propionate pathway, which is essential for energy production. Important microorganisms such as Selenomonas disappeared in the presence of higher proportions of SM, while cellulolytic bacteria might disappear with higher proportion of SS. Also, higher proportion of SS will lead to acidosis and then SARA and then laminitis.
Different feed ratios affect rumen fermentation in terms of pH, NH3-N, CH4, BA, VFA, and other metabolite concentrations, and microbial diversity. A higher proportion of SM increased BA, while a higher proportion of SS drastically decreased pH over time which might lead to sub-acute ruminal acidosis. Both parameters had a negative impact on rumen fermentation. Overall, these findings indicate that a balanced SM and SS ratio is needed for rumen fermentation.
ACKNOWLEDGMENTS
This work was carried out with support of “Cooperative Research Program for Agriculture Science and Technology Development (Project No. PJ0091562014 and PJ0105212015)”, Rural Development Administration, Republic of Korea.