Polymorphisms in the Perilipin Gene May Affect Carcass Traits of Chinese Meat-type Chickens
Article information
Abstract
Improved meat quality and greater muscle yield are highly sought after in high-quality chicken breeding programs. Past studies indicated that polymorphisms of the Perilipin gene (PLIN1) are highly associated with adiposity in mammals and are potential molecular markers for improving meat quality and carcass traits in chickens. In the present study, we screened single nucleotide polymorphisms (SNPs) in all exons of the PLIN1 gene with a direct sequencing method in six populations with different genetic backgrounds (total 240 individuals). We evaluated the association between the polymorphisms and carcass and meat quality traits. We identified three SNPs, located on the 5′ flanking region and exon 1 of PLIN1 on chromosome 10 (rs315831750, rs313726543, and rs80724063, respectively). Eight main haplotypes were constructed based on these SNPs. We calculated the allelic and genotypic frequencies, and genetic diversity parameters of the three SNPs. The polymorphism information content (PIC) ranged from 0.2768 to 0.3750, which reflected an intermediate genetic diversity for all chickens. The CC, CT, and TT genotypes influenced the percentage of breast muscle (PBM), percentage of leg muscle (PLM) and percentage of abdominal fat at rs315831750 (p<0.05). Diplotypes (haplotype pairs) affected the percentage of eviscerated weight (PEW) and PBM (p<0.05). Compared with chickens carrying other diplotypes, H3H7 had the greatest PEW and H2H2 had the greatest PBM, and those with diplotype H7H7 had the smallest PEW and PBM. We conclude that PLIN1 gene polymorphisms may affect broiler carcass and breast muscle yields, and diplotypes H3H7 and H2H2 could be positive molecular markers to enhance PEW and PBM in chickens.
INTRODUCTION
Consumption of poultry meat has grown rapidly over the last 50 years, as poultry meat is a high-quality dietary protein source for humans. The worldwide demands for meat will continue; meanwhile, the cost of poultry production, especially the feed and labor, continues to also rise. These factors have urged the breeders, nutritionists, and farmers to develop strategies to improve broiler feed efficiency and muscle yield (Sun and Wang, 2006; Petracci and Cavani, 2012). Molecular marker assisted selection is an effective way to improve these traits within a short breeding period (Lande and Thompson, 1990).
Studies indicate that the Perilipin (PLIN1) gene affects body weight (BW) and fat deposition in animals (Londos et al., 2005; Bickel et al., 2009). Perilipin, the lipid droplet coat protein from the lipid droplets related proteins family, exists in a variety of eukaryotic species ranging from amoebas to vertebrates (Miura et al., 2002). Perilipins share a highly conserved sequence and avidity for the surfaces of intracellular, neutral lipid storage droplets (Kimmel et al., 2010). Genetic variation in PLIN1 was associated with carcass traits and adiposity in humans (Ruiz et al., 2011), pigs (Gandolfi et al., 2011), cattle (Fan et al., 2010), sheep (Gao et al., 2012), ducks (Zhang et al., 2013), and chickens (Zhou et al., 2014). In humans, the rs6496589 G allele frequencies of PLIN1 were significantly associated with a lower risk of central obesity (Song et al., 2014). The various PLIN1 genotypes were associated with significant differences in carcass weight (CW), carcass net weight, and percentage of abdominal fat (PAF) in ducks (Zhang et al., 2013).
Research on PLIN1 gene polymorphisms in poultry has been reported, and developmental variants of PLIN1 expression have a relationship with fat and lipid parameters (Zhao et al., 2009). Certainly not all genetic variation is correlated with carcass and adipose traits; at least one study indicated that there was no significant effect on carcass and adipose traits when the PLIN1 gene harbored a G-T mutation at 2,224 bp (Lei et al., 2011). A previous study showed that the diplotypes of three single nucleotide polymorphisms (SNPs) in PLIN1, g.2272C>T, g.2319C>T and g.2467G>A, were significantly associated with BW, CW and leg muscle weight (LMW), and significantly associated with abdominal fat weight (AW) and PAF in Luqin chickens (Zhou et al., 2014).
Previous studies utilized polymerase chain reaction (PCR)-restriction fragment length polymorphism (RFLP), which has a lower resolution ratio and accuracy than direct sequencing. Thus, we used direct sequencing to analyze polymorphisms in the PLIN1 gene, which is located on chromosome 10 and contains 8 exons and 7 introns (http://asia.ensembl.org/Gallus_gallus/Transcript/Exons?db=core;g=ENSGALG00000023395;r=10:12315435-12319628;t=ENSGALT00000038622). We screened the genetic polymorphisms in all exons and partial introns of the chicken PLIN1 gene in six broiler populations to discern potential associations between the nucleotide polymorphisms and carcass traits, as well as intramuscular fat content (IMF).
MATERIALS AND METHODS
Chicken populations
In total, 240 chickens (male:female = 1:1) from six populations were used in the present study. The native Chinese breeds, Mountainous Black-bone (MB; n = 40) and Erlang Mountainous chickens (EM; n = 40) were indigenous breeds from the Sichuan province, China, with spotty feathers and black skin (Wang et al., 2012; Wang et al., 2014). The Hongbiao chickens (HB; n = 40) were indigenous breeds from Taiwan with red feathers and yellow skin (Gu and Dai, 2011). The commercial breeds, Daheng (DH; n = 40), BH1 (n = 40) and BH2 chickens (n = 40) were characterized by spotty feathers and yellow skin. The Daheng and BH1 and BH2 chickens were obtained from Sichuan Daheng Poultry Breeding Company and Banghe Agricultural Science and Technology Company, China (Zhou et al., 2009).
Ten thousand fertilized eggs from each population were hatched on the same day, and six thousand chicks were housed in batteries (battery size: 200 cm×60 cm×30 cm). There were 60 birds per pen with 100 pens of each population. At day 49, all individuals were transferred to single cages (size: 28 cm×55 cm×36 cm). Throughout the trial, birds had free access to feed and water. Diets fed were 19% crude protein (CP) and 2,897 kcal of ME/kg from 1 to 28 d, 17% CP and 2,998 kcal of ME/kg from 28 to 43 d, and 15% CP and 3,819 kcal of ME/kg from 43 to 91 d, which satisfied the dietary requirement of yellow-feather chickens (Zhao et al., 2012).
Data collection
We randomly sampled 240 individuals at 90 d of age for performance data collection and genotyping. Prior to slaughter, whole blood was collected from each chicken and stored at −20°C. Carcass traits measured included live BW after 12 h without access to feed, CW, semi-eviscerated weight, eviscerated weight (EW), breast muscle weight, LMW, and AW, as described by Zhao (Zhao et al., 2012). Intramuscular fat was extracted from muscle fibers by using the Soxhlet extraction technique (Rosa et al., 1983) and was defined as the content of IMF per 100 g of dried breast muscle. The dried breast muscle was prepared by baking the fresh muscle at 105°C in an oven for 120 min and then cooling to room temperature in desiccators.
Procedure for polymerase chain reaction and genotyping
We extracted genomic DNA from whole blood using the standard phenol/chloroform method (Wang et al., 2007). The Gallus gallus PLIN1 gene sequence (accession number NC 006097.3) was the basis for designing primer pairs via the OLIGO 6.0 program (Molecular Biology Insights, Inc., Cascade, CO, USA). Primers covered all 8 exons of the PLIN1 gene (Table 1). The PCR was performed in a final volume of 50 μL containing 200 ng genomic DNA, 1 μL each of forward and reverse primers (10 pmol/μL), and 25 μL 2×Taq PCR Master Mix (Beijing Tianwei Biology Technique Corporation, Beijing, China). The reaction mixture was predenatured for 4 min at 94°C, followed by 35 cycles at 94°C for 30 s, 57°C for 30 s, 72°C for 1 min, and ended with a full extension cycle at 72°C for 8 min. The PCR products were electrophoresed on a 1% agarose gel and were visualized on a Gel DocTMEQ170-8060 after staining with ethidium bromide. Samples showing different banding patterns on gels were reamplified, purified, and sequenced by a commercial sequencing company (Beijing Liuhe Huada Gene Technology Company, Beijing, China).

Primers for screening SNPs in the chicken PLIN1 gene
Haplotype construction
The PHASE 2.0.2 was employed to build the most likely pair of haplotypes (diplotypes), using all three SNPs. This software implements a Bayesian statistical method for reconstructing haplotypes from population genotype data (Stephens et al., 2001). This method is applicable to genotypic data at linked loci from a population sample and may reduce error for haplotype construction by >5.0%. The parameters for PHASE input contained the number of individuals and SNPs, position of SNPs in the nucleotide sequence, symbol “sss” and the genotypes of all SNPs (Stephens et al., 2001). Diplotypes with a frequency less than 5.0% were excluded in the association analysis of diplotypes and carcass traits.
Linkage disequilibrium and statistical analysis
The pattern of pairwise linkage disequilibrium (LD) coefficient (D′) and correlation coefficient (r2) between the SNPs was calculated using the program Haploview 4.1 (Barrett, 2009). Allelic frequencies were determined by direct counting from observed genotypes. The x2-test was used to determine Hardy-Weinberg equilibrium (HWE) of the mutation. Population genetic indices, including gene homozygosity (Ho), gene heterozygosity (He), effective allele numbers (Ne), and polymorphism information content (PIC) were calculated according to Nei and Roychoudhury (Nei and Roychoudhury, 1974).
Data were analyzed by the GLM procedure of SAS 8.0 (SAS Inst. Inc., Cary, NC, USA). The genetic effects of diplotypes on carcass traits and IMF were analyzed by the following model:
Where Yijk = the dependent variable; μ = the population mean; Pi = fixed effect of population; Sj = fixed effect of sex; Gk = fixed effect of genotype/diplotype. (PG)ik = interaction effect between population and genotype/diplotype; (PS)ij = interaction effect between population and sex; (SG)jk = interaction effect between genotype/diplotype and sex; (PSG)ijk = interaction effect between population and genotype/diplotype and sex; eijk = random error. Statistical significance threshold was determined as p<0.05, unless otherwise specified. The false discovery rate (FDR) was calculated for corrections of multiple testing for each p-value (Benjamini and Hochberg, 1995). A significant association was defined as a value of 0.05 for the adjusted p-values.
RESULTS
Population effect on carcass and intramuscular fat traits
The population effects on chicken carcass traits and IMF are summarized in Table 2. There was a population effect on carcass traits and IMF (p<0.001). The IMF, percentage of leg muscle (PLM), percentage of breast muscle (PBM), and BW of HB chickens were greater than other chickens (p<0.001), whereas the BW, percentage of carcass weight (PCW), PSEW, PAF, and IMF were lower in MB than other chickens (p<0.001).
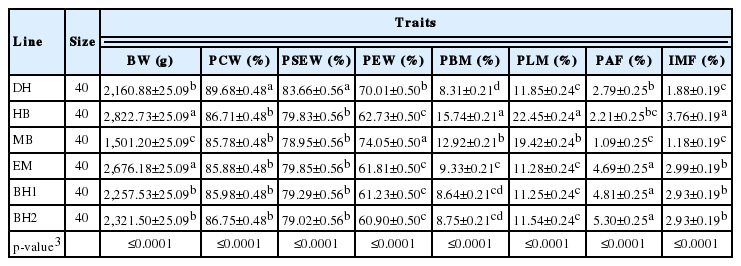
Population effects on carcass traits and IMF in chickens
Variations in the chicken PLIN1 gene
A direct sequencing method was developed for screening the SNPs in the chicken PLIN1 gene. Of the 10 fragments that covered the 5′ flanking regions and entire exons of the PLIN1 gene, only one was polymorphic and three SNPs, rs315831750, rs313726543, and rs80724063 were identified (Figure 1). The rs315831750 is located in the 5′ flanking regions and the rs313726543 and rs80724063 are located in exon 1 of PLIN1.

Sequencing analysis of the Perilipin (PLIN1) gene. Arrows indicate mutation sites.
Genotype and allele frequencies and genetic diversity parameters for single nucleotide polymorphisms in the PLIN1 gene
The allelic and genotypic frequencies, and genetic diversity parameters (Ho, He, Ne, and PIC) of the three SNPs are shown in Table 3. In locus rs315831750, the allele T predominated due to its higher frequency than allele C in all populations. In locus rs313726543, the allele A predominated due to its higher frequency than allele G in most of the populations. In locus rs80724063, the frequency of allele C was higher than allele T in all populations, and the frequency of genotype TT was the smallest in all six populations and not detected in DH and MB chickens.
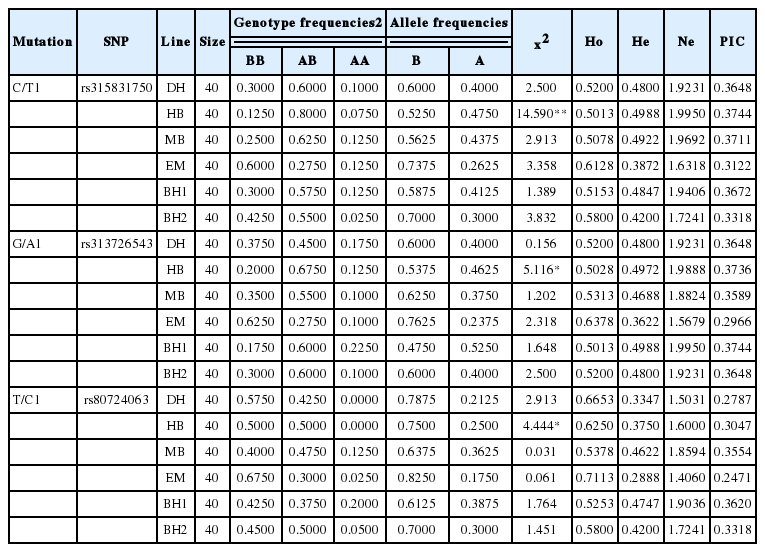
Genotype and allele frequencies and genetic diversity parameters for the PLIN1 gene in six breeds
The x2-test performed to examine the HWE, revealed that the three loci in DH, MB, EM, BH1, and BH2 chickens, but not HB, were in HWE (p>0.05), and the PIC ranged from 0.2471 to 0.3736 (Table 3).
Effect of single nucleotide polymorphism genotype on carcass traits
Effects of single SNP genotype on carcass traits are summarized in Table 4. The single SNP effect was significant for PBM, PLM, and PAF. Chickens with the homozygous genotype CC had the greatest PBM, the heterozygous genotype CT the greatest PLM and smallest PAF, and the homozygous genotype TT the smallest PBM and PLM, but the greatest PAF at rs315831750. The single SNP genotype had no significant effect on carcass traits at the other two SNPs.

Effect of single SNP genotype on carcass traits
Haplotype construction and association with carcass and intramuscular fat traits
Eight haplotypes were reconstructed based on the three SNPs. Among them, four haplotypes H1 (CGC), H2 (CGT), H6 (TGT), and H7 (TAC) were prevalent and accounted for 94.44% of the estimates (Table 5). Two main haplotypes, H2 (CGT) and H7 (TAC), accounted for 76.35% of the estimates. The haplotype H7 (TAC) had a higher frequency than other haplotypes, accounting for 55.79% of the estimates. Four haplotypes, H3 (CAC), H4 (CAT), H5 (TGC), and H8 (TAT), which had a frequency lower than 5%, were not included in Table 6. Diplotypes affected percentage of eviscerated weight (PEW) and PBM (p<0.05). The HB chickens were not analyzed in diplotypes effects on carcass traits and IMF because HB chickens were not in HWE. Compared with chickens carrying other diplotypes, H3H7 chickens had greater PEW and H2H2 greater PLM than other diplotypes, and those with diplotype H7H7 had less PEW and PBM than other diplotypes (Table 6).

Haplotypes constructed with single nucleotide polymorphisms (SNP) and their frequencies
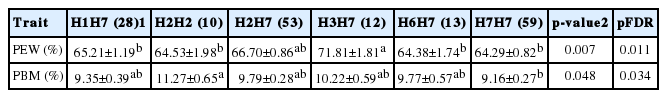
Diplotype effects on PEW and PBM in chickens
The linkage disequilibrium analysis between the three single nucleotide polymorphisms
The pattern of pairwise LD structure as measured by D′ and r2 between the SNPs was calculated using the program Haploview 4.1, and the haploblock structure presented in Figure 2. We performed LD and haplotype analysis for the three SNPs in all chickens, except for HB chickens. According to the data, the D′ value between SNP1 and SNP2, SNP2 and SNP3, and SNP1 and SNP3 were 0.81, 0.92, and 0.66, respectively. Moreover, r2 for them were 0.601, 0.539, and 0.309, respectively.
Haploblock structures of the 5′flanking and exon 1 region as revealed by Haploview program.
DISCUSSION
There are many reports of polymorphisms in the PLIN1 gene in mammals, and dozens of SNP loci for the PLIN1 gene were associated with lipid metabolism and carcass traits (Marcinkiewicz et al., 2006; Fan et al., 2010). In humans, elevation of PLIN1 expression was correlated with increased adiposity (Kern et al., 2004), and PLIN1 polymorphisms affect diet-induced changes in body fat and energy metabolism (Ruiz et al., 2011). Polymorphisms in PLIN1 gene exon 2 and intron 2 have an influence on carcass and adipose traits, and PLIN1 was identified as a candidate gene affecting carcass and meat quality traits in ducks (Fan et al., 2011).
Research on polymorphisms of the PLIN1 gene in chickens has been reported, but the PCR-RFLP used in variation scaning had lower resolution ratio, compared with the direct sequencing used in the present study (Lei et al., 2011; Zhou et al., 2014). Moreover, we screened all exons of this gene for genetic variations in quite a few populations. Variations observed in PLIN1 mRNA sequences were rs315831750, rs313726543, and rs80724063 (Rubin et al., 2010). The rs313726543 and rs80724063 are synonymous mutations, and the rs315831750 leads to a non-coding triplet just upstream of the initiation ATG in the reference sequence becoming a coding initiation ATG, thus the variant will have two adjacent methionines instead of just one in the reference sequence. The role of these SNPs in affecting the efficiency of transcription or translation of the PLIN1 gene remains unknown. A seemingly silent SNP may not necessarily be neutral and may enact a function (Kimchi-Sarfaty et al., 2007).
We calculated the allelic and genotypic frequencies and genetic diversity parameters of the three SNPs in the six chicken populations. The six populations in this study included both indigenous and commercial breeds, showing that these SNPs exist in different genetic background populations, not only in a discrete population. The HB chicken breed was not in dynamic equilibrium for the three loci, which perhaps was a consequence of long-term artificial selection. Since 1996, HB chickens have been subjected to 16 generations of breeding and is famous for its production performance (Gu and Dai, 2011). Therefore, in this study all the associations with carcass traits and IMF in chickens did not include the HB chickens. The IMF, PLM, PBM, and BW in HB chickens were greater than in other chickens, and the BW, PCW, PSEW, PAF, and IMF were lower in MB than in other chickens (Table 2).
Polymorphic information content >0.5 indicates high polymorphism, 0.25<PIC<0.5 reflects medium polymorphism, and PIC<0.25 represents low polymorphism (Vaiman et al., 1994). In this study, the PIC ranged from 0.2471 to 0.3736 (Table 3), which reflected an intermediate genetic diversity of the chicken PLIN1 gene in all chicken populations studied. Thus, these loci may serve as potential molecular markers, but whether they are appropriate as molecular markers for marker-assisted selection should be validated in more groups.
We constructed haplotypes for all six chicken populations. The current study used PHASE software to infer the most likely haplotype pairs for each individual, with probabilities ranging from 5% to 100%. For association analysis between a candidate gene and the studied phenotypes, there are differing views (Zhao et al., 2009). Some researchers propose that haplotype analysis may be more powerful than single SNP analysis due to accumulated allelic effects at different loci and/or interactions between these loci, whereas others suggest that if a connection between SNPs and a certain phenotype is driven by only a single SNP, then a single SNP approach will be superior to the haplotype-based approach (Morris and Kaplan, 2002; Clark, 2004).
The single SNP genotype had a large effect on PBM, PLM and PAF (p<0.05), and the diplotype had a large effect on PEW and PBM (p<0.05). All of these results indicate that additive effects of a single SNP might not explain our results. More likely, there are interactions among these loci or even linkage disequilibrium. We performed linkage disequilibrium analysis for the three SNPs in all chickens, but did not include HB chickens. The pattern of pairwise LD structure as measured by D′ and r2 between the SNPs was calculated using the program Haploview 4.1, The D′ values between SNP1 and SNP2, SNP2 and SNP3, and SNP1 and SNP3 were 0.81, 0.92, and 0.66, respectively. Moreover, r2 for them were 0.601, 0.539, and 0.309, respectively. This showed that SNP1 and SNP2, SNP2, and SNP3 had high LD, the SNP1 and SNP3 had medium LD.
We observed significant relationships between single SNP genotype and traits PBM, PLM, and PAF, and between haplotype pairs and traits PEW and PBM. The homozygous genotype CC chickens had the greatest PBM, the heterozygous genotype CT had the greatest PLM and smallest PAF at rs315831750. Birds with the H3H7 had greater PEW and H2H2 had greater PLM than other diplotypes. Thus, we infer that diplotype H3H7 and H2H2 are ideal genetic markers for selecting greater PEW and PLM in chickens, respectively. Meanwhile, as there were significant population effects for PEW and PBM, it is necessary to analyze the effects of PLIN1 polymorphisms using populations with different genetic backgrounds.
ACKNOWLEDGMENTS
We thank Xiao-Song Jiang and Hua-Rui Du for their help in managing the birds and collecting the data. This work was financially supported by the China Agricultural Research System (CARS-41) and the National Natural Science Foundation of China (Grant No: 31402070).