Responses to Starch Infusion on Milk Synthesis in Low Yield Lactating Dairy Cows
Article information
Abstract
The effect of starch infusion on production, metabolic parameters and relative mRNA abundance was investigated in low yield lactating cows from 86 days in milk. Six Holstein cows fitted with permanent ruminal cannulas were arranged into one of two complete 3×3 Latin squares and infused with a starch solution containing 800 grams starch for 16 days. The three treatments were: i) ruminal and abomasal infusion with water (Control); ii) ruminal infusion with cornstarch solution and abomasal infusion with water (Rumen); iii) ruminal infusion with water and abomasal infusion with cornstarch solution (Abomasum). There were no significant differences (p>0.05) among the three treatments with low yield lactating cows in feed and energy intake, milk yield and composition, plasma metabolism, or even on gene expression. However, cows receiving starch through rumen performed better than directly through the abomasum during the glucose tolerance test procedure with a higher area under the curve (AUC; p = 0.08) and shorter half-time (t1/2; p = 0.11) of plasma insulin, therefore, it increased glucose disposal, which stated a lipid anabolism other than mobilization after energy supplementation. In conclusion, extra starch infusion at concentration of 800 g/d did not enhance energy supplies to the mammary gland and improve the lactating performance in low yield lactating cows.
INTRODUCTION
Cows in their early lactation experience negative energy balance. The dietary energy intake cannot meet daily energy demands for body maintainance and milk yield (Coppock, 1985). As a result cows lose body weight (BW) and body condition score to compensate for the deficit in energy (Hayirli et al., 2001). To alleviate this problem, supplying extra energy in a form such as starch or glucose may be preferred.
Some studies have shown that glucose infusion increases milk yield (Frobish and Davis, 1977; Rigout et al., 2002). In one trial, in which transition dairy cows were abomasally infused with 1,500 grams of glucose per day (Larson and Kristensen, 2009) milk yield increased during early lactation. Results in postpartum cows infused with 1,500 g/d of hydrolyzed starch abomasally or ruminally indicate that not all available glucose is partitioned to the mammary gland in early lactating cows (Knowlton et al., 1998). As a result energy retention is enhanced in adipose tissues (Reynolds, 2006). Similarly, mid-lactation cows have exhibited an improvement in body condition in addition to lactation performance with increasing intravenous glucose infusion (Al-Trad et al., 2009).
Most of the available information on energy distribution was produced using glucose infusion. Glucose is the most direct energy supplier for cows, while starch undergoes a complex metabolic process when it is taken by dairy cows. It is important to determine the difference between glucose and starch. Reports focusing on the effects of starch infusion on energy distribution are limited. Research conducted by Knowlton (1998) concluded that starch infusion supports a sustained increase in milk yield at peak lactation in early lactating cows yielding >40 kg/d of milk. The question that remains to be answered is whether milk yield can be improved by starch infusion in low milk yield cows. Therefore, this investigation was performed to elucidate the effect of starch infusion on feed intake, lactation performance, and plasma, liver, and adipose metabolism, and then draw a conclusion on relationship between starch supplementation, gluconeogenesis, and lipid metabolism in lactating cows on low milk yield basis.
MATERIALS AND METHODS
Cows, treatments and management
Six Holstein cows fitted with permanent ruminal cannulas (inner diameter of 10 cm) were assigned to one of two complete 3×3 Latin squares. Cows were randomly assigned to one of three treatments: i) ruminal and abomasal infusion with water (Control); ii) ruminal infusion with cornstarch solution and abomasal infusion with water (Rumen); iii) ruminal infusion with water and abomasal infusion with cornstarch solution (Abomasum). The total dosage was 4.0 L/d of water or starch (at 800 g/d) infusion into rumen or abomasum. Purified starch was obtained from Lihua Starch Ltd (Hebei, China). The abomasal infusion was through a plastic tube (6 mm i.d.) inserted into the abomasum through the rumen and held in place with a flexible rubber disk (18 cm i.d.), starch was infused on 06:00, 09:00, 12:00, 15:00, 18:00, and 21:00 h every experimental day respectively.
Cows in second lactation averaged 86±21 days in milk at the start of the experiment with an average milk yield of 19.9 kg/d, and average BW of 549 kg. Cows were housed in a tie-stall barn with rubber mats bedded with sawdust, and were fed the same total mixed ration (Table 1) in equal measure at 07:30 and 19:30 h on an ad libitum basis, and were milked twice daily at 07:00 and 19:00 h. Cows were allowed access to an exercise lot for 1 h daily. Water was available ad libitum.
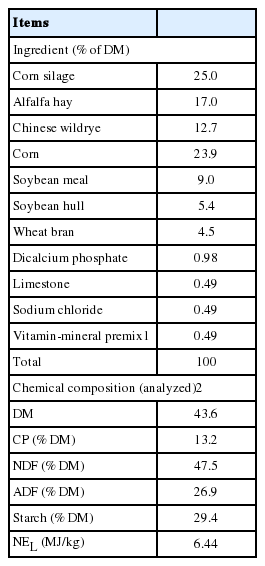
Ingredients and chemical composition of the total mixed ration
Each experimental period lasted 16 days. The first 12 days were for adjustment to the treatment followed by 4 days for sample collection. There were 2 days for cows to rest between every two periods. During the experimental procedure, cows were cared for in accordance with the practices outlined in the Guide for the Care and Use of Agriculture Animals in Agriculture Research and Teaching (FASS, 2010).
Experimental sampling, measurements and chemical analysis
Feed intake
The amount of feed offered and refused was recorded on day 13 and 14.
Milk yield and composition
Milk yield was recorded daily on day 13 and 14 of each period in Latin squares, and samples were collected in the morning and afternoon separately. Milk samples were collected in a plastic bottle containing potassium dichromate, stored at 4°C until analyzed for milk fat, protein and lactose percentage using a near-infrared reflectance spectroscopy analyzer (Milk Scan 605, Foss Electric, Hille Rød, Denmark) in Beijing Dairy Cattle Center.
Plasma sampling
Cows were bled at the interval of 3 h from 07:30 to 19:30 h on day 13 and 14 of each period. Sampling times were shifted forward by 1.5 h on the second day so that samples represented every 1.5 h of a 12-h period. Blood was withdrawn via tail venipuncture into Vacutainer tubes (Becton Dickinson, Franklin Lakes, NJ, USA) containing sodium heparin anticoagulant. After centrifuging at 3,000×g for 15 min, plasma was collected to determine concentrations of glucose, cholesterol, triglycerides, urea nitrogen, β-hydroxybutyric acid, and non-esterified fatty acid (NEFA) using corresponding assay kits (Beijing Strong Biotechnologies, Inc., Beijing, China) in an automated biochemistry Analyzer (Model 7020, Hitachi Co., Tokyo, Japan), respectively with glucose oxidase and peroxidase (No. GH121T), CHOD-PAP (No. GH101Z), GPO-PAP (No. GH111Z), urease and glutamate dehydrogenase (No. GS9311S), β-hydroxidebutyric acid dehydrogenase (No. GB129T), ACS-ACOD (No. GS191Z/B). Aliquots of plasma were used to measure insulin by radioimmunoassay according to Villa-Godoy (1988).
Liver biopsy and adipose tissue collection
On day 15 of each sample collecting period, liver samples were taken by puncture biopsy (Oxender et al., 1971) and subcutaneous adipose was sampled from alternate sides between the tailhead and the tuber ischia according to method described by Smith and McNamara (1990). Samples were then rinsed in saline, frozen in liquid nitrogen, and then stored at −80°C until analysis (Greenfield et al., 2000). Liver samples (200 mg) were prepared for pyruvate carboxylase, phosphoenolpyruvate carboxykinase (PEPCK), peroxisome proliferators activated receptor-α (PPAR-α), and glucose transporter-2 (GLUT-2). Subcutaneous adipose tissue (1,000 mg) was preserved for further analyses of the mRNA abundance of insulin receptor (InsR), peroxisome proliferators activated receptor-γ (PPAR-γ) and glucose transporter type IV (GLUT-4).
RNA isolation, cleanup, reverse transcription (Table 2), and real-time polymerase chain reaction were conducted according to Al-Trad (2010) and described by Zou (2014) in detail. Relative mRNA abundance was obtained using 2−ΔΔCT method (Livak and Schmittgen, 2001). All values arbitrated to the unmated gene expression were expressed as the normalized ratio of gene expression relative to β-actin mRNA using threshold cycle value of one sample from control group as interpolate calibrator.

Sequences of primers used for quantitative real-time reverse transcription-PCR
Glucose tolerance test and calculation of measurements
Glucose tolerance test (GTT) was performed on day 16. The process was formulated according to Hayirli (2001), and Wheelock (2010). The day before GTT, all cows were fitted with a single jugular catheter at neck, indwelling polypropylene catheters (0.38 cm diameter tubing, PI-1410, MILA, Mila International Inc., Erlanger, KY, USA) were inserted through a 14-gauge needle until approximately 20 cm of tubing was inside the jugular vein. Catheter patency was checked before the beginning of GTT. Blood samples were collected at −15, 0, 5, 15, 30, 45, 60, and 90 min relative to infusion of 300 mg dextrose (50% wt/vol)/kg of BW0.75. Time to infuse dextrose solution was recorded for each cow. Catheters were flushed with 10 mL of sterile saline after infusion and after each blood sample collection immediately. Cows were blocked from feed at 07:30 h and were not allowed access until GTT was completed. Plasma samples were analyzed for glucose, and insulin concentrations as described earlier.
The glucose and insulin responses to the GTT were measured including basal concentration, peak concentration, area under the curve (AUC), clearance rate (CR) and half-time (t1/2). Basal, peak concentration and AUC are actual values. The 0 point sample was used for the baseline value, and glucose AUC was calculated through 60 min sample and the insulin AUC was calculated through the 30 min sample (Wheelock et al., 2010). However, CR and t1/2 values were calculated from exponential functions describing curves of plasma glucose and insulin concentrations for each cow (Hayirli et al., 2001), which were generated by the MAEQUARDT method using the NLIN Procedure of SAS (SAS, 1999). Data following intravenous glucose infusion were fitted to the following equation: f(t) = A×e(k×t), where: t = time; A, k = regression coefficient. Clearance rate is the slope of this exponential function. Therefore, CR and t1/2 were calculated as follows: CR, %/min = 100×[ln (ta)−ln (tb)]/(tb−ta), t1/2, min = 100×[ln (2)]/CR, where: (ta) = concentration of glucose and insulin at time a (ta); (tb) = concentration of glucose and insulin at time b (tb).
Statistics
Data were analyzed as replicated (n = 2) complete 3×3 Latin square using the PROC MIXED procedure of SAS (1999). Plasma metabolites were averaged by cow for each period prior to statistical analysis. The model for the fixed effects was: Yijklm = μ+Si+Cj(i)+Pk(i)+Tl+eijkl, where: μ = overall mean; Si = the effect of square (i = 1 to 2); Cj(i) = the effect of cow within square (j = 1 to 3); Pk(i) = the effect of period within square (k = 1 to 3); Tl = the effect of treatment (l = 1 to 3); eijkl = random error. Orthogonal contrasts were used to determine the significance of differences among treatments (infusion vs no infusion; ruminal vs abomasal infusion). A significance level of p<0.05 was used, and trends were declared at p<0.12.
RESULTS AND DISCUSSION
Performance and production responses
In general, no significant differences (p>0.05) were found in feed and energy intake among the three groups infused either ruminally or abomasally (Table 3). The results of dry matter intake (DMI) in the present study were in agreement with the reports by Al-Trad (2009), in which daily dry matter intake for starch and glucose infusion over the infusion period from day 0 to day 24 and infusion from 1.25% to 30% of net energy lactation (NEL) requirement was affected by neither infusion nor dose. However, it is well known that intake can generally be reduced by extra energy supplementation. Boudon (2007) conducted a research of glucose infusion with 1,250 or 2,500 g into rumen or abomasum, which resulted in a decrease in DMI compared with the control regardless of site or dose of infusion. The decrease in voluntary intake has been ascribed to the ability of the cows to compensate for the additional energy supplied by infusion (Larsen and Kristensen, 2009) by depression of the gut hormone glucagon-like peptide-1 secreted from L cells in the distal small intestine (Beglinger and Degen, 2006). In previous studies, researchers set their ruminal and abomasal infusion rates of starch and glucose at 1,500 g/d based on a milk yield up to 40 kg/d, and in our research, we focused on cows yielded about 20 kg/d, so we decreased starch quantity and infused starch at concentration of 800 g/d. However, the starch infusion at concentration of 800 g/d may not be enough to cause changes in DMI.
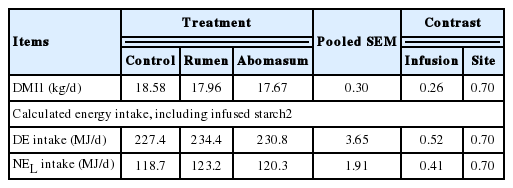
Effects of starch infusion at 800 g/d on dry matter intake in lactating dairy cows
Production responses of cows infused with starch at 800 g/d in the rumen, or the abomasum are as listed in Table 4. In a review, Nocek and Tamminga (1991) pointed out that “Production studies yield no clear evidence that postruminal starch digestion enhances milk yield or milk composition”. On the one hand, milk yield decreased as intravenous glucose was infused increasingly from 0, 10%, 20%, to 30% of the NEL requirement in mid-lactation cows (Al-Trad et al., 2009), which was likely attributed in part to the decreased DMI and digestible nutrients intake (Drackley et al., 2007). In other studies unsaturated free fatty acid supplied postruminally led to a decrease in milk yield (Drackley et al., 1992). On the other hand, some investigations have shown an increased tendency to an increase in milk yield when 1,500 g/d glucose was infused postruminally (Knowlton et al., 1998; Boudon et al., 2007). This variation might be a result of different energy sources (starch vs glucose) and amounts infused to cows. And the major finding was that starch infusion did not affect (p>0.05) milk yield and composition in the present study, which is also indicative of an increase in tissue energy retention (Reynolds et al., 2001).

Effects of starch infusion at 800 g/d on production responses in lactating dairy cows
Plasma metabolism and glucose tolerance test
Knowlton (1998) has concluded that ruminal and abomasal infusion of starch at 1,500 g/d has been shown to increase plasma insulin concentrations in lactating cows from day 24 to day 72, which was consistent with the results of cows receiving 1,500 g/d duodenal glucose infusion (Lemosquet et al., 1997). Starch infusion tended to decrease NEFA concentrations indicating a decrease in mobilization of adipose reserves, and abomasal infusion tended to decrease NEFA more than ruminal infusion of starch (Knowlton et al., 1998). However, the data presented here shows that the plasma index concerning glycometabolism was not affected (p>0.05) when starch was infused into rumen or abomasum at the concentration of 800 g/d (Table 5), which may be due to a lower starch infusion level and an experimental period which lasted from early to mid-lactating period. In addition, most references used a catheter implanted in advance, while we used tail venipuncture in the current study. Tail venipuncture is indeed easier and more convenient than implanted catheter, and we had made a comparison of milk yield with or without tail venipuncture, no difference was found (data not shown). And also in a recent study concerning variation between venipuncture versus peripheral catheter, results indicated that except for pH and venous blood gases, all parameters such as glucose, urea, creatinine, showed differences below the laboratory’s accepted systematic error (Hambleton et al., 2014). Therefore, the results in our research were comparable to the previous references.

Effects of starch infusion at 800 g/d on plasma metabolites in lactating dairy cows
Plasma glucose and insulin concentrations sharply increased and then gradually decreased following intravenous glucose infusion during the GTT procedure (Figure 1) in lactating cows. There were no significant effects (p>0.05) of infusion or infusion site on GTT curves for blood glucose and insulin concentrations. Following glucose infusion, peak concentration of plasma glucose reflects insulin responsiveness and CR reflects insulin sensitivity (Kahn, 1978). In GTT procedure, higher peak concentration and AUC, slower CR and longer t1/2 exhibit glucose intolerance, which is a symptom of insulin resistance related to impaired insulin action at receptor levels (Kahn, 1978). In the present study, calculated GTT values revealed that, basal and peak concentration (mg/dL), CR (%/min), AUC (mg×min/dL), and t1/2 (min) for glucose and insulin were not affected by starch infusion (p>0.05, Table 6). Interestingly, comparison made between ruminal and abomasal infusion treatments, cows receiving starch through rumen performed better than directly through the abomasum with higher AUC (p = 0.08) and shorter t1/2 (p = 0.11) of plasma insulin. To our knowledge, there is no published data regarding a GTT procedure on cows infused with starch or other energy substances and as a result no related data could be compared with our study. A GTT is a more practical and simple test to provide an indication of glucose disposal and systemic insulin action and can be used as a rough estimate of fuel preference (Wheelock et al., 2010). The rate at which blood metabolite concentrations decline or remain constant following intravenous infusion of glucose could lead to increased utilization or decreased production (Hayirli et al., 2001). For instance, a decrease- in glucose disposal and increase in insulin response to GTT will enhance milk yield (Bauman, 1999). Our study revealed that ruminally infused starch increased glucose disposal, which resulted in lipid accumulation rather than mobilization and as a result milk yield may not be increased. At the same time, abomasal starch infusion did not show any tolerance or intolerance.
Glucose and insulin curves to a glucose tolerance test of cows infused starch with 800 g/d into rumen or abomasum.

Effects of starch infusion at 800 g/d on glucose tolerance test measurements for glucose and insulin in lactating dairy cows
Hepatic and subcutaneous adipose metabolism
As reported by Reynolds (2001), much of the metabolizable energy in infused starch might be used for body tissue synthesis in the early-lactating cows. On the other hand increasing intravenous glucose infusion could improve body condition but not lactation performance in mid-lactating dairy cows (Al-Trad et al., 2009). The relative mRNA abundance of hepatic and subcutaneous adipose gluconeogenic expression (Table 7) were unaffected (p>0.05) by starch infusion either into rumen or into abomasum in low yield lactating cows.
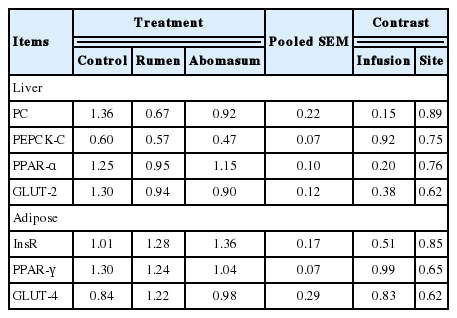
Effects of starch infusion at 800 g/d on relative mRNA abundance in lactating dairy cows
Pyruvate carboxylase and PEPCK are key enzymes in gluconeogenesis. Changes in their amount can be reflected directly by mRNA abundance, whereby an increase can enhance glucogenesis in liver (Li et al., 2005). In the present experiment, additional energy supply did not enhance lactation performance as we expected, which might be a result of the small quantity of infused starch.
InsR can combine with insulin in adipose tissue which can cause regulation of lipid mobilization and metabolism in animals (Zhu et al., 2007). PPAR regulates a variety of target genes that are involved in intra- and extracellular lipid metabolism (Meng et al., 2005). PPAR-alpha is mainly expressedin liver while PPAR-gamma is predominantly expressed in adipose tissue and the immune system in the adult rat (Braissant et al., 1996) and chickens (Meng et al., 2005). GLUT-4 corresponds with muscle glycogen storage (Duhlmeier et al., 2005). Subcutaneous adipose mRNA abundance of the relative enzymes declared in response to starch infusion did not (p>0.05) alter the milk anabolism, which might also be the result of the small quantity of infused starch and a short infusion period. In summary, we concluded that there may be a diversion of lipids from energy-generating pathways to synthesis pathways (Al-Trad et al., 2010) in early lactating dairy cows.
IMPLICATIONS
In this experiment with lactating cows, based on the present milk yield, extra starch infusion at 800 g/d did not enhance energy supplies and improve the lactation performance. However, starch infusion, especially through rumen, enhanced glucose tolerance capability after energy supplementation in low yield lactating cows.
ACKNOWLEDGMENTS
The experiment was supported by National Nature Science Foundation of China (30901030, 31372334).