Effect of Age on Energy Requirement for Maintenance and Growth of Dorper and Hu Crossbred F1 Ewes Weighing 20 to 50 kg
Article information
Abstract
This research aimed to define the energy requirement of Dorper and Hu Hybrid F1 ewes 20 to 50 kg of body weight, furthermore to study energy requirement changes with age and evaluate the effect of age on energy requirement parameters. In comparative slaughter trial, thirty animals were divided into three dry matter intake treatments (ad libitum, n = 18; low restricted, n = 6; high restricted, n = 6), and were all slaughtered as baseline, intermediate, and final slaughter groups, to calculate body chemical components and energy retained. In digestibility trial, twelve ewes were housed in individual metabolic cages and randomly assigned to three feeding treatments in accordance with the design of a comparative slaughter trial, to evaluate dietary energetic values at different feed intake levels. The combined data indicated that, with increasing age, the net energy requirement for maintenance (NEm) decreased from 260.62±13.21 to 250.61±11.79 kJ/kg0.75 of shrunk body weight (SBW)/d, and metabolizable energy requirement for maintenance (MEm) decreased from 401.99±20.31 to 371.23±17.47 kJ/kg0.75 of SBW/d. Partial efficiency of ME utilization for maintenance (km, 0.65 vs 0.68) and growth (kg, 0.42 vs 0.41) did not differ (p>0.05) due to age; At the similar condition of average daily gain, net energy requirements for growth (NEg) and metabolizable energy requirements for growth (MEg) for ewes during late fattening period were 23% and 25% greater than corresponding values of ewes during early fattening period. In conclusion, the effect of age upon energy requirement parameters in the present study were similar in tendency with previous recommendations, values of energy requirement for growth (NEg and MEg) for Dorper and Hu crossbred female lambs ranged between the NRC (2007) recommendation for early and later maturating growing sheep.
INTRODUCTION
Nutritional management would usually be expected to start with the knowledge of nutrient requirement, therefore, an understanding of the nutrient requirement of various sheep breeds is essential for the nutritional management. Some nutritional systems, such as National Research Councils (NRC), Agricultural Research Councils (ARC) and Commonwealth Scientific and Industrial Research Organization (CSIRO) have reported studies on nutrient requirements and dietary utilization, in order to give recommendations for different breeds under different management conditions and diverse production of meat, milk, fiber. But the difference in nutrient requirements are widely varying even among species. Moreover, nutrient requirements are not static, they vary with genetic selection and crossbreeding.
Direct application of nutrient requirement recommendations derived from previous reports on other sheep breeds may result in an excess or deficiency in nutrients. So far, there is no report on the nutrient requirements for Dorper and Hu hybrid F1 sheep, which are characterized by their high fecundity and rapid growth. The objective of this study was to determined energy requirements for maintenance and growth of these crossbred growing ewes using a comparative slaughter technique. Furthermore, we determined energy requirement parameters of this breed ewes during early and late fattening period, to determine how energy requirements change with age and to evaluate the effect of age on energy requirement parameters.
MATERIALS AND METHODS
This study was conducted at the Research and Development Center of Haimen Goats (Haimen, JiangSu, China). Exp. 1 was conducted from December 2011 to March 2012; and Exp. 2 was conducted from June to September 2012. Humane animal care and handling procedures were followed throughout the entire experiment in accordance with procedures approved by the Guide for the Care and Use of Laboratory Animals prepared by the Ethics Committee of Nanjing Agricultural University.
Experiment design and animal management
The entire experiment consisted of two sub experiments. The schematic representation of the experimental design is shown in Figure 1.
Schematic representation of the experimental design. (A) In experiment 1, the baseline, intermediate and final slaughter were launched at the 0, 26, and 56 day of the experiment 1, when average body weight of ewes in ad libitum group reached 20, 28, and 35 kg, respectively. For the ewes used in digestibility trial, when the average body weight of ad libitum group ewes reached 28 kg, all of them were housed in individual metabolic cages and assigned to one of three nutrition treatment groups as above described in the comparative slaughter experiment. (B) In experiment 2, the baseline, intermediate and final slaughter were launched at the 0, 32, and 62 day of the experiment 2, when average body weight of ewes in ad libitum group reached 35, 42, and 50 kg, respectively. When the average body weight of ad libitum group reached 42 kg, all the ewes used in digestibility trial were housed in individual metabolic cages and assigned to nutrition treatment groups as described above in the comparative slaughter trial.
In Exp. 1, forty-two ewes were offered the experiment diet (Table 1) for ad libitum consumption for 10 d until the beginning of the experiment (age of 8 weeks; 20.05±1.43 kg of body weight [BW]). During these days, all of them were treated with avermectin (Qiankun Animal Pharmaceutical Co., Ltd, Chengdu, Sichuan, China) for parasites and housed in individual stalls (approximately 1.5×4 m). Thirty of them were then randomly selected and used in the comparative slaughter trial, the remaining twelve animals were used in the digestibility trial.

Basal diets and nutrient levels of ration
In the comparative slaughter trial, six ewes were randomly selected to slaughtered as baseline group (0th day of the experiment), the remaining twenty-four ewes were randomly assigned to three nutrition treatments based on levels of dry matter intake (DMI), which were ad libitum group (AL, n = 12), low restricted group (LR, restricted to 65% of ad libitum, n = 6) and high restricted group (HR, restricted to 50% of ad libitum intake, n = 6). The selected level of the DMI was intended to make the average daily gain (ADG) of ewes under each nutrition treatment to be approximately 250, 100, and 0 g/d, respectively. Intermediate slaughter (n = 6) was undertaken when the average BW of animals in AL group reached 28 kg. The remaining eighteen ewes in the three nutrition treatment groups (six ewes each group), were slaughtered when the ewes in AL group reached 35kg of BW. The amount of feed offered to the ewes in AL group was adjusted in the morning (08:00 h daily) to a 10% refusal based on the DMI from previous day, ensuring that all animals in AL group had constant and unrestricted access to feed, water was also available ad libitum. The feed and orts were taken daily and stored at −20°C for further analysis. Body weights were recorded per 10 days to measure ADG.
In the digestibility trial, twelve animals were randomly assigned to 3 levels of nutrition treatment groups as described above in the comparative slaughter trial (4 ewes each nutrition treatment group). When the average body weight of AL group reached 28 kg, all of them were housed in individual metabolic cages. The whole trial was conducted in 16 d periods, which consisted of 10 d for adaptation and 6 d for sample collection. The procedure for sample collection and analysis followed the method described by Deng et al. (2012). Fecal and urinary specimens were collected and weighted once a day, a 10 % sample of all these was stored at −20°C for further measurement.
In Exp. 2, forty-two ewes were offered the experiment diet (Table 1) for ad libitum consumption for 18 d until the beginning of the experiment (age of 14 to 15 weeks; 35.68±1.68 kg of BW). The design of comparative slaughter and digestibility trials of Exp. 2 was in accordance with the procedure described in Exp. 1, with minor modifications. In the comparative slaughter trial, baseline, intermediate and final group slaughter occurred when the ewes feed ad libitum reached 35, 42, and 50 kg BW, at the 0th, 32nd, and 62nd day of the experiment, in addition to these, digestibility trial was started when the average BW of ewes under ad libitum treatment reached 42 kg from 32nd to 48th day of the whole experiment, which included 10-day adaptation period and 6-day sample collection period.
Slaughter procedure
At slaughter, animals were fasted and water deprived for 16 hours overnight, with their body weight recorded before and after fasting. The BW of lambs after 16 h fasting and water deprivation was recorded as shrunk body weight (SBW) immediately prior to slaughter by exsanguination. Weights of the blood, viscera, hide, wool, head, feet, carcass, and adipose tissues removed from the internal organs were recorded. The digestive tract was weighed before and after emptying and recorded as gastrointestinal tract (GIT) content, the difference between SBW and GIT was used to determine the empty body weight (EBW). Whole body components were divided into 5 subsamples, which included muscle (removed from carcass head and feet), bone (removed from carcass, head, and feet), fat (carcass fat and vesicle fat), fat-free vesicle (inter organ, digestive tract) and fur (wool and skin removed from carcass, head, and feet). All subsamples, except wool and skin, were cut into small pieces, fully ground and then sampled and stored in −20°C.
Samples collected and chemical analysis
The analyses for dry material (DM), ash content were in accordance with the methods described by AOAC (1990). Gross energy (GE) was measured by XRY-1C bomb calorimeter (JinPeng Instrument Co. LTD, Wenzhou, China). Total N was determined (using Kjetec 2300, Foss, German) based on the procedure introduced by AOAC (1990), corresponding to the crude protein value multiplied by the factor of 6.25. Analyses of acid detergent fiber and neutral detergent fiber were according to Van Soest et al. (1991). Calcium and phosphorus concentration were measured according to the method described previously (Ji et al., 2013). In the comparative slaughter trial, body component samples were collected to determine DM and GE after freeze drying (XianOu-12N freeze dryer, XianOu Instrument Co., Nanjing, China), following procedure described above. Feeds, orts, urinary and fecal samples collected from the digestibility study were used to analyze for GE and DM. Dietary digestibility was calculated by dividing the dietary GE by dietary digestible energy (DE), which was computed from the GE values of the feeds, feeds ort, and feces. Dietary DE was converted to metabolizable energy (ME) by computing the difference between dietary DE less output of urinary energy (determined by the calorie value measured directly) and loss of methane energy (CH4E, as estimated by Blaxter and Clapperton [1965]).
Calculation of energy requirement for maintenance and growth
Initial body energy content of each animal was estimated using prediction equations regressed by body energy against EBW of the lambs from baseline group. These data, along with final body energy content calculated as the sum of the caloric value of all body components collected from comparative slaughter trial, were used to calculate the retained energy (RE). Net energy requirement for maintenance (NEm), metabolizable energy requirement for maintenance (MEm), and partial efficiency of ME utilization for maintenance (km) were determined according to the methods described previously (Galvani et al., 2008); Net energy requirement for growth (NEg), metabolizable energy requirement for growth (MEg) and partial efficiency of ME utilization for growth (kg) were calculated in accordance with the method described by Pires et al. (2000).
Statistical analysis
Statistical analyses were performed using SPSS statistical software program 17.0 (SPSS Inc., Chicago, IL, USA). Values were expressed as the means±standard deviation. Distribution of the data followed the procedure as below, briefly, using Kolmogorov-Smirnov goodness-of fit test to confirm that all the data were in a normal distribution. The data that was confirmed to be distribution normally were used in further statistical analysis. If the data were not normally distributed, further tests were carried out using equivalent nonparametric test. Differences in feed intake, growth performance, and apparent digestibility between three different nutrition treatment groups were evaluated using a one-way analysis of variance. Post hoc differences between treatment groups were further analyzed using Turkey’s test. A p value of less than 0.05 was considered to be statistically significant, the outlier analysis was carried out when the data of each dependent variable was outside the range of 3 times of standard deviation, and the data of one ewe from each experiment were removed from the dataset based on these analysis. Linear regression analysis were conducted with PROM GLM. The assumptions of the models, in terms of homoscedasticity, independency, and normality of errors, were examined by plotting residuals against the predicted values.
RESULTS
Experiment 1: Energy requirement of Dorper and Hu crossbred ewes during early fattening period
Intake and growth performance
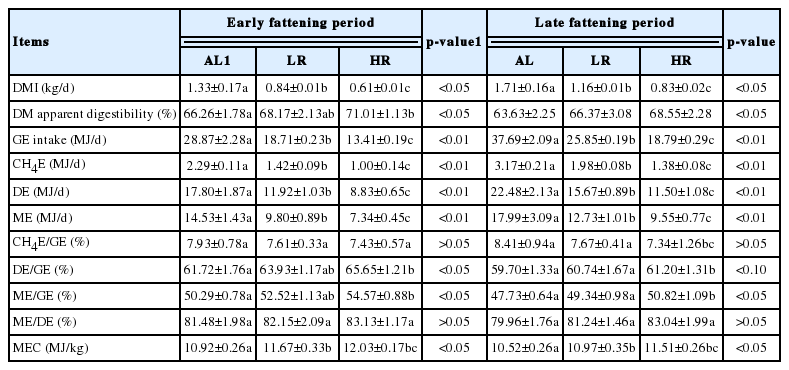
The intake and growth performance of ewes in the present study are illustrated in Table 2. Ewes under AL treatment had 56.10% and 103.18% greater DMI than their counterparts in LR and HR groups, respectively (p<0.01). No significant difference was detected in initial BW between ewes under AL, LR and HR treatment, respectively (p>0.10). Final BW, Net gain of BW and ADG increased with increasing of nutritional intake level (p<0.01), and AL group ewes had greater final BW, Net gain of BW and ADG than those of ewes under either restricted feeding treatments.

Intake and growth performance of Dorper and Hu crossbred ewes fed with three nutrition treaments during early and late fattening period
Methane production and dietary metabolizable energy concentration
Results of the digestibility trial are presented in Table 3. As DMI increased, the daily intake of GE, DE, and ME increased linearly (p<0.01). Compared with the ewes under LR and HR nutrition treatments, ewes in AL group had greater daily CH4E production (2.29 vs 1.42 and 1.00 MJ/d for nutrition treatment of AL, LR, and HR, respectively). Similar CH4E production expressed as GE (CH4E/GE) was detected between AL, LR, and HR groups, but the mean values of CH4E/GE under three nutrition treatment groups showed that the relative CH4E/GE output tended to decrease with decreasing feed intake. The values of DE/GE and ME/GE of the diet were greater (p<0.05) with ewes fed at HR than those of ewes under AL nutrition treatment. The estimated values of metabolizable energy concentration (MEC) were 10.92, 11.67, and 12.03 MJ/kg, for AL, LR, and HR group respectively.
Energetic content of the ration offered to Doper and Hu crossbred ewes under different nutrition treatment during early and late fattening period
Energy requirement for maintenance
Figure 2 A shows that the linear regression equation between heat production (HP) and metabolizable energy intake (MEI) was Log10 (HP, kJ/kg0.75 of SBW/d) = 2.416 (±0.0192)+0.00046 (±0.0000)× MEI (kJ/kg0.75 of SBW/d) (r2 = 0.92; n = 23, p<0.001). In accordance with the procedure described in Materials and Methods, the antilog of the intercept of the linear regression indicated that the NEm was 260.62±13.21 kJ/kg0.75 of SBW/d, and it corresponds to the MEm of 401.99±20.31 kJ/kg0.75 of SBW/d, calculated by iteration of the equation regressed by Log10HP against MEI. The km value, represented by NEm/MEm, was calculated as value of 0.65.

Energy requirement of Dorper and Hu crossbred ewes. (A) Requirement of net requirement for maintenance. (B) Requirement of metabolizable energy for growth. (C) Partial efficiency of metabolizable energy utilization for growth. Triangles and dotted lines indicate the corresponding parameters for ewes during early fattening period when the body weight ranged from 20 to 35 kg; the parameters of ewes in late fattening period when the body weight ranged from 35 to 50 kg are represented by squares and solid lines.
Energy requirement for growth
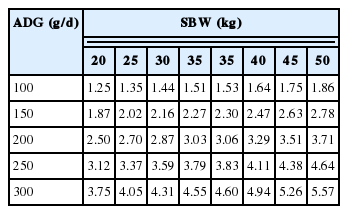
The regression relationship estimating body composition (i.e., body water, fat, and protein) of the ewes from 20 to 35 kg of BW is presented in Table 4. Absolute estimated values of body components at different SBW are illustrated in Table 5, indicating that proportion of body fat increased, whereas whole body protein and whole body water proportion decreased as SBW ranged from 20 to 35 kg. Results of our study suggest that NEg values of ewes with BW ranging from 20 to 35 kg at ADG of 0 to 300 g scaled from 1.25 to 4.55 MJ/d (Table 6), which were obtained from regression equations between EBW and body energy content: Log10 (Final body energy, MJ) = 0.618(±0.143)+1.337(±0.088)× Log10 (EBW, kg), (r2 = 0.92; n = 17, p<0.001). Value of kg, was 0.42, calculated as the slope of the regression between RE and metabolizable energy intake for growth (MEIg, Figure 1C): RE (kJ/kg0.75 of SBW/d) = 5.552 (±6.873)+0.4221(±0.0286)×MEIg (kJ/kg0.75 of SBW/d), (r2 = 0.93; n = 23, p<0.001). The metabolizable energy requirements for growth (MEg) values of ewes from 20 to 35 kg of BW with ADG ranging from 0 to 300 g were scaled from 2.98 to 10.83 MJ/d (Table 7).
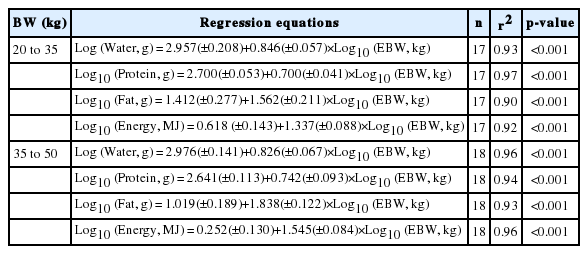
Regression equations developed to estimate final body chemical components and energy content vale of Dorper and Hu crossbred ewes during early and late fattening period

Body chemical components proportion of Dorper and Hu crossbred ewes during early and late fattening periods
Requirement of NEg (MJ/d) for Dorper and Hu crossbred ewes

Requirement of MEg (MJ/d) for Dorper and Hu crossbred ewes
Experiment 2: Energy requirement of Doper and Hu crossbred ewes during late fattening period
Intake and growth performance
As shown in Table 2. AL group ewes consumed 1.28 kg/d during the early fattening period and 1.66 kg/d during the late fattening period and had a greater DMI than their counterparts in LR and HR groups, respectively (p<0.01). Final BW, Net gain of BW and ADG increased with increasing nutritional intake level (p<0.01). Difference in initial BW between ewes under AL, LR, and HR treatment was not detected (p>0.10).
Methane production and dietary metabolizable energy concentration
Results of the digestibility trial for the ewes with BW ranging from 35 to 50 kg are shown in Table 3. As DMI increased, daily intake of GE, DE, and ME increased (p<0.01). Compared with those ewes under LR and HR nutrition treatment, ewes fed ad libitum had greater daily CH4E production (3.17 vs 1.98 and 1.38 MJ/d for ewes under AL, LR, and HR, respectively). Similar relative CH4E loss expressed as GE (CH4E/GE) was detected between AL, LR, and HR groups, but the mean values of CH4E/GE under three nutrition treatment groups showed that the CH4E/GE tended to decrease linearly with decreasing feed intake. Relative intake of DE and ME expressed as GE, DE/GE, and ME/GE, was greater (p<0.05) with the ewes in HR group than that of ewes under AL nutrition treatment. The estimated mean values of MEC were 10.52, 11.37, and 11.51 MJ/kg, for AL, LR, and HR groups respectively.
Energy requirement for maintenance
Figure 2A shows that the linear regression equation between HP and MEI was Log10 (HP, kJ/kg0.75 of SBW) = 2.399(±0.0208)+ 0.00044(±0.0000)×MEI, kJ/kg0.75 of SBW/d (r2 = 0.97; n = 25, p<0.001). The antilog of the intercept of the linear regression indicated that the NEm was 250.61±11.79 kJ/kg0.75 of SBW/d. The MEm was 371.23±17.47 kJ/kg0.75 of SBW/d, calculated by iteration of the equation regressed by log10HP against MEI. The km value, represented by NEm/MEm, was 0.68.
Energy requirement for growth
The regression relationship to estimate body composition (i.e., body water, fat, protein and energy retained values) of the ewes from 35 to 50 kg of BW is presented in Table 4. Absolute estimated values of body components at different SBW are shown in Table 5, as SBW ranged from 35 to 50 kg, the proportion of body fat and body energy increased, whereas body protein and body water proportion decreased. Results of our study suggested that NEg value of ewes at 35 to 50 kg of BW at ADG of 0 to 300 g ranged from 1.53 to 5.57 MJ/d (Table 6), which was obtained from equations regression between EBW and body energy content: Log10 (Final body energy, MJ) = 0.252(±0.130)+1.545(±0.084)×Log10 (EBW, kg), (r2 = 0.92; n = 17, p<0.001). The value of kg was 0.41, calculated as the slope of the regression between RE and MEIg (Figure 2C): RE (kJ/kg0.75 of SBW/d) = −8.772 (±6.97)+0.4125(±0.0170)×MEIg (kJ/kg0.75 of SBW/d), (r2 = 0.95; n = 24, p<0.001). The MEg value of ewes at ADG ranging from 0 to 300 g were scaled from 3.73 to 13.59 MJ/d (Table 7).
Divergence of nutrient requirement between ewes during different fattening periods
The combined data in the present study indicated that NEm, MEm, km, and kg did not differ (p>0.10) due to age; although not statistically different, as age increased, NEm decreased from 260.62±13.21 to 250.61±11.79 kJ/kg0.75 of SBW/d, and MEm decreased from 400.61±20.31 to 371.23±17.47 kJ/kg0.75 of SBW/d. Additionally, in our study, km value calculated from the ewes from 20 to 35 kg of BW was 0.65, which was 4% less than the value (0.68) of ewes with BW ranging from 35 to 50 kg. Results of MEg and NEg values for lambs with various ADG of SBW are presented in Table 6 and 7, indicating that NEg was significantly different (p>0.10) between ewes with different ages, and was 23% greater for ewes with BW ranging from 35 to 50 kg of SBW during late fattening period than for ewes from 20 to 35 kg of SBW during early fattening period. Value of kg obtained for ewes during the early fattening period was slightly greater than that for ewes during late fattening period (0.42 vs 0.41). The MEg of ewes during early fattening period at ADG range from 0 to 300 g were approximately 25% greater than those values determined for ewes during late fattening period at ADG range from 0 to 300 g. Our combined data indicated that the NEg and MEg increased as age increased at a same BW gain level.
DISCUSSION
The NEm value of Dorper and Hu crossbred ewes during early and late fattening periods determined in present study was 260.62 and 250.61 kJ/kg0.75 of SBW/d, which was on average 255.62 kJ/kg0.75 of SBW/d. This average value was 9% greater than the value reported by (NRC, 2007; 234.3 kJ/kg0.75 of SBW/d), and was close to the value (259.4 kJ/kg0.75 of SBW/d) recommended by CSIRO (2007). When expressed as per unit of BW, values of NEm for early (248.44 kJ/kg0.75 of BW/d) and late (238.08 kJ/kg0.75 of BW/d) fattening periods, were both lower than the value (312 kJ/kg0.75 of BW/d) obtained from a comparative slaughter trial with tropic lambs (Silva et al., 2003). As Table 8 shown, proportions of GIT, liver, heart, lung, spleen, kidney proportion of animals in ad libitum group decreased with age increased, which need a higher energy requirement, consequently, represented a greater NEm of ewes during early fattening period. As recommended by (CSIRO) 2007 and NRC (2007), the adjustment for the effect of age on energy requirements for fasting metabolism was: Exp(−0.03×years of age), with years of age greater than 6 set equal to 6. Based on this equation, value of NEm-SBW for ewes during early fattening period (average age was 4 months) was 1.28 kJ per unit of SBW0.75/d greater than that of ewes during late fattening period (average age was 6 months). However, in present study, the discrepancy in NEm between early and late fattening period was 10.01 kJ per unit SBW0.75/d. These data indicated that the adjustment of NEm for ages (4 vs 6 months) recommended by CSIRO was evidently less than that achieved in our study (1.28 vs 10.01 kJ per kilogram of SBW0.75/d). The possible explanation for this discrepancy might be associated with the scope of application for the empirical formula, and the CSIRO recommended equation seemed more suitable to address the effect of age on NEm for the lambs with different ages at the annual interval, however, the discrepancy in ages was approximately 3 months in present study. This age difference was so small that CSIRO recommended adjustment of energy requirement for maintenance for age could not reflect the real difference in NEm between animals with different ages in the present study. In addition, we were obliged to concede that the seasonal factor might result in an inevitable change in appetite (Suttie and Webster, 1995; Tyler et al., 1999; Rhind et al., 2002), as Exp. 1 and Exp. 2 were launched in winter and summer, for younger and older ewes, respectively. Most consistent findings reported lower NEm accompanied with a decrease in level of intake in summer, and this might be a potential factor that contributed to the amplification of discrepancy in NEm with different ages.
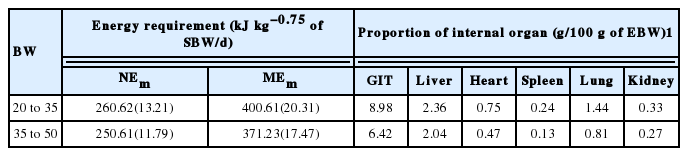
Values of energy requirement for maintenance, internal organs proportion of Dorper and Hu crossbred ewes at different BW
The mean MEm value estimated for ewes during early and late fattening periods (401.99 and 371.23 kJ/kg0.75 of SBW/d) were both less than that of Boer crossbred kids (430.75 kJ/kg0.75 of SBW/d; Fernandes et al., 2007) and indigenous Granadina goats (570.0 kJ/kg0.75 of SBW/d; Prieto et al., 1990), which is in agreement with the observation of a lower fasting metabolism in sheep compared with goats (Cannas et al., 2004). Expressed as per unit of BW, average MEm value (386.61 kJ/kg0.75 of BW/d) of Dorper and Hu crossbred ewes during early and late fattening periods was greater than Baluchi ram lambs (342 kJ/kg0.75 of BW/d; Kamalzadeh and Shabani, 2007) and less than British rams (460 kJ/kg0.75 of BW/d; Dawson and Steen, 1998). As the comparisons above-mentioned were carried out between the previous reports for male lambs and results of female lambs in present study, these discrepancies in MEm may partly be associated with gender, aside from genotypes and diet factors. The slight decrease of MEm obtained in our study indicated that younger ewes with lower BW tended to have greater MEm. As our results show, the km values reported in the present study were 0.65 and 0.68, for early and late fattening periods respectively. Whereas, NRC (2007) recommended a constant (0.644) value for sheep with different ages. These findings indicated that the divergence in effect of age on MEm between the NRC recommendation and present study, might attributed to variation in km between ewes with different ages. When calculated as the equation described by AFRC (1993): km = 0.503+0.35×ME/GE, where ME/GE values in the present study were 0.53 and 0.49, for ewes during early and later fattening period respectively. The predicted values of km would be 0.70 and 0.69, which are approximately 6% and 1% greater than corresponding values in current study, respectively. These finding indicated that adoption of km value of AFRC would underestimate the MEm requirement for Dorper and Hu crossbred ewes, which is in disagreement with the study in Dorper crossbred ram lambs (Deng et al., 2012). We speculate that the explanation for this may partly be associated with gender.
The slightly greater value of kg for ewes in late fattening period (0.41) compared with the corresponding value for ewes in early fattening period (0.42), indicated that younger animals have a higher efficiency of ME utilization for growth. As proposed by NRC (2007), the array of nutrients absorbed, as affected by the nature of the diet, can impact the composition of tissue gain independent of the effect of diets on ADG. Because of the appreciable influence of diet characteristics on kg, diet metabolizability has a larger effect on growth rate than DMI (Cannas et al., 2004). The method to estimate the kg for growing sheep described by (NRC, 2007) is given as; kg = ([1.42×MEC]−[0.174×MEC2]+ [0.0122×MEC3]−1.65)/MEC, where MEC is the ME concentration of the diets. For Dorper and Hu crossbred ewes from 20 to 35 kg of BW, using an average value of MEC (2.76 Mcal/kg of DM) obtained from digestible trial during early fattening period, the NRC predicted value of kg would be 0.44, which was approximately 5% greater than that of our value of 0.42. For Dorper and Hu crossbred ewes ranging from 35 to 50 kg of BW, using average value of MEC (2.66 Mcal/kg of DM) obtained from digestible trial during late fattening period, the estimated value of kg would be 0.42; which is approximately 3% greater of our value of 0.41 in present study. Results of present study suggest that recommendations proposed by NRC would underestimate the kg of both younger and elder ewes in our study. Therefore, adoption of the kg of NRC (2007) would overestimate the MEg for Dorper and Hu crossbred ewes.
Animal body energy content is mainly reflected by the whole body proportion of body fat and protein (Garrett, 1980). As shown in Table 5, the whole body proportion of protein decreased as EBW increased (slope of regression equations are 0.86 and 0.74 for early and late fattening periods, respectively), whereas whole body fat proportion increased with an increasing EBW (slope of regression equations are 1.56 and 1.84 for early and late fattening periods, respectively), hence, the body energy content should increase with stage of maturity. This finding was consistent with our results represented in Figure 2B. The discrepancy in stage maturity between ewes during early and late fattening period was always represented by the difference in body composition (ie. proportion of body protein, water, fat, and illustrated in Table 5). Take body fat proportion relative to EBW as an example, the whole body fat proportion of ewes during early fattening period with a BW ranging from 20 to 35 kg BW was scaled from 127.14 to 174.12 g/kg of EBW, however, the corresponding values of ewes in late fattening period were scaled from 170.96 to 230.52 g/kg of EBW. In addition, our data indicated that ewes with different ages presented a significant divergence in body composition accreted rate at the same level of BW gain, increasing of fat accreted, and decreasing of protein accreted with age increased. This was because of the relative higher concentration of water, and lower absolute value of calories in protein tissues compared with adipose tissues, on the mass or ADG basis the gain of protein is more efficient (NRC, 2007). Hence, NEg increased as the stage of maturity increases. These findings are similar to our results, the NEg values obtained for ewes from 20 to 35 kg of BW were significantly less than that of ewes from 35 to 50 kg of BW at the same level of ADG. For example, NEg values of ewes at ADG of 300 g ranged from 3.64 to 4.46 MJ/d, however, the NEg values of ewes from 35 to 50 kg of BW at ADG of 300 g ranged from 4.50 and 5.47 MJ/d. In conclusion, we suggest that the divergence of NEg between early and late fattening periods might be attributed mainly to variation in growth rates, body composition, and stage of maturity. In comparison with data previously published, our estimated NEg values of Dorper and Hu crossbred with 35 kg of SBW at 300 g of ADG (4.55 MJ/d) is 8% less than value reported for Dorper and thin-tailed Han ewe lambs (4.92 MJ/d; Xu, 2012), whereas 35% greater than value reported for Dorper and thin-tailed Han ram lambs (3.37 MJ/d; Deng et al., 2012). Additionally, compared with body composition of Dorper and thin-tailed Han crossbred female lambs with 20 kg of SBW reported by Xu (2012), our ewes had a relative lower whole body fat proportion (125.74 vs 133.67 g/kg of EBW), but relatively greater whole body protein proportion (214.68 vs 184.26 g/kg of EBW), indicating that there exists a divergence in stage of maturity at the same BW between different genotypes, which resulted in the difference of energy requirements for growth. For ewes of 20 kg BW, NEg values recommended by NRC (2007) for early and late maturating growing rams at ADG of 300 g were 5.73 and 2.63 MJ/d, which are significant greater and less than our values of 3.75 MJ/d, respectively. In conclusion, we suggested that NEg values of Dorper and Hu crossbred ewes ranged between the NRC recommended results of NEg for early and later maturating growing sheep.
CONCLUSION
Comparing the nutrient requirements of ewes between early and late fattening period, NEg, MEg, and km increased while NEm, MEm, and kg declined as age increased. Values of energy requirements for growth (NEg and MEg) ranged between the NRC (2007) recommendation for early and later maturating growing sheep.
ACKNOWLEDGMENTS
This work was supported by the China Agriculture Research System (No.CARS-39) and Special Fund for Agro-scientific Research in the Public Interest (No. 201303144 and 201303143), administrated by Department of Agriculture, China.