Variance Components and Genetic Parameters Estimated for Fat and Protein Content in Individual Months of Lactation: The Case of Tsigai Sheep
Article information
Abstract
The objective of this study was to assess variance components and genetic parameters for fat and protein content in Tsigai sheep using multivariate animal models in which fat and protein content in individual months of lactation were treated as different traits, and univariate models in which fat and protein content were treated as repeated measures of the same traits. Test day measurements were taken between the second and the seventh month of lactation. The fixed effects were lactation number, litter size and days in milk. The random effects were animal genetic effect and permanent environmental effect of ewe. The effect of flock-year-month of test day measurement was fitted either as a fixed (FYM) or random (fym) effect. Heritabilities for fat content were estimated between 0.06 and 0.17 (FYM fitted) and between 0.06 and 0.11 (fym fitted). Heritabilities for protein content were estimated between 0.15 and 0.23 (FYM fitted) and between 0.10 and 0.18 (fym fitted). For fat content, variance ratios of permanent environmental effect of ewe were estimated between 0.04 and 0.11 (FYM fitted) and between 0.02 and 0.06 (fym fitted). For protein content, variance ratios of permanent environmental effect of ewe were estimated between 0.13 and 0.20 (FYM fitted) and between 0.08 and 0.12 (fym fitted). The proportion of phenotypic variance explained by fym effect ranged from 0.39 to 0.43 for fat content and from 0.25 to 0.36 for protein content. Genetic correlations between individual months of lactation ranged from 0.74 to 0.99 (fat content) and from 0.64 to 0.99 (protein content). Fat content heritabilities estimated with univariate animal models roughly corresponded with heritability estimates from multivariate models: 0.13 (FYM fitted) and 0.07 (fym fitted). Protein content heritabilities estimated with univariate animal models also corresponded with heritability estimates from multivariate models: 0.18 (FYM fitted) and 0.13 (fym fitted).
INTRODUCTION
There can be found two different strategies of using of test day measurements of sheep milk (Oravcová, 2014): repeatability animal models in which daily milk yield is treated as repeated measures of the same trait and analyses of single test day records separately using multivariate animal models which treat daily milk yield in individual months of lactation as a different trait. For dairy sheep, such modelling is known not only for daily milk yield, but also for separate analyses of protein content (Serrano et al., 2001) or fat and protein content (Volanis et al., 2002; Komprej et al., 2011). In addition to heritability estimates, the second approach enables estimates of genetic correlations between daily milk yields grouped by month of lactation (fat contents and protein contents, respectively) which tend to be higher between adjacent months (Ali and Schaeffer, 1987; Komprej et al., 2011). The animal model treating milk yield in individual months of lactation as a different trait was applied for Tsigai breed in Slovakia (Oravcová, 2014). The animal model treating fat or protein content in individual months of lactation as a different trait has not been applied in Slovak sheep until now. Moreover, no comparisons between multivariate and univariate models for fat or protein content have been done in Slovak sheep until now.
The objective of this study was to assess variance components and genetic parameters for fat and protein content in individual months of lactation using a multivariate animal model (each trait analysed separately) using alternative strategies of treating flock-year month effect: a fixed and a random effect. The estimated genetic parameters and variance ratios are discussed and compared with estimates from repeatability univariate animal models in which fat content and protein content were treated as the same effect, regardless of month of lactation. Flock-year month effect was treated either as a fixed or as a random effect also in univariate analyses. The analyses were performed on test day data of Tsigai breed.
MATERIALS AND METHODS
Data
Data for analyses were test day records of 23,215 Tsigai ewes from 51 flocks collected between 1995 and 2010 by the State Breeding Services of the Slovak Republic. The corrected monthly test for evening/morning milk recording system of ICAR rules (International Committee for Animal Recording, 2011) was applied. Fat and protein content were determined by routine laboratory procedures using the automated infrared method (STN 57 0536; Slovak Standards Institute, 1995). Only records with fat and protein content measurements between the second and the seventh month of lactation were taken into account. Restriction was due to fact that most of test day measurements were taken in these six months. Each ewe had at most one record with fat and protein content in each month (Komprej et al., 2011). Following the procedure indicated by these authors, if a ewe had more than one record in one month, only one was kept within this month and the other was moved to a different month. The second month of lactation consisted of records between days 40 and 69 after parturition, the third month of lactation consisted of records between days 67 and 99 after parturition, the fourth month of lactation consisted of records between days 88 and 130 after parturition, the fifth month of lactation consisted of records between days 102 and 159 after parturition, the sixth month of lactation consisted of records between days 133 and 189 after parturition, and the seventh month of lactation consisted of records between days 181 and 210 after parturition. Only records with known lactation number and age of ewe, known litter size, days in milk and flock-year-month of measurement were considered. At least 6 test day records per flock-year-month effect were required. The number of test day records in the second, third, fourth, fifth, sixth and the seventh month of lactation was 8,779, 35,733, 39,321, 37,099, 28,464 and 3,393, respectively. In total, 152,789 test day records were included. The number of test day records per lactation was between two and seven.
Pedigree consisted of 34,204 animals. Of these, 1,851 were sires and 18,165 were dams. The number of animals with unknown sire and dam (base animals) was 6,306 and the number of non-base animals was 27,898. The number of animals with both parents known was 25,756. The number of animals with only unknown sire and with only unknown dam was 1,487 and 655, respectively.
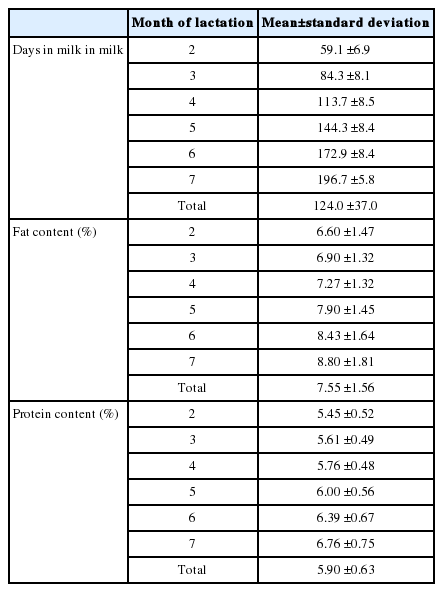
Basic statistics (means and standard deviations) for days in milk, and fat and protein content in individual months of lactation are given in Table 1. The overall means and standard deviations (regardless of month of lactation) are also presented.
Basic statistics for fat and protein content (by month of lactation)
Statistical analysis
Preliminary statistical analyses were done using general linear model (GLM procedure) in SAS (SAS Institute Inc., 2009). (Co)variance components estimation (VCE) was done using restricted maximum likelihood method in VCE6 (Groeneveld et al., 2010). Alternative multivariate and univariate animal models fitting flock-year-month either as a fixed or random effect, accounting for further fixed and random effects were applied. Fixed and random effects considered were based on actual investigations and previous studies of dairy sheep in Slovakia (Oravcová et al., 2005; Oravcová and Peškovičová, 2008).
Two approaches were employed. First, multivariate animal models in which fat and protein content in individual months of lactation were treated as different traits were used. This approach enables estimation of, in addition to heritability estimates of fat and protein contents separately for each month of lactation, genetic correlations between fat contents grouped by month of lactation and between protein contents grouped by month of lactation (multivariate Model 1 and 2 for both fat and protein content). Second, univariate animal models with fat and protein treated as repeated measures of the same traits were used (univariate Model 3 and 4 for both fat and protein content).
The fixed effects considered were lactation number (1, 2 and 3+), litter size (1 and 2+) and days in milk. Days in milk were modelled as linear regressions. The random effects were considered animal genetic effect and permanent environmental effect of ewe. The effect of flock-year-month was fitted either as a fixed (F YM, Models 1 and 3) or random (fym assigned as f, Models 2 and 4) effect. Flock-year-month effect in multivariate analyses consisted of 290, 651, 740, 704, 465, and 105 levels, respectively. Flock-year-month effect in univariate analyses consisted of 1,501 levels. Permanent environmental effect of ewe consisted of 23,215 levels (regardless of model used).
The matrix notation of the models (either multivariate or univariate) is as follows:
where y is a vector of observations of fat and protein content, respectively, matrix X is an incidence matrix and β is a vector of unknown parameters for fixed effects, i.e., lactation number, litter size, linear regression on days in milk and FYM when it was treated as a fixed effect. Vectors of unknown parameters for random effects are as follows: a for animal genetic effect, p for permanent environmental effect of ewe and f for flock-year-month, e is a vector of residuals; Za, Zp and Zf are corresponding incidence matrices. Model 1 is assigned as a multivariate model and Model 3 is assigned as a repeatability univariate model for fat and protein content (each considered separately) involving FYM as a fixed effect. Model 2 is assigned as a multivariate model and Model 4 is assigned as a repeatability univariate model for fat and protein content (each considered separately) involving f as a random effect.
The expected values can be presented as follows:
Phenotypic variance (V) composed of variance components for random effects of animal genetic (G), permanent environmental of ewe (P), flock-year-month (F) and residual (R) can be presented as follows:
where matrices Ip and If are the identity matrices for permanent environmental effect of ewe and flock-year-month effect. The order of identity matrices is equal to number of levels for each random effect. Levels for all random effects and residual are assumed to be uncorrelated, except for genetic effect, where relationships among levels are described by relationship matrix A. The measurements are correlated within each level for individual random effect; this is shown with variances (and covariances) in matrices G0 for animal genetic effect, P0 for permanent environmental of ewe, F0 for flock-year-month and R0 for residual. Symbol ∑⊕ presents a direct sum; due to animals with some missing records throughout lactation, the matrix of residual is a direct sum of matrices R0k. Residuals are assumed to be independent and normally distributed.
RESULTS AND DISCUSSION
The mean values of fat and protein content are presented in Table 1. Both fat and protein content increased with an increasing number of days in milk, showing the opposite trend to the trend of milk yield throughout lactation (Oravcová, 2014). Fat content ranged from 6.60% to 8.80% (with an average value of 7.55%). Protein content ranged from 5.45% to 6.76% (with an average value of 5.90%). Fat and protein content of Tsigai sheep were slightly higher or almost the same than those reported for Slovenian breeds (Komprej et al., 2011) and Greek Sfakia dairy sheep (Volanis et al., 2002). Protein content of Spanish Manchega breed (Serrano et al., 2001) was higher than protein content of Tsigai sheep, even though milk yield of Tsigai sheep was lower than that of Manchega breed.
The variance ratios estimated for random effects by multivariate analyses are given in Table 2. The heritabilities and variance ratios estimated for permanent environmental effect of ewe were slightly higher when flock-year-month (FYM) was fitted as a fixed effect (Model 1), regardless of trait studied. The heritabilities estimated for fat content increased from 0.06 (second month) to 0.15 and 0.17 (fourth and fifth month); afterwards, heritability decreased to 0.14 (seventh month). The heritabilities estimated for protein content increased from 0.16 (second month) to 0.23 (fourth month). Afterwards, heritability decreased to 0.19 and 0.15 (sixth and seventh month). The variance ratios estimated for permanent environmental effect of ewe ranged from 0.04 (seventh month) to 0.11 (fourth and fifth month) when fat content was analysed and from 0.13 (seventh month) to 0.20 (second month) when protein content was analysed. When fym was fitted as a random effect, a decrease of heritability estimates and variance ratios of permanent environmental effect of ewe was observed for both traits. The heritabilities for fat and protein content were estimated between 0.06 (second month) and 0.11 (sixth month) and between 0.10 (seventh month) and 0.18 (fourth month), respectively. The variance ratios estimated for permanent environmental effect of ewe were between 0.02 (seventh month) and 0.06 (fourth, fifth and sixth month) when fat content was analysed and between 0.08 (seventh month) and 0.12 (second, fourth and fifth month) when protein content was analysed. With known random effects, the highest proportion of variance was explained by fym effect, regardless of trait. This ranged from 0.39 (second and seventh month) to 0.42 and 0.43 (fifth and fourth month) when fat content was analysed and from 0.25 (fourth month) to 0.35 and 0.36 (sixth and seventh month) when protein content was analysed. The total phenotypic variance increased by about 30% (for fat content) and by about 40% (for protein content) when fym was fitted as a random effect. The residual variance ratios were less than or equal to 0.5 (Model 2) for both traits. When Model 1 was applied, the residual variance ratios estimated for fat content differed to a greater extent (0.73 to 0.84 vs 0.41 to 0.46).

Variance ratios for random effects and total phenotypic variance for fat and protein content (multivariate models)
The comparison of heritability and variance ratios estimated for fat and protein content in Tsigai sheep with those found in literature is not easy since different models are reported. The exception, in part, is a study of Komprej et al. (2011) who used a similar model as the Model 2 here (differences only in fixed part of the model). As an additional difference to our research, these authors analysed eight months of lactation. The heritabilities estimated for Slovenian sheep (from the second to the seventh month of lactation) were about 20% to 40% (fat content) and about 30% to 50% (protein content) higher than heritabilities estimated for Tsigai breed. The variance ratios estimated for permanent environmental effect of ewe were lower in Slovenian sheep; differences were found higher for protein content than for fat content. The variance ratios for fym were also lower in Slovenian sheep, regardless of trait. Serrano et al. (2001) who used the model with only additive genetic effect as a random effect reported higher heritabilities for protein content in Manchega sheep in the first four months of lactation (between 0.22 and 0.29 when flock-test day was considered, and between 0.21 and 0.25 when flock-year-season of lambing was considered). The considerably higher heritabilities for fat and protein content (from 0.32 to 0.52 and from 0.44 to 0.55) were reported for Sfakia breed by Volanis et al. (2002).
Genetic correlations estimated for fat and protein content (from the second to the seventh month of lactation) are presented in Table 3. The genetic correlations decreased from 0.99 to 0.74 for fat content and from 0.99 to 0.64 for protein content (Model 2). They were higher between adjacent months of lactation and dropped for months which were apart. The genetic correlations were similar between the Models 1 and 2 and did not differ more than 0.05 and 0.03. Similarly to daily milk yield (Oravcová, 2014), the trend in genetic correlations confirmed that fat and protein content in different months of lactation of Tsigai sheep are not genetically the same traits since they are less than unity between distinct months of lactation (Swalve, 1995; Komprej et al., 2011). The genetic correlations estimated for fat and protein content of Tsigai sheep accord with findings of Komprej et al. (2011) who reported genetic correlations ranging from 0.98 to 0.48 (fat content) and from 0.96 and 0.64 (protein content) between those months of lactation which correspond with our analyses. When interval between months of lactation increased (Komprej et al., 2011), genetic correlations decreased and the lowest genetic correlation (0.09) was estimated between the first and the eighth month of lactation (for protein content). Serrano et al. (2001) found genetic correlations (protein content) ranging from 0.99 between adjacent months of lactation and reported a decrease to 0.53 and 0.50 between the first and the fourth month of lactation in Manchega breed (in dependence of fact whether the effect of flock-year-season of parturition or of flock-test day of daily protein measurement was considered).
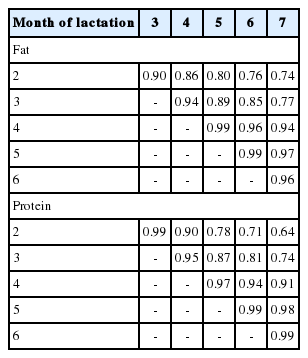
Genetic correlations for fat and protein content between individual months of lactation (Model 2)
Fat and protein content heritabilities estimated with univariate animal models are presented in Table 4. The heritability estimates (0.13 and 0.18 when FYM was fitted, and 0.07 and 0.13 when fym was fitted) were almost the same or slightly lower than those obtained from multivariate analyses (when average values were calculated from heritability estimates of fat and protein content in individual months of lactation). Serrano et al. (2001) reported lower heritability estimates for protein content when univariate model treating protein content as repeated measures of the same trait was applied. The lower heritability estimates for fat and protein content (when both these traits were treated as a single trait) were also found by Komprej et al. (2009; 2011). However, the comparisons may not be unequivocal since the authors used slightly different models for univariate and multivariate analyses (differences in permanent environmental effects). According to expectations, the lower phenotypic variance in univariate analyses was found when FYM was fitted as a fixed effect, similarly as in multivariate approach. The heritability, variance ratios for permanent environmental effect of ewe and residual variance ratio were higher in this case (Models 3 vs Models 4). In literature, flock-test-day effect in sheep is more often treated as a fixed (Baro et al., 1994; Serrano et al., 2001; Bauer et al., 2012) than as a random effect (Komprej et al., 2011). Since many levels of flock-year-month effect occurred and number of observations within its levels varied in both multivariate and univariate analyses, these were viewed as random samples from a wider population, i.e. not only particular estimates of levels of flock-year-month effect, but also estimations of general influence of this effect on variability of fat and protein content were of interest (Oravcová et al., 2005), fixed and random flock-year-month effects were alternatively included in the models.
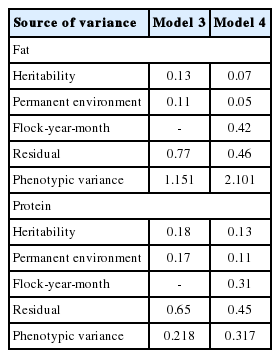
Variance ratios for random effects and total phenotypic variance for fat and protein content (univariate models)
IMPLICATIONS
The variance ratios and heritabilities for fat and protein content of sheep milk using multivariate models in which fat and protein content in individual months of lactation were treated as different traits and univariate models in which fat and protein content were treated as repeated measures of the same traits were estimated. The highest impact of flock-year-month effect on distribution of phenotypic variance for fat and protein content was found. Heritability estimates were slightly higher for protein content than those for fat content, regardless of model used. For protein content, the genetic correlations between individual months of lactation varied to a greater extent.
ACKNOWLEDGMENTS
The author thanks the Breeding Services of the Slovak Republic for making the data available. The work was supported by the Ministry of Agriculture and Regional Development of the Slovak Republic (Contract No. RUVV0910503//16/00001). This article was possible through the project MLIEKO 26220220196 funded by the Operational Program for Research and Development of the European Regional Development Fund.
Notes
CONFLICT OF INTEREST
We certify that there is no conflict of interest with any financial organization regarding the material discussed in the manuscript.