Characterization of Odorant Compounds from Mechanical Aerated Pile Composting and Static Aerated Pile Composting
Article information
Abstract
We studied airborne contaminants (airborne particulates and odorous compounds) emitted from compost facilities in South Korea. There are primarily two different types of composting systems operating in Korean farms, namely mechanical aerated pile composting (MAPC) and aerated static pile composting (SAPC). In this study, we analyzed various particulate matters (PM10, PM7, PM2.5, PM1, and total suspended particles), volatile organic compounds and ammonia, and correlated these airborne contaminants with microclimatic parameters, i.e., temperature and relative humidity. Most of the analyzed airborne particulates (PM7, PM2.5, and PM1) were detected in high concentration at SAPC facilities compered to MAPC; however these differences were statistically non-significant. Similarly, most of the odorants did not vary significantly between MAPC and SAPC facilities, except for dimethyl sulfide (DMS) and skatole. DMS concentrations were significantly higher in MAPC facilities, whereas skatole concentrations were significantly higher in SAPC facilities. The microclimate variables also did not vary significantly between MAPC and SAPC facilities, and did not correlate significantly with most of the airborne particles and odorous compounds, suggesting that microclimate variables did not influence their emission from compost facilities. These findings provide insight into the airborne contaminants that are emitted from compost facilities and the two different types of composting agitation systems.
INTRODUCTION
Composting is a naturally occurring biochemical process utilizing controlled aerobic decomposition of organic material. The product of composting is a moist, crumbly, soil-like product with a tolerable, earthy odor that is used as a natural fertilizer and soil conditioner for agricultural land. Compost is widely considered to be a low-cost and environmentally friendly method of managing and treating solid organic waste. There are several advantages of compost when used in adequate amounts and with proper management, which includes providing a wide range of nutrients to soils, increasing soil organic content, improving water holding capacity and other physical properties of soil (Wells et al., 2000). In addition, compost application benefits essential soil organisms and reduces plant pathogens, which facilitates improved growth and higher yields of a variety of crop plants (D’Hose et al., 2012).
However, compost facilities that contain feedstock’s or compost piles that are not well maintained may emit substantial and offensive odors (Tsai et al., 2008). In such circumstances, composting may be producing and releasing volatile organic compounds (VOCs) and ammonia due to intense microbial activity (Hellebrand, 1998). VOCs are organic compounds that melt at temperatures lower than room temperature and have boiling points between 50°C to 260°C (World Health Organization, 1989). VOCs include nitrogen-based compounds, sulfur-based compounds, volatile fatty acids, hydrocarbons, trepans, esters, ethers, alcohols, and aldehydes/ketones (Smet et al., 1999). The VOCs generated by composting can be evaluated in terms of two processes: the production within the pile due to degradation of organic matter and emission from the pile surface following gas convection within the pile. In several previous studies, it was found that most VOCs were emitted in the former (i.e., degradation of organic matter) phase of composting than in the latter (i.e., surface emission) phase (Eitzer, 1995; Turan et al., 2007; Kumar et al., 2011).
In South Korea, approximately 46.5 million tons of animal manure are produced annually and approximately 87% of this is applied to farm lands as compost and liquid organic fertilizer (Ahn et al., 2011). Two types of composting systems are primarily used on Korean farms, namely mechanical aerated pile composting (MAPC) and aerated static pile composting (SAPC). However, there is at present no research that characterizes the entire range of odorants and their correlation to microclimate variables in these systems. Therefore, the objective of the present study is to identify the various odorants emitted from these composting facilities and to correlate the microclimatic variables with the emitted odorants according to type of composting system.
MATERIALS AND METHODS
Experimental site description, sample collection and analysis of microclimatic variables
Ten compost facilities located within South Korea were chosen for sampling, depending on the type of composting system used, i.e., SAPC and MAPC; details about the composting systems are presented in Table 1. Most of the manure used in each of the ten compost facilities originated from the farm itself. Duplicate experiments were carried out on newly formed compost windrows (36 days old) between September and October of 2012, respectively. Strongly emitting or ‘hot’ locations in the sources were not sought out. We used environmental flux chambers to collect the emissions from the tipping pile or compost windrows at each of the compost facilities. The collected emissions were analyzed in the laboratory for VOC composition and ammonia. A hygrothermograph was used to measure air temperature and relative humidity (SK-110TRH, SATO, Tokyo, Japan).
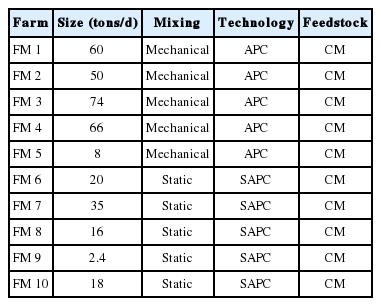
Summary of visited compost facilities
Analysis of airborne particulates and odorants
Particulate matter (PM) was analyzed using an aerosol mass monitor (GT-331, SIBATA, Soca-city, Japan) and the mass concentrations of PM10 (PM average aerodynamic diameter: 10 μm), PM7 (PM average aerodynamic diameter: 7 μm), PM2.5 (PM mean aerodynamic diameter: 2.5 μm), PM1 (PM mean aerodynamic diameter: 1 μm), and total suspended particles were obtained simultaneously, with a flow rate of 2.83 L/min.
A low-volume air sampler was used to collect the samples for ammonia analysis (No. 800510, Gilian, Clearwater, FL, USA) at a speed of 2 L/min for 3 min, absorbed by 0.5% boric acid. An indophenols method, based on the appearance of an indophenol blue pigment that forms when phenol reacts with hypochlorite in the presence of ammonia (Weatherburn, 1967; Lewandowska and Falkowska, 2004), was used to determine ammonia concentrations. The detection limit for ammonia using this method is 0.44 mg/L. A total of 11 different types of VOCs were analyzed in this study, which included two sulfuric compounds (dimethyl sulfide [DMS] and dimethyl disulfide [DMDS]); six volatile fatty acids (acetic acid, propionic acid, butyric acid, iso-butyric acid, valeric acid and iso-valeric acid); two indolics (indole and skatole); and one phenolic (p-cresol). The air was sampled for 5 min using a 1 L Tedlar bag (No.22053, Restek, Bellefonte, PA, USA). The collected air samples were analyzed using gas chromatography/mass spectrometry (GC/MS) (Agilent GC6890N/5975C MS, Youngin, Korea) in the laboratory, and all samples were analyzed within 4 hours of sample collection. Solid-phase microextraction (SPME) fibers (Solid Phase Microextraction Fiber, Supelco, Bellefonte, PA, USA) consisting of 75-mm carboxen-polydimethylsiloxane were used for the analysis. Samples were extracted by using SPME fibers for 10 min with a manual fiber holder from Supelco (USA). Following extraction, the SPME fiber was removed from the Tedlar bag and immediately inserted into the injection port of the GC/MS for analysis. The reabsorption time of a SPME fiber was 5 min at 250°C with a 0.75 mm injection port liner. The temperature program used was as follows: 35°C initial, 5-min hold; 6°C min/L to 140°C, 0-min hold; 15°C min/L to 220°C, 3-min hold. The concentrations were calculated as the parts per billion (ppb, nmol mol/L) and milligram per cubic meter.
Standards and calibration
For DMS and DMDS, a mixed standard gas (10.4 ppm DMS and 9.9 ppm DMDS, Research Institute of Gas Analytical Science, South Korea) was used for the quantification. For other compounds, the calibrations were accomplished through the use of the headspace method for Henry’s constants (Chai et al., 2005). All of the reagents were purchased from Sigma-Aldrich (St. Louis, MO, USA): acetic acid (99.7%), propanoic acid (99.5%), bButyric acid (99%), isobutyric acid (99%), valeric acid (99%), isovaleric acid (99%), indole (99%), skatole (98%) and p-cresol (99%). The stocking solutions of volatile organic acids were diluted with triple-distilled water, while the stocking solutions of the Indolics and p-cresol were diluted with methanol (99.9%, Sigma-Aldrich, USA). The stocking solutions were diluted progressively with triple-distilled water and analyzed with a relative headspace method for Henry’s constants (Chai et al., 2005). The detection thresholds, molecular weights and retention times of the target odorous compounds are shown in Table 2. Recovery of these VOCs in Tedlar bags was greater than 85% under similar experimental conditions.

Summary of volatile organic compounds (VOCs) quantified in the study using gas chromatography/mass spectrometry
Statistical analysis
Statistical evaluations were carried out using an SPSS software package (SPSS Inc., Chicago, IL, USA). Comparisons of each variable across different farms were first performed with standard t-tests of equality of means at a 5% significance level. For multiple comparisons between means of a factor, we used Bonferroni corrections with an α-value of 0.05. Pairwise correlations (Kendall’s τ-b correlation coefficients) were calculated among the different factors, such as microclimate variables, PM, VOCs, and odorous compounds.
RESULTS AND DISCUSSION
Microclimate variables in the compost facilities
Means of microclimate variables in compost facilities are presented in Table 3. The mean values of temperature in the different compost plants across the two agitation systems were 30.5°C and 28°C for MAPC and SAPC, respectively (Table 3). However, the mean values of relative humidity were 66.3% and 52.8% for MAPC and SAPC, respectively (Table 3). The microclimate variables did not vary significantly between MAPC and SAPC (all p>0.05). Because of the high temperature, farm managers maximized ventilation in order to increase the convection heat loss of the compost facilities in all types of farms.
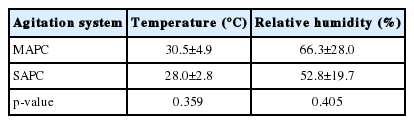
Means of the microclimate variables in MAPC and SAPC systems
Particulate matter and odorous compounds in composting facilities
Mean values of airborne particulates and odorous compounds in the composting facilities is shown in Table 4. The concentrations of most of the airborne particulates (PM7, PM2.5, and PM1) were high in SAPC facilities compared to MAPC, however these differences were non-significant (Table 4). Similarly, most of the analyzed VOCs concentrations were not varied significantly between MAPC and SAPC facilities (Table 4), except for DMS and skatole concentrations (Table 4), with the DMS concentration being significantly higher in MAPC and the skatole concentration being significantly higher in SAPC. Several previous studies have shown DMS to be one of the typical sulphur compounds emitted during the composting process (Krauss et al., 1992; Smet et al., 1999). The concentration of ammonia was higher in MAPC compared to SAPC, however this difference was statistically non-significant. For ammonia, the threshold limit value of the time-weighted average is 25 mg/L (ACGIH, 2013). In this study, the ammonia concentrations in MAPC and SAPC facilities were ranged from 81.7 mg/L to 420 mg/L and 4 mg/L to 191.7 mg/L, respectively. On an average, in both MAPC and SAPC facilities ammonia concentration was higher than the threshold limit value, a finding that is in accordance with several previous studies (Radon et al., 2002; Hayes et al., 2006).

Airborne particulates and odorants detected in MSAPC and SAPC
Correlations between microclimate variables and airborne particles and odorants
Kendall’s τ-b correlation coefficients of microclimate variables and PM are presented in Table 5. All of the significant correlations between airborne particulates and temperature were negative (Table 5), whereas all of the significant correlations between airborne particulates and relative humidity were positive (Table 5). When temperature was correlated to odorants concentration, most of the correlation values were negative but non-significant (Table 6), except for VS, which was significantly negatively correlated with temperature (Table 6). Similarly, there was no significant correlation between most of the odorants and relative humidity (Table 6), with the exception of DMDS and p-cresol, the concentrations of which were positively correlated with relative humidity (Table 6). These results suggest that microclimate variables (temperature and relative humidity) are not the major determinants of the emission of odorous compounds from the compost facilities.

Kendall’s correlation coefficients for microclimate variables with particulate matter (PM)

Kendall’s correlation coefficients for microclimate variables with odorants
In conclusion, the microclimate variables studied here (temperature and relative humidity) did not vary between the two different types of composting agitation systems (MAPC and SAPC). Most of the airborne particles concentration was higher in SAPC compared to MAPC, though these differences were statistically non-significant. Similarly, the concentrations of most of the odorous compounds did not vary significantly in both types of composting agitation systems, except for DMS and skatole, with DMS concentrations higher in MAPC and skatole concentrations higher in SAPC. Furthermore, the microclimate variables were not significantly correlated with most of the airborne particles and odorous compounds, indicating that the microclimate variables did not influence their emission from the compost facilities. Overall, these findings provide an insight to the airborne contaminants emitted from two different type of composting agitation systems that dominate composting facilities in South Korea. To gain further understanding, there is a need for further more extensive sampling in both MAPC and SAPC facilities, at different times of year. Future research should also focus on strategies to reduce the emission of these airborne contaminants.
ACKNOWLEDGMENTS
The authors acknowledge Hye-Jin Kang having helped in collecting data in the field. We are thankful to the Korea Institute of Planning and Evaluation for Technology in Food, Agriculture, Forestry, and Fisheries (IPET) from the Ministry of Agriculture, Food, and Rural Affairs (MAFRA) through project no. 312036-03-2-HD030, and in part by Korea Institute of Energy Technology Evaluation and Planning (KETEP) from the Ministry of Trade, Industry and Energy (MOTIE) through project no. 2012-3020090040 to support this work.
Notes
CONFLICT OF INTEREST
We certify that there is no conflict of interest with any financial organization regarding the material discussed in the manuscript.