Rumen Degradability and Small Intestinal Digestibility of the Amino Acids in Four Protein Supplements
Article information
Abstract
The supplementation of livestock feed with animal protein is a present cause for public concern, and plant protein shortages have become increasingly prominent in China. This conflict may be resolved by fully utilizing currently available sources of plant protein. We estimated the rumen degradability and the small intestinal digestibility of the amino acids (AA) in rapeseed meal (RSM), soybean meal (SBM), sunflower seed meal (SFM) and sesame meal (SSM) using the mobile nylon bag method to determine the absorbable AA content of these protein supplements as a guide towards dietary formulations for the dairy industry. Overall, this study aimed to utilize protein supplements effectively to guide dietary formulations to increase milk yield and save plant protein resources. To this end, we studied four cows with a permanent rumen fistula and duodenal T-shape fistula in a 4×4 Latin square experimental design. The results showed that the total small intestine absorbable amino acids and small intestine absorbable essential amino acids were higher in the SBM (26.34% and 13.11% dry matter [DM], respectively) than in the SFM (13.97% and 6.89% DM, respectively). The small intestine absorbable Lys contents of the SFM, SSM, RSM and SBM were 0.86%, 0.88%, 1.43%, and 2.12% (DM basis), respectively, and the absorbable Met contents of these meals were 0.28%, 1.03%, 0.52%, and 0.47% (DM basis), respectively. Among the examined food sources, the milk protein score of the SBM (0.181) was highest followed by those of the RSM (0.136), SSM (0.108) and SFM (0.106). The absorbable amino acid contents of the protein supplements accurately reflected protein availability, which is an important indicator of the balance of feed formulation. Therefore, a database detailing the absorbable AA should be established.
INTRODUCTION
A proper balance of the amino acids (AA) in the diet of dairy cattle is desirable because it may increase the level of milk protein (Paz et al., 2014). Many researchers report that increases in dietary protein levels do not necessarily improve the milk production of dairy cows (Chiou et al., 1995), which may be due to imbalances in the AA profile of the rumen undegraded protein (RUP) or dietary protein degradation in the rumen that exceeds the capability of microbial proteins synthesized by rumen microorganisms (Chiou et al., 1995; Van Straalen et al., 1997; Abu-Ghazealeh et al., 2001). For the diet of dairy cows, profile AA and digestibility of RUP are estimated in a similar value as the initial protein supplements via the dairy NRC (2001) model. However, these estimates may be inaccurate, and studies have shown that the AA profiles of the RUP of protein concentrates differ from those in the original feed (Erasmus et al., 1994; Mjoun et al., 2010; Maxin et al., 2013). To satisfy the AA demands of highly lactating cows, a sufficient amount of RUP must complement the AA supplied by the microbial crude protein (CP) and endogenous sources (NRC, 2001). Therefore, the rumen degradability (RD) of the feed AA and small intestinal digestibility (SID) of rumen undegraded AA of the feed need to be determined (Borucki-Castro et al., 2007). However, little information is available on the SID of individual AA in common feeds (Von Keyserlingk and Mathison, 1989; Mjoun et al., 2010), which is not easily determined. The reason was that the mobile nylon bag method is a most widely accepted method to determine SIDs of AAs of protein supplements, but it requires the animal to be fitted with ruminal, duodenal and sometimes ileal fistula, which is expensive and may cause harm to the animals. Consequently, data of SIDs of AAs of protein supplements determined by mobile nylon bag (MNB) method are scarce. Domestic data on the SIDs of AAs are small, although there are several foreign reports for the RDs and SIDs of AAs of the protein supplements. However, protein supplements produced in China are different from those produced in other countries, due to China’s climatic conditions, light conditions and variety etc., and methods of handicraft workshops for extraction of oil in China are various. Therefore, these foreign databases applied to evaluate the nutritional values of protein supplements are impractical, and it is necessary to evaluate the RD and SID of AAs systematically in China. The AA composition of the RUP fraction and the SID of RUP are necessary to determine the absorbable protein content accurately (Harstad and Prestløkken, 2001). The absorbable AA content of protein supplements accurately reflects protein availability and is an important indicator to guide feed diet formulation.
The supplementation of livestock feed with animal protein is a present cause for public concern, and plant protein shortages have become increasingly prominent in China. This conflict may be resolved by fully utilizing currently available sources of plant protein, which has motivated the study of plant protein supplements, including different processing distillers dried grains with soluble (DDGS) (Li et al., 2012). The effect of substitution of soybean meal (SBM) with cotton seed meal, high-protein DDG, or wheat DDG on milk production and composition has been widely studied, and these studies have shown that feeding these protein supplements may be as effective as feeding SBM to dairy cows (Christen et al., 2010; Oba et al., 2010; Abdelqader and Oba, 2012). This study was conducted to determine the RD and SID of the CP as well as the AA contents of rapeseed meal (RSM), SBM, sunflower seed meal (SFM) and sesame meal (SSM) using the MNB method. Overall, this study aimed to determine and compare the absorbable AA contents of these protein supplements to guide diet formulation to increase milk yield and save plant protein resources. The results of this study may serve as a reference to establish a database of absorbable AA content.
MATERIALS AND METHODS
Material
The SBM, RSM, SFM, and SSM used in this experiment were collected from six different locations in China (SBM and SFM from the Northeast, RSM from the Southwest, and SSM from the North). All feed samples were ground to pass through a 2-mm screen. The SBM was hot peeled at 45°C to 50°C, and the bran and nuts were then mechanically separated. The RSM, SFM, and SSM were extracted using mechanical methods.
Animals and feeding
Four lactating Holstein cows fitted with a rumen fistula and T-shaped duodenal fistula were allocated in a 4×4 Latin square experiment design to study the RD and SID. The protocols for the ruminal fistula surgery and the small intestinal fistula surgery in this experiment were approved by both the Animal Science and Technology College of Northeast Agricultural University and the Animal Care and Use Committee. The animals were housed in tie stalls and had free access to water, and fed ad libitum twice per day (08:00 am and 17:00 pm). The diet was formulated according to the NRC (2001) (Table 1), and the ration consisted of roughage and concentrate at a ratio of 60:40. Table 2 shows the chemical composition of the basal diet. The cows were adapted to the diet for 1 week prior to the study. The rumen degradation and small intestine digestion experiments were all divided into four periods.

Ingredients of the basal diet (dry matter basis)

Chemical composition of the basal diet (DM basis)
In situ rumen incubation and in situ intestinal incubation of feeds
Feed samples (2.5 g) were placed in nitrogen-free polyester bags (10×20 cm; 47-μm pore size) according to the guidelines set forth by the NRC (2001); the ratio of the sample size to the surface area of nylon bags was 12.3 mg/cm2 (Maiga et al., 1996). Forty-eight replicates of feed samples (3 replicates per cow and period) were incubated in the rumen for 16 h. The nylon bags in the rumen were attached to a polyester rope and removed from the rumen at the same time to be immediately washed. The washes were repeated until the rinsing water ran clear. The purine derivatives of microorganisms were determined by rinsing the residue in a neutral detergent solution. The samples were then dried in an oven at 55°C until a constant weight was achieved, and the sample residues of four replicates (one bags per cow and period) collected from the mobile nylon bag of the same feed were ground through a 0.5-mm sieve to analyze CP contents and AA composition. The sample residues of the remaining eight replicates (two bags per cow and period) were ground and passed through a 2 mm sieve and transferred into eight mobile nylon bags (3.5×5.5 cm, R510 Ankom products; Ankom, Fairport, NY, USA) with pore size of 50±15 um to estimate the SID. These nylon bags were inserted into the small intestine of the cows via the T-shaped fistula and were collected from the feces according to the technique proposed by Hveplund et al. (1992).
Chemical analyses
The dry matter (DM), ether extract (EE), CP contents, crude fiber analyzed according to the AOAC (1990) procedures. Phosphorus (P) concentrations of the samples were assayed photometrically, and calcium (Ca) concentrations were determined with anatomic absorption spectrophotometer (model 5100 PC, Perkin-Elmer, Norwalk, CT, USA). The neutral detergent fiber (NDF) and acid detergent fiber (ADF) were analyzed according to the methods of Van Soest et al. (1991) using the Ankom system (Ankom 220 fiber analyzer; Ankom, USA) and heat-stable α-amylase without sodium sulfate. Physically effective NDF (pe NDF) was calculated by the method of Sova et al. (2014). Net energy for lactation and metabolic energy were calculated based on NRC (2001) equations. The nitrogen fractions, defined according to the Cornell Net Carbohydrate and Protein System (CNCPS), were determined using the methods described by Licitra et al. (1996). The AA analysis was performed after the samples were hydrolyzed in 6 M hydrochloric acid for 24 h at 100°C. Single AA was analyzed with a Hitachi L8800 analyzer (Hitachi Co., Tokyo, Japan), with the exception of Met and Trp, whose contents were measured after hydrolysis in formic acid for 24 h (Hagen et al., 1989).
Calculations and statistical analysis
The percentage of AAs absorbed by the rumen after a 16 h incubation was calculated based on the difference in the AA content between the feed and rumen residues (Table 5). Similarly, the percentage of AAs absorbed by the small intestinal tract was calculated based on the difference between the AA content in the rumen residue after 16 h of incubation and the AA content of the feces (Table 6). The total absorbable AA content was estimated by calculating the sum of 60% of the AA that degraded in the rumen and undegraded AA in the small intestine. The milk protein score (MPS) was obtained by determining the ratio of the absorbable AA profile to the AA composition of milk protein.

Rumen degradability of CP and amino acid of SBM, SFM, SSM and RSM (16 h)

Small intestinal digestibility of CP and amino acids of SBM, SFM, SSM and RSM
The data were analyzed using a Latin design with the MIXED procedure of SAS (SAS, 2012), and differences among treatments were assessed using LSMEANS with the PDIFF in SAS (2012). Differences were considered significantly at p<0.05. The effect of the feed was considered to be fixed, whereas that of the cows was considered to be random. The following model was adopted: Yij = u+Fi+Cj+Eij, where Yij is the value of the variable studied for the ith feed and the jth cow, u is the overall mean, Fi is the fixed effect of the ith feed (i = 1–4), Cj is the random effect of the jth cow (j = 1–4), and Eij is random error.
RESULTS
Composition of feed
The chemical composition of the protein supplements is presented in Table 3. The ammonia nitrogen (AAN) content varied from 4.94% DM (SFM) to 7.96% DM (SBM). The contribution of N (nitrogen) from AAN to the total N content ranged from 69.19% (SFM) to 86.26% (RSM). The content of CP was highest in the SBM (49.73%) and lowest in the SFM (30.87%). The other two feed sources contained intermediate CP values. The soluble protein concentration of the SBM was significantly higher than those of the SFM and RSM (p<0.05). The concentrations of NDF of the SBM, RSM, SSM, and SFM were 15.94%, 29.31%, 30.31%, and 49.94% (DM basis), respectively, and the concentrations of ADF in these sources was 6.97%, 19.33%, 13.97%, and 29.34% (DM basis), respectively. The EE concentrations of the SBM, RSM, SFM, and SSM were 1.77%, 2.70%, 2.76%, and 7.55% (DM basis), respectively. The neutral detergent insoluble crude protein (NDICP) values of the SBM, SFM, SSM, and RSM were 0.67%, 2.04%, 2.56% and 6.33% (DM basis), respectively, the acid detergent insoluble crude protein (ADICP) values of these sources were 0.46%, 1.10%, 1.10%, and 2.55% (DM basis), respectively.

Chemical composition of the SBM, SFM, SSM and RSM (DM basis)
Table 4 shows that the AA compositions of the samples differed among the protein supplements. Specifically, the total amino acid (TAA) content was highest in the SBM but lowest in the SFM. Moreover, the Lys concentration was significantly higher in the SBM than in the RSM, SSM, and SFM (p<0.05); overall, the Lys concentration of the SFM was the lowest among the feeds (p<0.05). The SBM contained the most Met, whereas the SFM contained the least Met; the Met concentrations of the other two sources were intermediate.

Amino acid composition of the SBM, SFM, SSM and RSM (DM basis)
Rumen degradability
The RDs of the feeds after 16 h of incubation are shown in Table 5. Overall, the RD contents of TAA of the RSM were highest, whereas those of the SFM were lowest (p< 0.05). For each protein source, the RD of EAA followed a pattern similar to that of the TAA. Of all examined feed sources, the RD of Met was highest in the RSM (p<0.05) and lowest in the SBM (p<0.05). The RD values of Tyr exceeded 75% in the SSM, RSM, SFM, and SBM, but the RD values of Leu and Ile were lower than 55% in these samples, as low as 13.23% in the SFM. The RDs of individual AAs also differed for the same food source. Overall, ruminal degradation modifies the AA profile from feedstuffs.
Small intestinal digestibility
The SIDs of AAs of the rumen residues are presented in Table 6. The SID of TAA varied from 83.92% (RSM) to 89.76% (SBM). The SIDs of CP, TAA, EAA, branched chain amino acid, Arg, Ser, and Thr were higher than 80% for all feed sources. The SID of RUP was the highest for the SBM, followed by those of the RSM and SSM, and lowest for the SFM. The SIDs of Lys for the SSM, RSM, SBM, and SFM were 73.92%, 90.93%, 91.56%, and 94.89% (DM basis), respectively, and the SIDs of Met in these food sources were 98.58%, 72.42%, 94.78%, and 79.35% (DM basis), respectively. For all feed samples, the SIDs of Arg and the Thr were higher than 90% and 85%, respectively.
Small intestine absorbable amino acids
The small intestine absorbable AA contents of all feed samples are presented in Table 7. The levels of intestinal absorbable dietary proteins were higher in the SBM and SSM than in the SFM and RSM. The TAA was highest in the SBM (26.33%) and lowest in the RSM (13.98%). The small intestine absorbable essential amino acid (EAA) followed the same pattern as that of the small intestine absorbable TAA. The content of small intestine absorbable Lys varied from 0.86% (SFM) to 2.12% (SBM), whereas the content of absorbable Met ranged from 0.28% (SFM) to 1.03% (SSM).

Small intestinal absorbable AA contents of SBM, SFM, SSM and RSM (DM basis)
Milk protein score
The AA content relative to milk protein level is ranked in Table 8, and the following respective first and second limiting AAs of the protein supplements were determined: Met and Val for the SBM, Val and Lys for the SSM, Lys and Met for the SFM, and Leu and Lys for the RSM. The MPS of the SBM (0.181) was highest, followed by those of the RSM (0.136), SSM (0.108) and SFM (0.106).
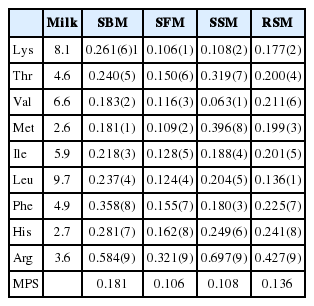
Essential AA milk protein score of SBM, SFM, SSM and RSM
DISCUSSION
Of all the examined protein sources, the CP of SBM was highest, which corroborated previously reported data (Robision et al., 2008; FOBI Network, 2011). The NDF and ADF concentrations of the SBM were within the expected ranges reported in the literature (Borucki-Castro et al., 2007; Mjoun et al., 2010; Li et al., 2012). The NDICP and ADICP concentrations of the RSM were lower than the values reported in Maxin et al. (2013), which may be due to low NDF and ADF concentrations of the RSM in this study. The NDICP and ADICP values of the protein supplements are considered to be associated with NDF and ADF concentrations, and high NDICP proportions may reflect higher slowly degradable protein fraction in the rumen. Conversely, high ADICP values may result from heat treatment (ADICP being an indicator of heat-damaged proteins), which may lead to low rumen protein digestibility (Mustafa et al., 2000). In addition, the processing method (Extraction method of oil) may affect the nutrient content of the protein supplements.
Generally, most AA concentrations of the feedstuffs were within the ranges reported by the NRC (2001). The AA profiles (except the Lys and Met levels) of SBM and RSM were within the expected ranges reported in the literature (NRC, 2001; Oba et al., 2010; Heendeniya et al., 2012). The Lys concentrations of the SBM and the RSM were lower than the values reported in NRC (2001) (3.17% vs 6.20% for SBM; 2.41% vs 5.62% for RSM), but the average Lys concentration (3.17%) of the SBM was much higher than that (average 2.24%) reported by others (Mjoun et al., 2010; Li et al., 2012). The Met concentrations of the SBM and the RSM reported in NRC (2001) were both lower than those measured in this study (0.65% vs 1.44% for SBM; 1% vs 1.87% for RSM). These differences may be due to the different processing methods and different sources for the same feed. Lys and Met are reportedly co-limiting AAs for growth and milk synthesis in dairy cattle (Socha et al., 2005). Specifically, the ratios of Lys and Met are known to affect milk protein synthesis; the contents of Lys and Met should be maximized, and their ratio should be as close to three as possible (NRC, 2001). Although the SBM contained high levels of Lys, the levels of sulfur-containing AAs (Met and Cys) were low, which agreed with the results reported by Taghizadeh et al. (2005). In the RSM, the Lys content was high and the Met content was low, which was consistent with data reported by Piepenbrink and Schingoethe (1998). The differences in the AA contents of these feed samples in this study may differ from previously reported values due to differences in the maturity, variety, source, processing, and fertilization for the same type of feed (Piepenbrink and Schingoethe, 1998; Taghizadeh et al., 2005). The Glu contents of all samples were high. Therefore, the Arg contents of all samples were high because Glu is the synthetic precursor of Arg.
The RDs of most AAs differed among protein supplements, which corroborated data reported by Maxin et al. (2013). These differences indicated that rumen fermentation altered the AA profile of RUP compared with the original feed, which agreed with previous reports (NRC, 2001; Taghizadeh, et al., 2005). The tyrosine in the feed samples in this study was strongly degraded in the rumen, and the RDs of all AAs, except for that of Tyr, primarily depended on the feed, including the chemical and physical properties of the feed, which agreed with previous findings (Crooker et al., 1987; Erasmus et al., 1994). Sniffen et al. (1992) observed that Met was not easily degraded in the rumen, but the RD of Met in the RSM exceeded 80% in this study, whereas those of the other protein supplements were low. This finding was consistent with results reported by Crooker et al. (1987), who indicated that the RD of Met depends on the feed source. In this study, the RDs of Thr, Cys, His and Pro were highest among the RDs of AAs in the four protein sources, which was consistent with a report by Paz et al. (2014). His is a very reactive AA and sensitive to degradation, which corroborates a study by Gerrard (2002). In this study, branched-chain AAs (BCA), particularly the Leu in the SBM, SSM, and SFM, appeared to be resistant to rumen microbial degradation. This finding was similar to results reported by Crooker et al. (1987), who indicated that BCAs are consistently less degradable than non-branched AAs. Many previous reports obtained a similar conclusion, stating that the Leu content of the SBM was lowest (Borucki-Castro et al., 2007; Mjoun et al., 2010; Maxin et al., 2013). Of the essential AAs in the protein supplements, the RDs of Ile and Leu were lowest, which may be due to their low solubility (Maxin et al., 2013). Only small and inconsistent differences were observed in the RDs of TAA and CP in RSM, which agrees with findings reported by Piepenbrink and Schingoethe (1998). The RDs of Cys, His, Gly, Met and Tyr were highest among the AAs in RSM, whereas those of Asp and Leu were lowest, which was similar to findings reported by Maxin et al. (2013) for RSM. The differences in the RDs of individual AAs among protein supplements may be related to the physical properties (such as the solubility), AA composition of the feed, characteristics of rumen digestive enzymes and amounts of protozoa and bacteria present in the rumen (Messman et al., 1992; Van Straalen et al., 1997). The variation in the AA profile of the original feed emphasizes the importance of determining the AA profile of the undegradable protein and indicates that the feed AA profile should be adjusted to account for differential rumen degradation (Gonzalez et al., 2001).
The SIDs for the majority of AAs significantly differed from that of TAA in this study, but most of these differences were small, which was consistent with Borucki-Castro et al. (2007). In this study, the SID of the RUP was the highest for the SBM, followed by those of RSM and SSM; the observations for SBM and RSM were consistent with published values (Borucki-Castro et al., 2007). Information about the SID for CP and AA is scarce for SSM and SFM. The SID of RUP can vary widely depending on the feedstuff and specific AA (Hvelplund et al, 1992; O’Mara et al., 1997). The SID of Lys in the SBM was higher than 90%, which was consistent with findings by Borucki-Castro et al. (2007) and Boucher et al. (2009a). Hastad and Prestløkken (2001) reported that the SID of the RUP in RSM was 94.6%, which was higher than the value determined in the present study (88.47%). Furthermore, the SIDs of most AAs in SBM in the present study were lower than values reported by Mjoun et al. (2010), which may be due to differences in heat processing temperatures for the feed. In addition, when using the mobile bag technique, bags should be recovered at the terminal ileum. However, bags were commonly recovered from feces for practical reasons, which may be responsible for the differences between the results of this study and those of other studies. The SID of Arg exceeded 90% for all protein supplements, which may be due to the action of trypsin, which can hydrolyze the bonds between Lys and Arg. Arg participates in the ornithine cycle, which allows it to not only provide energy but also urea being detoxified (Van Straalen et al., 1997).
For all feedstuffs, intestinal incubation considerably affected the AA profiles. Compared with the RSM and SFM, the SBM and SSM were better sources of intestinal absorbable dietary protein. For all feed samples, Pro, Gly, Ala, and Cys were minimally absorbed in the small intestine, but Glu, Leu, Tyr, Phe, and Arg were easily absorbed in the small intestine, which was consistent with the SIDs of AAs for Horse beans and White kidney beans obtained by Cros et al. (1992). The profiles of small intestinal absorbable AAs differed by feedstuff, which emphasized the importance of models that account for this factor to improve the accuracy of estimating the dietary supply of AA. As price fluctuates, small intestinal absorbable protein and AA may be used as a tool to aid in the selection of feedstuffs of differing protein quality.
The MPS remained low for the SFM and SSM. Thus, animal feed supplemented with SFM and SSM requires further supplementation with other AA or combination with other feeds to ensure a complete AA profile. The combination of these protein supplements likely improved the AA profile by supplementing the feed with AAs that were deficient. The efficiency of microbial proteins synthesized by the rumen absorbed in the small intestine was almost 60%, and the efficiency of RUP absorbed in the small intestine almost as high as 80%. Therefore, increasing the content of undegraded rumen AA may improve the utilized AA efficiency. To increase milk production, diets should be formulated to specifically include absorbable AAs, as opposed to AAs in general.
Before rumen residues were placed into the small intestine, they were incubated with pepsin-HCl to imitate abomasum digestion, and the resultant SIDs were found to be similar to those observed by Voigt et al. (1985) and Van Straalen et al. (1993). The mobile nylon bags with the rumen residues were recovered from the feces, and the digestibility of AAs was then determined by calculating the sum of the AAs that had been absorbed by the small and large intestine. Many studies reported that large intestine fermentation exerts limited effects on total intestinal absorption (Voigt et al., 1985; Van Straalen et al., 1997). Eramus et al. (1994) concluded that microorganisms from the large intestine affected between 0.9% and 8.6% of the SID of the feed, and these values were lower for concentrates. Kohn and Allen (1992) also found that the feed samples containing higher levels of protein were less contaminated by microbes. Therefore, the large intestine digestibility was not determined in our experiments, and the data were not corrected for microbial contamination by the large intestine.
Across feedstuffs, the rumen incubation time (16 h) used in this study was recommended by Erasmus et al. (1994) and Boucher et al. (2009) to simulate the retention time. Therefore, the RD was generally higher in our study than in other studies, which examined rumen incubation times of 12 h (De Boer et al., 1987; Von keyseling and Mathison, 1989). The rumen incubation time affects the SID of feed samples and total absorption of protein. These results confirmed previous findings: longer incubation times may correlate with increased degradation in the rumen (De Boer et al., 1987; Von Keyseling and Mathison, 1989).
CONCLUSIONS
The digested proportions of AAs differed by feed sample and AA. The absorbable AA content is an important index to adjust the balance of AAs in the feed of dairy cows to increase milk yield and save plant protein resources. The absorbable AA data should be incorporated in a large integral database.
ACKNOWLEDGMENTS
The authors thank Natural Science Foundation of Heilongjiang Province (C2015049), FARA project of the Agriculture Ministry in China (CARS-37), the Major Application Technology Research and Development Program in Heilongjiang Province (2013G0880), National Natural Science Foundation (C200101) and the Youth Fund of Qiqihar University (2014k-M26) for financial support.
Notes
CONFLICT OF INTEREST
We certify that there is no conflict of interest with any financial organization regarding the material discussed in the manuscript.