Improvement of Nutritive Value and In vitro Ruminal Fermentation of Leucaena Silage by Molasses and Urea Supplementation
Article information
Abstract
Leucaena silage was supplemented with different levels of molasses and urea to study its nutritive value and in vitro rumen fermentation efficiency. The ensiling study was randomly assigned according to a 3×3 factorial arrangement in which the first factor was molasses (M) supplement at 0%, 1%, and 2% of crop dry matter (DM) and the second was urea (U) supplement as 0%, 0.5%, and 1% of the crop DM, respectively. After 28 days of ensiling, the silage samples were collected and analyzed for chemical composition. All the nine Leucaena silages were kept for study of rumen fermentation efficiency using in vitro gas production techniques. The present result shows that supplementation of U or M did not affect DM, organic matter, neutral detergent fiber, and acid detergent fiber content in the silage. However, increasing level of U supplementation increased crude protein content while M level did not show any effect. Moreover, the combination of U and M supplement decreased the content of mimosine concentration especially with M2U1 (molasses 2% and urea 1%) silage. The result of the in vitro study shows that gas production kinetics, cumulation gas at 96 h and in vitro true digestibility increased with the increasing level of U and M supplementation especially in the combination treatments. Supplementation of M and U resulted in increasing propionic acid and total volatile fatty acid whereas, acetic acid, butyric acid concentrations and methane production were not changed. In addition, increasing U level supplementation increased NH3-N concentration. Result from real-time polymerase chain reaction revealed a significant effect on total bacteria, whereas F. succinogenes and R. flavefaciens population while R. albus was not affected by the M and U supplementation. Based on this study, it could be concluded that M and urea U supplementation could improve the nutritive value of Leucaena silage and enhance in vitro rumen fermentation efficiency. This study also suggested that the combination use of M and U supplementation level was at 2% and 1%, respectively.
INTRODUCTION
Tropical legume forages are a rich source of crude protein (CP) and minerals for animal nutrition, in addition to their contribution to a sustainable agro ecosystem (Bansi et al., 2014). The identification of alternative sources of dietary protein for ruminants is driven by the desire to reduce feeding cost and to ensure profitability and sustainability of livestock production systems. Ensiling is a method for preserving moist crops which ensures animal feed availability throughout the year. Silage processing is based on lactic acid fermentation under anaerobiosis and preserves the nutritive and sanitary qualities of the crops (Cazzato et al., 2011). Legume silages are better accepted by the animal than grass silages, with a tendency to higher animal performance. Leucaena (Leucaena leucocephala) is high in palatability, digestibility and digestible protein and is often recommended as ruminant feed (Barros Rodriguez et al., 2013). Ensiling may be an appropriate method for preservation and toxic reduction because Leucaena is harvested during the rainy season when drying is rather difficult. Sunagawa et al. (1989) reported that around 90% of mimosine is destroyed after 14 to 21 days of ensiling. Silage is widely used in farms and has a substantial role in animal production systems. High silage quality is a key factor in minimizing the cost of production and sustaining animal health. Increasing use of silage has resulted in continuing efforts to minimize the quality losses. The main aim of ensiling is to preserve fodder under anaerobic condition, where anaerobic microbes build up organic acids, mainly lactic acid, by using fermentable carbohydrates, and aerobic stability describes the length of time that silage remains stable. As a result, the pH decreases, and the forage is preserved. A good additive increases the nutrient recovery, decreases heating of the silage and fungi development during the storage or feed out period and results in increased gas production and fermentation (Salem et al., 2013). Ensiling with additional carbon and nitrogen sources could improve the quality of silage. Therefore, the aim of this study was to investigate the effect of molasses and urea supplementation on Leucaena silage quality and in vitro gas production and ruminal fermentation profiles.
MATERIALS AND METHODS
Dietary substrate, animals, experimental design and treatments
Leucaena was harvested and immediately chopped in 2 to 3 cm lengths and ensiled to the respective supplementation treatments according to a 3×3 factorial arrangement in a completely randomized design (CRD). Factor A was molasses (M) supplementation at 0%, 1%, and 2%, and factor B was urea (U) supplementation at 0%, 0.5%, and 1.0% of the Leucaena dry matter (DM). A mixture of M and U was dissolved in water, sprayed onto the Leucaena which was then packed into plastic bags. The silage bags were kept in room temperature (about 25°C to 30°C). All treatments were done in triplicates at 1 kg each. After 28 days of ensiling, 200 g of Leucaena silage were sampled for analysis of DM, organic matter (OM) and CP (AOAC, 1990), and acid detergent fiber and neutral detergent fiber (NDF) (Van Soest et al., 1991). In addition, mimosine was analysed by the modified methods of Dalzell et al. (2012). Feed ingredients and chemical compositions of concentrate, rice straw and Leucaena silage are shown in Table 1 and 2.

Feed ingredients and chemical composition of concentrate, rice straw, and Leucaena leaf
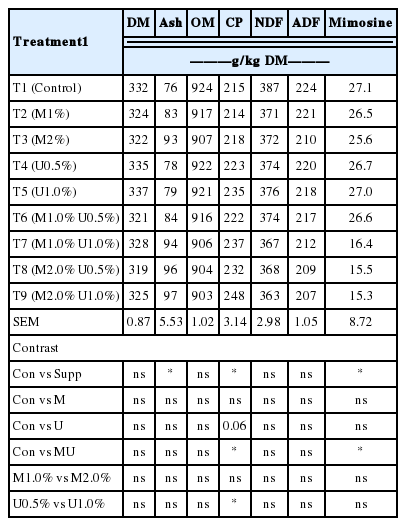
Chemical composition of Leucaena silage for all treatments
Silage samples were prepared and weighed (total substrate mixture 200 mg of DM) into 60 mL glass bottles for various times of incubation to study the rumen fermentation using in vitro gas techniques. All treatments were assigned according to a 3×3 factorial arrangement in a CRD with 3 bottles per treatment including triplicates of blank (medium only) in an incubation for 3 runs.
Rumen inoculums
Strict anaerobic techniques were used in all steps during the rumen fluid transferring and incubation periods. Rumen fluid samples were removed from swamp buffaloes (1 liter per animal) before morning feeding (7:00 h) under vacuum via the rumen fistula into a 2 liter plastic flask and transferred into 2 pre-warmed thermos flasks (1 liter) (Menke et al., 1979; Makkar et al., 1995). The fluid was then transported to the laboratory.
Medium solution preparation
In the present study, the medium was prepared for determination of gas production and fermented material during various incubation times. Therefore, the medium preparation was as described by Makkar et al. (1995). The mixture was kept stirring under CO2 at 39°C using a magnetic stirrer fitted with a hot plate. A portion (30 mL) of the rumen-fluid medium was transferred into each bottle and incubated in a water bath at 39°C.
Substrate incubation
The method used for in vitro fermentation was based on the technique described by Menke et al. (1979). The sets of sample incubations for the determination of fermentation end-products and gas production were prepared each time. The bottles with the mixture of substrate treatments were pre-warmed in a water bath at 39°C for 1 h before filling with 30 mL of rumen inoculums mixture. The bottles were then sealed with rubber stoppers and aluminum caps and incubated in a water bath set at 39°C.
Sample collection and analysis
Gas production kinetics
During the incubation, the gas production was recorded at 1, 2, 4, 6, 8, 12, 24, 36, 48, 72, and 96 h. Cumulative gas production data was fitted to the model of Ørskov and McDonald (1979) as follows:
Where a = the gas production from the immediately soluble fraction, b = the gas production from the insoluble fraction, c = the gas production rate constant for the insoluble fraction (b), t = incubation time, (a+b) = the potential extent of gas production. y = gas produced at time “t”.
Determination of fermentation parameters
The rumen inoculum mixtures were sampled at 0, 4, 8, and 12 h of fermenting post inoculation. Ruminal inoculum fluids were collected at 0, 4, 8, and 12 h post inoculation. Rumen fluid samples were then filtered through four layers of cheesecloth. Samples were divided into 2 portions. The first portion, around twenty milliliters of rumen inoculum, was put into plastic bottles for ammonia nitrogen (NH3-N) and volatile fatty acid (VFA) analysis. The sample was centrifuged at 16,000×g for 15 min, and the supernatant was stored at −20°C before NH3-N analysis by using the micro Kjeldahl methods (AOAC, 1990) and VFA analysis by high performance liquid chromatography (HPLC; Instruments by controller water model 1525, Waters Corporation, Milford MA, USA) water model 2707 auto sampler; water model 2489 UV detector and BREEZE software; column novapak C18; column size 3.9 mm×300 mm; mobile phase 10 mM H2PO4 [pH 2.5]) (Samuel et al., 1997). The second portion was fixed with 10% formalin solution in sterilized 0.9% saline solution. The total direct count was made by the methods of Galyen (1989) based on the use of a haemocytometer (Boeco, Hamburg, Germany). The last portion was stored at −20°C for DNA extraction (Yu and Morrison, 2004).
Extraction of genomic DNA and real-time polymerase chain reaction
Community DNA was extracted from 0.5 g of rumen content (fluid and digesta) by the RBB+C method (Yu and Morrison, 2004). In brief, the RBB+C method employs two rounds of bead beating in the presence of NaCl and sodium dodecyl sulphate, followed by sequential ammonium acetate and isopropanal precipitations. The precipitated nucleic acids were then treated with RNase A and proteinase K, and the DNA was purified using columns from QIAGEN DNA Mini Kit (QIAGEN, Valencia, CA, USA), according to manufacturer’s recommendations. The targeted bacteria were total bacteria, the three predominant cellulolytic bacteria (F. succinogenes, R. flavefaciens, and R. albus) and protozoa. Primers for F. succinogenes, Fs219f (5′-GGTATGGGATGAGCTTGC-3′) and Fs654r (5′-GCCTGCCCCTGAACTATC-3′) were selected to allow amplification of all 10 F. succinogenes strains deposited in Gene Bank. For R. albus primers, Ra1281f (5′-CCCTAAAAGCAGTCTTAGTTCG-3′) and Ra1439r (5′-CCTCCTTGCGGTTAGAA CA-3′) and for R. flavefaciens primers, Rf154f (5′-TCTGGAAACGGATGGTA-3′) and Rf425r (5′-CCTTTAAGACAGGAGTTTACAA-3′) were also selected to allow species-specific amplification of all seven R. flavefaciens strains deposited in Gene Bank. Primers for total bacteria and protozoa were F (5′-GC-clamp-CCTACGGGAGGCAGCAG3′), R (5′GWATTAC CGCGGCKGCTG3′) and F (5′-GCTTTCGWTGGTA GTGTTT-3′), R (5′-ACTTGCCCTCYAATCGTWCT-3′). These primers were chosen from previously published sequences that demonstrated species specific amplification (Koike and Kobayashi, 2001). The conditions of the real-time polymerase chain reaction (PCR) for F. succinogenes were as follows: 30 s at 94°C for denaturing, 30 s at 60°C for annealing and 30 s at 72°C for extension (48 cycles), except for 9 min denaturation in the first cycle and 10 min extension in the last cycle. Amplification of 16s rDNA for R. albus and R. flavefaciens was carried out similarly except an annealing temperature of 55°C.
To establish a quantitative assay, amplified target 16s rDNA of each species by using specific primers and PCR conditions as described previously, the purified DNA were quantified by spectrophotometry with multiple dilutions. The target DNA was quantified by using serial 10-fold dilutions from 101 to 108 DNA copies of the previously quantified DNA standards. Real-time PCR amplification and detection were performed in a Chromo 4TM system (Bio-Rad, Hercules, CA, USA). In brief, Biostools QuantiMix Easy SYG Kit was used for PCR amplification and samples were assayed in duplicate in a 20 μL reaction mixture contained 4 to 6 mM MgCl2, 10 μL of Mastermix (including; Taq DNA polymerase, reaction buffer, dNTP mixture, MgCl2 and SybrGreen), 2 μL of DNA template and 0.8 μL of each primer (10 μM/μL).
Digestibility
At 12 and 24 h post inoculation, the in vitro true digestibility (IVTD) of a set of samples was determined. In brief, the content of the bottle was transferred quantitatively to a spout-less beaker by repeated washing with 100 mL neutral detergent solution. The content was refluxed for 1 h and filtered through pre weighed Gooch crucibles. The DM of the residue was weighed and IVTD of feed was calculated based on the following equation:
Statistical analysis
Data used for the statistical analyses consisted of 3 levels of molasses supplementation, 3 levels of urea supplementation, 3 replications, and runs making a total of 27 observations. All obtained data were subjected to the general linear models procedures of the Statistical Analysis System Institute (SAS, 1998) according to a 3×3 factorial arrangement in CRD. The statistical model including molasses level, urea level and interaction effects were: Yij = μ+Ai+Bj+ABij+ɛij; where Yijk is an observation, μ is the overall mean, A is molasses level effect (i = 1, 2, 3), B is urea level effect (j = 1, 2, 3), AB is interaction effect of molasses level and urea level, and ɛij the residual effect. Multiple comparisons among treatment means were performed by Duncan’s New Multiple Range Test (DMRT) and orthogonal contrast (Steel and Torrie, 1980).
RESULTS AND DISCUSSION
Feed ingredients and chemical compositions
The feed ingredients and chemical composition of concentrate, rice straw and fresh Leucaena leaf are shown in Table 1. Rice straw was used as roughage source. However, the CP of rice straw was low (23 g/kg DM) and high in NDF (760 g/kg DM). Leucaena silage (Table 2) contained CP 215 to 248 g/kg of DM and mimosine 15.3 to 27.1 g/kg of DM. Increasing U supplementation level increased the CP content of the silage and this was similar to the finding of Wanapat et al. (2013) who investigated whole crop rice silage. Energy is usually the limiting factor for growth of anaerobic microbes and provision of U and M might have increased the microbial mass that lead to increased CP (Staples et al., 1981). The provision of carbon skeleton and energy for microbial growth might have synchronized with ammonia released from urea hydrolysis, consequently increasing the CP content of forages ensiled (Salem et al., 2013). Furthermore, fermentation decreased 85% to 90% of mimosine. The result was in agreement with that reported by Sunagawa et al. (1989) who found mimosine reduction over 90% in Leucaena silage either with or without additives. The reduction of mimosine by ensiling being higher than by sun drying (14.5% to 51.1% of the original samples) was reported by Wee and Wang (1987). These results indicated that Leucaena silage is an interesting alternative for feed preservation.
Gas production kinetics and in vitro digestibility
Cumulative gas production for each of the substrate treatments presented as gas production and values for kinetics of gas production models for substrates studied are given in Table 3. The values for the estimated parameters obtained from the kinetics of gas production models for supplements studied revealed that the intercept value (a) for the different treatments representing gas production from soluble fractions and gas production rate constants for the insoluble fraction (c) ranged from −4.72 to −1.82 and 0.04 to 0.12, respectively. Gas production from the insoluble fraction (b), potential extent of gas production (a+b) and cumulative gas production at 96 h were significantly different with U supplementation (p<0.01). The treatments with U supplementation showed the higher gas production. Effect of M and U supplementation on digestibility from in vitro incubation are shown in Table 3. There was no interaction effect between M and U on DM digestibility at hours 12 and 24 of incubation. According to Cone and van Gelder (1999), comparison of gas production data of samples differing widely in CP content can lead to misinterpretations. Generally, low gas production would indicate low degradability, but feedstuffs high in CP normally produce less gas during fermentation, even if their extent of degradation is high, because protein fermentation produces ammonia, which influences the carbonate buffer equilibrium by neutralizing H+ ions from VFA without release of carbon dioxide. In the present study Leucaena silage contained high CP but produced more gas. The addition of M and U to Leucaena silage increased digestibility after 12 and 24 h of incubation, suggesting that during the ensiling process molasses might have removed some chemical linkages of hemicelluloses and thus enhanced their solubility in detergent solutions and also possibly due to the ability of rumen microorganism to degrade the plant secondary metabolites like alkaloids and saponins (Hart et al., 2008) and utilize them as an energy source.
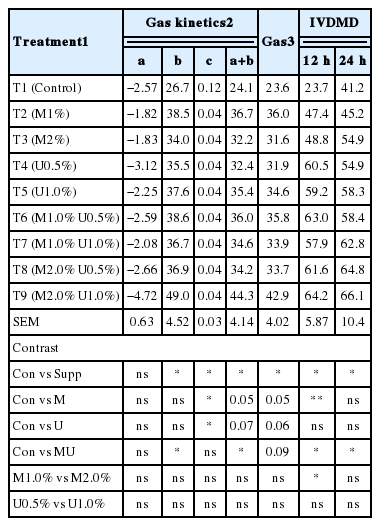
Effect of Leucaena silage on gas production kinetics and degradability from in vitro incubation with swamp buffalo rumen fluid
Rumen fermentation
In the in vitro gas production technique, NH3-N concentration was highest in T9 (M2.0% U1.0%). While NH3-N was found to be the lowest in control. The concentration of NH3-N was increased dramatically based on the time incubation. This result could be due to the effects of tannins contained in Leucaena silage which protect CP from degradation by the formation of tannin-protein complexes in the rumen, thereby increasing metabolizable protein supply to the duodenum (Waghorn, 2008). NH3-N concentration was found higher in the treatments with high level of U supplementation. There was no effect of M supplementation on NH3-N. Availability of NH3 is an important determinant of microbial protein production as the majority of rumen bacteria use NH3 as a nitrogen source. It is essential to know what concentration of NH3 will support maximal microbial growth in order to make judgments regarding utilization of non-protein N. The NH3–N concentration of all treatments ranged from 16.8 to 22.8 mg/dL (Table 4). However, Satter and Slyter (1974) suggested NH3 concentrations from 3 to 5 mg/dL as optimal to produce ruminal microorganism growth, which was relatively less than those observed in this work. It appears that, once NH3 starts to accumulate, the growth of bacteria utilizing NH3 is not enhanced by increasing NH3 concentration (Satter and Slyter, 1974).
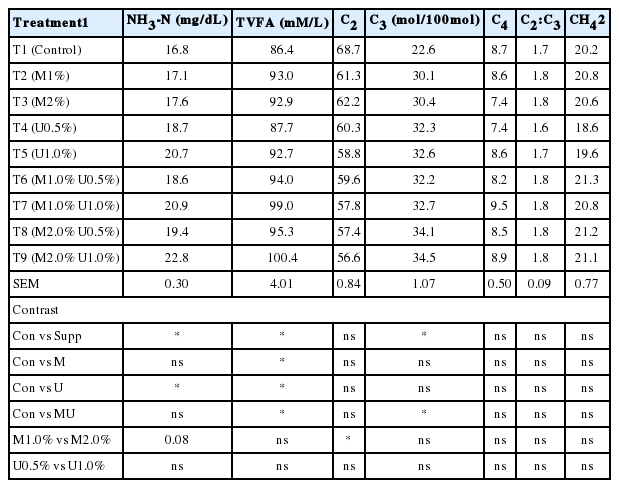
Effect of Leucaena silage on ammonia nitrogen, volatile fatty acid and methane production from in vitro incubation with swamp buffalo rumen fluid
Interaction between M and U supplementation affected the proportion of propionic acid (Table 4). Total VFA concentrations in M2.0% U1.0% was higher than other treatments (p<0.05). In addition, supplementation of M2.0% U0.5% and M2.0% U1.0% resulted in a higher (p<0.05) proportion of propionic acid (34.4 and 34.1 mole/100 mole, respectively) and a lower (p<0.01) proportion of acetic acid which was highest in the control. While the proportion of butyric acid was not affected by M and U supplementation. Calculation of ruminal methane (CH4) production using VFA proportions according to Moss et al. (2000) showed that methane production was not influenced by interaction of U and M supplementation. In contrast, Anantasook and Wanapat (2012) reported that a high proportion of propionic acid was caused by a decreased methane production due to tannins contained in rain tree pot meal. Effects of tannins on increased propionic acid and reduced acetic to propionic ratio have been found to vary with diets and applications.
Rumen microbes
In the present study, effects of M and U supplementation on microbes from in vitro incubation are shown in Table 5 and 6. The results revealed a significant effect on bacterial populations by M and U supplementation, while protozoa and fungi zoospores were not effect by supplementation. As compared with the control group, e supplementation resulted in a larger bacteria population (p<0.05). This effect may be due to the cause of Leucaena silage supplemented with U an M which contains high level of nitrogen and carbon source. The additional protein provided by the Leucaena would have increased availability of ammonia for rumen micro flora, stimulating microbial growth and increasing rate of breakdown of the forage (Barros-Rodriguez et al., 2013).
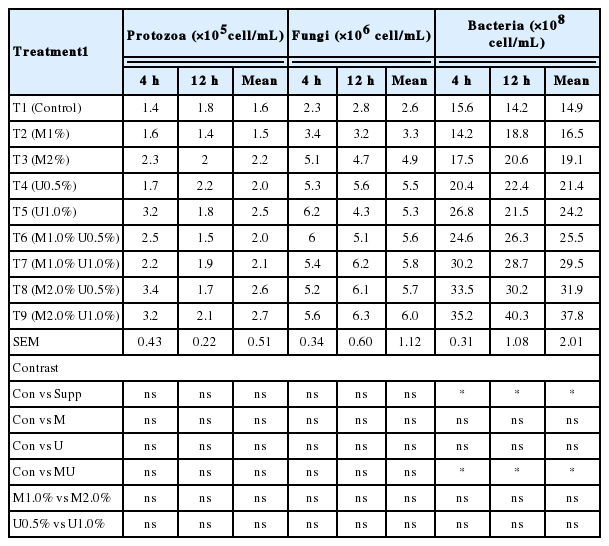
Effect of Leucaena silage on microorganisms from in vitro incubation with swamp buffalo rumen fluid

Effect of Leucaena silage on cellulolytic bacteria and protozoa populations in in vitro incubation in swamp buffalo fluid as determined by real-time PCR
The effect of M and U supplementation on microbes from in vitro incubation with swamp buffalo rumen fluid is shown in Table 6. The real-time PCR for quantification of ruminal microbes with specific targets (total bacterial, R. albus, F. succinogenes, R. flavefaciens, and protozoa) are reported in Table 6. The total bacteria and three dominant cellulolytic bacteria were found affected by M and U supplementation. Predominant cellulolytic bacteria in in vitro incubation were affected by the M and U supplementation, except for R. albus. Supplementation of M and U decreased the population of protozoa (p<0.05). Koike and Kobayashi (2001) reported that F. succinogenes was the most dominant bacteria among the three species of cellulolytic bacteria. Changes of the population size or the proportion of cellulolytic bacterial numbers in the rumen may be due to some effect of tannins in Leucaena. Goel et al. (2008) reported that the F. succinogenes population was increased when supplementation with S. sesban leaves and Fenugreek seeds, while the R. flavefaciens population increased with Carduus leaves and fenugreek supplementation. Moreover, McSweeney et al. (2001) reported that the protein-tannin complexes reduce the availability of fermentable N for microbial activity in the rumen. Kumar and Singh (1984) reported that tannins in tree leaves inhibited proteolysis of casein and subsequent ammonia production in vitro. Therefore, U addition would provide fermentable N for stimulating microbial fermentation in the rumen. Wanapat and Cherdthong (2009) reported that increasing protein supplementation for ruminants lead to a higher population of ruminal microbes. The reason could be due to a nitrogen source which could support microbial production in the rumen. The population of F. succinogenes was higher than those of R. albus. The finding of this study was similar to that of Wanapat and Cherdthong (2009), who studied rumen cellulolytic bacteria population using real-time PCR. They found that the population of F. Succinogenes was more abundant than R. albus (3.0×10⁹ vs 2.93×10⁶ copies/mL of rumen fluid).
CONCLUSION
Based on this study, it could be concluded that supplementation of molasses and urea could efficiently improve Leucaena silage quality in terms of the chemical composition being high in protein and low in NDF contents. The present results suggest that supplementation of urea and molasses to Leucaena silage enhanced in vitro rumen fermentation efficiency, especially by the addition of urea at 1% and molasses at 2% of crop DM. However, further study using Leucaena silage supplemented with urea and molasses in feeding trials emphasizing lactating dairy cows and fattening beef cattle should be investigated.
ACKNOWLEDGMENTS
The authors would like to express their most sincere gratitude and appreciation to the Thailand Research Fund (TRF) via “The Royal Golden Jubilee Ph.D. Program”, Tropical Feed Resources Research and Development Center (TROFREC), and the Department of Animal Science, Faculty of Agriculture, Khon Kaen University, Thailand, for their kind financial support and provision of research facilities.
Notes
CONFLICT OF INTEREST
We certify that there is no conflict of interest with any financial organization regarding the material discussed in the manuscript.