Growth Performance of Early Finishing Gilts as Affected by Different Net Energy Concentrations in Diets
Article information
Abstract
The objectives of the current experiment were to study the response of the growth performance of early finishing gilts to different net energy (NE) concentrations in diets, and to compare the NE values of diets between calculated NE values and measured NE values using French and Dutch CVB (Centraal Veevoederbureau; Central Bureau for Livestock Feeding) NE systems. In a metabolism trail, the NE concentrations in five diets used for the growth trial were determined based on digestible nutrient concentrations, digestible energy, and metabolizable energy using a replicated 5×5 Latin square design with 10 barrows (initial body weight [BW], 39.2±2.2 kg). In a growth trial, a total of 60 early finishing gilts (Landrace×Yorkshire; initial BW, 47.7±3.5 kg) were allotted to five dietary treatments of 8.0, 9.0, 10.0, 11.0, and 12.0 MJ NE/kg (calculated, as-is basis) with 12 replicate pens and one pig per pen in a 42-d feeding experiment. The NE and amino acid (AA) concentrations in all diets were calculated based on the values from NRC (2012). Ratios between standardized ileal digestible AA and NE concentrations in all diets were closely maintained. Pigs were allowed ad libitum access to feed and water. Results indicated that calculated NE concentrations in diets (i.e., five dietary treatments) were close to measured NE concentrations using French NE system in diets. The final BW was increased (linear and quadratic, p<0.05) with increasing NE concentrations in diets. Furthermore, average daily gain (ADG) was increased (linear and quadratic, p<0.01) with increasing NE concentrations in diets. There was a quadratic relationship (p<0.01) between average daily feed intake and NE concentrations in diets. Feed efficiency (G:F) was also increased (linear, p<0.01) as NE concentrations in diets were increased. The NE intake per BW gain (kcal NE/kg of BWG) was increased (linear, p<0.01) with increasing NE concentrations in diets that were predicted from both French and Dutch CVB NE systems. Linear regression indicated that predictability of daily NE intake from the BW of pigs was very low for both French (R2, 0.366) and Dutch CVB (R2, 0.374) NE systems. In conclusion, increasing NE concentrations in diets increase BW, ADG, G:F, and NE intake per BW gain of early finishing gilts. The BW of early finishing gilts is not a good sole variable for the prediction of daily NE intake.
INTRODUCTION
Voluntary feed intake and the following productive performance of pigs depend largely on various animal and environmental factors, and feed energy density (i.e., energy concentrations in feed) has been considered as one of the most important factors (Noblet and van Milgen, 2004; Kil et al., 2013b). From an economic standpoint, moreover, the feeds represent the largest part of total pig production costs, and therefore, the accurate estimation of feed energy values is crucial for realizing optimal pig production (Noblet and van Milgen, 2004; Kil et al., 2013b).
The pig has been known to adjust daily intake of feeds containing a variety of energy concentrations to maintain a constant daily energy intake (Cole et al., 1967). If pigs were fed diets containing low energy, however, energy intake and subsequent growth performance become compromised (Chadd and Cole, 1999; Smith et al., 1999; De la Llata et al., 2001). One of the limitations of explaining the relationship between dietary energy intake and pig performance is the way of expressing energy concentrations in diets (Noblet and van Milgen, 2004). Most experiments evaluating the relationship between dietary energy concentrations and pig performance have been conducted with diets formulated on digestible energy (DE) or metabolizable energy (ME) basis (Cole et al., 1967; Oliveira et al., 2005; Beaulieu et al., 2009). It has been suggested that a more accurate estimate of the actual energy value of a feed is its net energy (NE) value because NE considers almost all non-usable energy including energy loss via feces, urines, gases, and heat increments that were originated from feeds (Noblet and Henry, 1993; Kil et al., 2013b). In addition, NE system is known as the only system in which actual energy requirements and energy values for diets are expressed on the same basis, and thus, should theoretically be independent of the feed (Noblet and van Milgen, 2004). Moreover, a previous experiment investigated the relationship between dietary NE concentrations and the growth performance of growing-finishing pigs of a 3-way crossbreeding (Quiniou and Noblet, 2012), but little information for early finishing gilts has been available. In addition, Quiniou and Noblet (2012) used French NE system for determining NE concentrations of diets and their relationship with growth performance of pigs; however, to our knowledge, no experiment has been performed to investigate the relationship between dietary NE concentrations determined using Dutch CVB (Centraal Veevoederbureau; Central Bureau for Livestock Feeding) NE system and growth performance of pigs.
The objectives of the current experiment, therefore, were to examine the response of growth performance of early finishing gilts to different NE concentrations in diets, and to compare the NE values of diets between calculated NE values and measured NE values using French and Dutch CVB NE systems.
MATERIALS AND METHODS
Two experiments were conducted in this experiment, and the Institutional Animal Care and Use Committee at Chung-Ang University reviewed and approved the protocols for both experiments.
Dietary treatments consisted of five mash diets (Table 1) formulated according to the nutritive values of ingredients and to the requirements of early finishing gilts as described by NRC (2012) and Sauvant et al. (2004). Diets were formulated to contain increasing NE concentrations as the five experimental diets of 8.0, 9.0, 10.0, 11.0, and 12.0 MJ NE/kg (as-is basis). The concentrations of standardized ileal digestible (SID) of Lys, Met+Cys, Thr, and Trp in 5 diets were set to the level of 0.82, 0.46, 0.50, and 0.14 g/MJ NE, respectively. All other nutrients were included in all diets to meet or exceed nutrient requirement estimates (NRC, 2012). These five diets were used for both experiment 1 and 2.
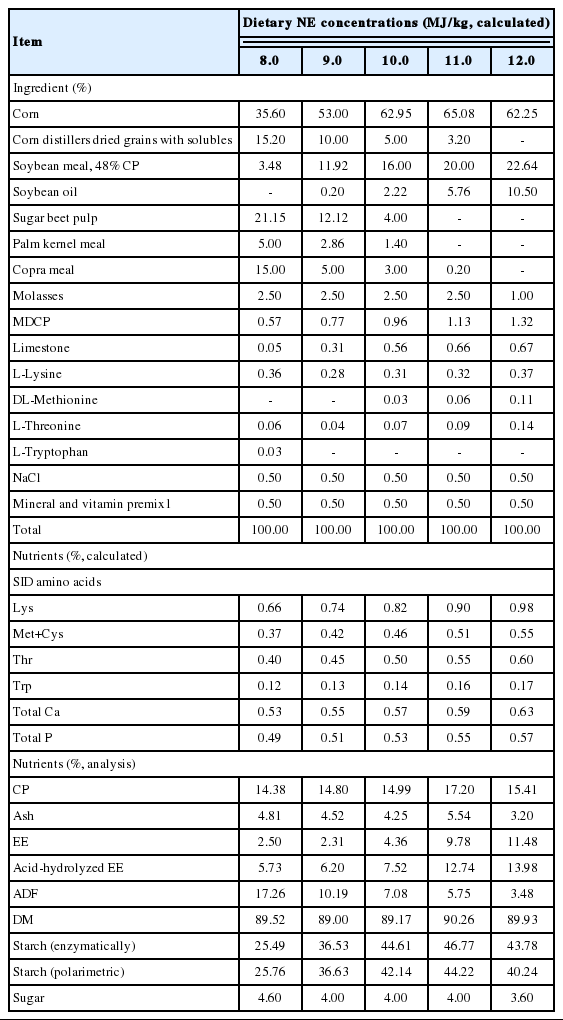
Composition and nutrient content of experimental diets (as-fed basis)
Experiment 1: Metabolism trial
Animals and experimental design
A metabolism trial was designed to determine the DE, ME, and NE concentrations in five experimental diets. A total of 10 barrows (Duroc×Landrace×Yorkshire; initial body weight [BW], 39.2±2.2 kg) were used. Pigs were allotted to a replicated 5×5 Latin square design with five diets and five periods. Pigs were placed in metabolism cages that were equipped with a feeder, a nipple drinker, a screen floor, and a urine tray, which allowed for the total, but separate collection of urine and feces from an individual pig. Measured digestible concentrations of nutrients, DE, and ME were used to calculate the NE concentrations in diets according to the prediction equations of NRC (2012) which were based on French (Sauvant et al., 2004) and Dutch CVB NE system (Blok, 2006).
Feeding and sample collection
The quantity of feed provided daily per pig was calculated as 2.5 times the estimated energy requirement for maintenance (i.e., 106 kcal of ME/kg BW0.75) (NRC, 1998) and divided into two equal meals provided at 0800 and 1800 h. The feed allowance was adjusted at the beginning of each period when the BW of each pig was recorded. Water was available at all times. The initial 5 d was considered as an adaptation period to the diet, and total collections of urine and feces commenced on the morning of d 6 and finished on the morning of d 11. On d 6, each pig received 5 g of ferric oxide as an indigestible marker included with 100 g of feed that was a portion of the morning feed. The remaining portion of the morning feed was offered after all the marked feed was consumed. Fecal collection commenced when the marker was appeared in feces. On the morning of d 11, pigs were again offered 100 g of marked feed as described above and collection of feces was terminated when the marked feces appeared. Feces were collected once daily in the morning and stored at −20°C. Urine was collected daily for 5 d in urine buckets containing 50 mL of 6 N HCl between the periods of providing marked feeds. Fecal samples and 10% of the collected urine were stored at −20°C immediately after collection.
Chemical analyses
Following the sample collections, urine samples were thawed and mixed within animal and diet, and a subsample was lyophilized before gross energy (GE) analysis. Fecal samples were dried at 50°C in a forced-air oven and finely ground before chemical analysis. All samples were analyzed in triplicate. Diets and fecal samples were analyzed for dry matter (DM, Method 930.15) (AOAC, 2007), ash (Method 942.05) (AOAC, 2007), ether extract (EE, Method 2003.06) (AOAC, 2007), acid hydrolysis ether extraction (AEE, Method 996.01) (AOAC, 2007), acid detergent fiber (ADF, Method 973.18) (AOAC, 2007), and crude protein (CP, Method 990.03) (AOAC, 2007). The concentrations of starch in the diet were measured using both the Ewers polarimetric method (EEC, 1999) and the enzymatic method (ISO, 2004). The concentrations of total free sugars were measured by the Luff-Schoorl method (BIPEA, 1976). The samples for diets, feces, and urine were also analyzed for GE using bomb calorimetry (Model 6400, Parr Instruments Co., Moline, IL, USA) and benzoic acid was used as the standard for calibration.
Calculations
After chemical analyses were completed, the apparent total tract digestibility (ATTD) and digestible concentrations of DM, CP, EE, AEE, organic matter (OM), and ADF in diets were calculated according to standard procedures (Adeola, 2001; Kong and Adeola, 2014). The DE and ME values for diets were directly determined from the difference between the excretion of GE both in the feces and urine, and dietary GE intake. The NE concentrations in diets were predicted using the regression equations of Equations 1-7, 1-8, 1-9 (French NE system) and 1-10 (Dutch CVB NE system) as indicated by NRC (2012):
where NE = net energy (kcal/kg DM), ME = metabolizable energy (kcal/kg DM), EE = ether extract (g/kg DM), Starch (g/kg DM), CP = crude protein (g/kg DM), ADF = acid detergent fiber (g/kg DM), DE = digestible energy (kcal/kg DM), DCP = digestible CP (g/kg DM), DEE = digestible ether extract (g/kg DM), DRES = DOM− (DCP+DEE+starch+DADF); DRES = digestible residue (g/kg DM), DOM = digestible organic matter (g/kg DM), DADF = digestible ADF (g/kg DM), Starcham = enzymatically digestible starch (g/kg DM), Suge = enzymatically digestible sugar (g/kg DM), and FCH = Starcham (Starcham that is fermentable, assume 0 except for potato starch)+Sugferm (Sugtotal−Suge)+DOM−DCP−DAEE− Starcham−Sugartotal×0.95.
The average NE value (NEINRA) was also calculated from data derived from the Equation 1-7, 1-8, and 1-9 of French NE systems. The NE value (NECVB) was calculated from the Equation 1-10 of Dutch CVB system (Blok, 2006).
Experiment 2: Growth trial
Animals and experimental design
A growth trial was designed to determine the growth performance of early finishing gilts as affected by different NE concentrations in diets that were used in the metabolism trial. A total of 60 early finishing gilts (Landrace×Yorkshire; initial BW, 47.7±3.5 kg) were used to determine the effect of dietary NE concentrations on final BW, average daily gain (ADG), average daily feed intake (ADFI), and feed efficiency (G:F). Pigs were allotted to five dietary treatments with 12 replicates (one pig per replicate) in a completely randomized design. Pigs were housed individually in 1.5×1.6 m pens with totally slatted floors. Each pen was equipped with a 1-hole dry self-feeder and a nipple drinker to allow ad libitum access to feed and water.
Measurements and calculation
The ADG, ADFI, and G:F within each treatment were calculated based on the BW of pigs and feed intake which were recorded weekly after the start of the experiment. The experimental period was 42 d. At the conclusion of the experiment, BW, ADG, ADFI, and G:F for each pig were calculated and summarized within the treatment. The NE intake per 1 kg BW gain (kcal NE/kg of BWG) in early finishing gilts was calculated using the measured NE concentrations in diets from experiment 1 (metabolism trial; NEINRA and NECVB values), feed intake, and BWG.
Statistical analysis
In experiment 1, all data were analyzed using the MIXED procedure of SAS (SAS Institute Inc., Cary, NC, USA) with the individual pig as the experimental unit. Homogeneity of the variances was verified using the UNIVARIATE procedure of SAS (SAS Institute Inc., Cary, NC, USA). Dietary treatment was the main effect, whereas pig and period were random effects in the model. No significant random effects were observed, and therefore, random effects were removed in the final analysis. The LSMEANS procedure was used to calculate mean values. Orthogonal polynomial contrasts were also used to determine linear and quadratic effects of increasing NE concentrations in diets.
In experiment 2, all data were analyzed in a similar manner to experiment 1. Experimental unit was also the individual pig. In addition, simple linear regression analysis was performed to develop prediction models of daily NE intake (kcal/d) from the BW of pigs. Daily NE intake was calculated with both measured NE concentrations in diets from experiment 1 and daily feed intake, whereas the BW of pigs (kg) was the average BW in each week.
In both experiments, a probability of p<0.05 was considered significant, and 0.05<p<0.10 was considered a tendency.
RESULTS
Experiment 1: Metabolism trial
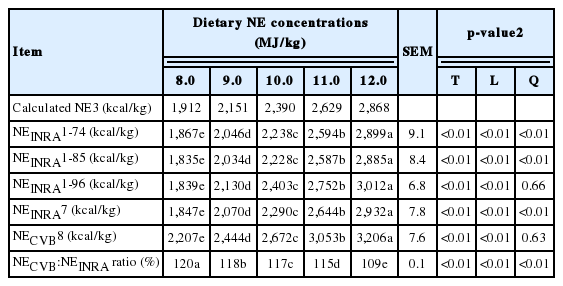
No apparent animal health or technical problems were observed. The ATTD of DM, CP, and OM were increased (linear and quadratic, p<0.01) with increasing NE concentrations in diets from 8.0 to 12.0 MJ/kg NE as calculated basis (Table 2). The ATTD of AEE was also increased (linear, p<0.01) with increasing NE concentrations in diets. The ATTD of ADF in diets containing 11.0 MJ/kg NE was greater (p<0.05) than that of ADF in other diets, but no linear and quadratic responses of the ATTD of ADF in diets to increasing NE concentrations in diets were observed. The digestible CP and EE concentrations (g/kg DM) of the experimental diets were increased (linear and quadratic, p<0.01) as NE concentrations in diets were increased (Table 3). Digestible OM concentrations (g/kg DM) were also increased (linear, p<0.01) with increasing NE concentrations in diets. The digestible ADF concentrations (g/kg DM) were decreased (linear and quadratic, p<0.01) as NE concentrations in diets were increased. The measured DE and ME concentrations in the experimental diets were increased (linear and quadratic, p<0.01) as NE concentrations in diets were increased (Table 4). The ratio of ME to DE was increased (linear and quadratic, p<0.01) with increasing NE concentrations of diets. The measured concentrations of NE of diets based on the Equation 1-7 (NEINRA 1-7) and 1-8 (NEINRA 1-8) were increased (linear and quadratic, p<0.01) with increasing NE concentrations in diets (Table 5). The measured NE concentrations in diets based on the Equation 1-9 (NEINRA 1-9) was increased (linear, p<0.01) with increasing NE concentrations in diets. The average NE values from French NE system (NE INRA) were increased (linear and quadratic, p<0.01) as NE concentrations in diets were increased. Increasing NE concentrations in diets resulted in an increase (linear, p<0.01) measured NE values from the Equation 1-10 (NECVB; Dutch CVB NE system). The ratio of NECVB to NEINRA was decreased (linear and quadratic, p<0.01) with increasing NE concentrations in diets. The NE values for 8.0 MJ/kg (1,912 kcal/kg), 9.0 MJ/kg (2,151 kcal/kg), 10.0 MJ/kg (2,390 kcal/kg), 11.0 MJ/kg (2,629 kcal/kg), and 12.0 MJ/kg (2,868 kcal/kg) calculated based on Sauvant et al. (2004) and NRC (2012) in this experiment were close to the measured average NE values for NE INRA (1,847, 2,070, 2,290, 2,644, and 2,932 kcal NE/kg), but were less than the measured NE values for NECVB (2,207, 2,444, 2,672, 3,053, and 3,206 kcal NE/kg).


Experiment 2: Growth trial
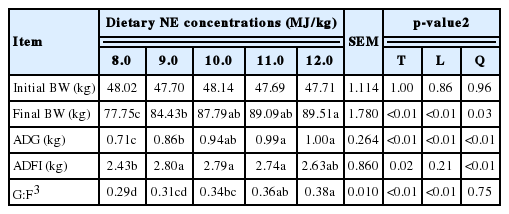
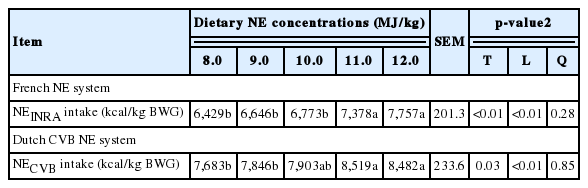
No apparent animal health or technical problems were observed during the entire growth trial. The final BW (linear and quadratic, p<0.05) and ADG (linear and quadratic, p<0.01) were increased with increasing NE concentrations in diets during the overall period (Table 6). There was a quadratic relationship (p<0.01) between ADFI and NE concentrations in diets. The G:F was also increased (linear, p<0.01) with increasing NE concentrations in diets. The NEINRA and NECVB intake per BW gain (kcal NE/kg of BWG) were increased (linear, p<0.01) with increasing NE concentrations in diets (Table 7).
The regression analysis revealed that prediction equations for daily NE intake (NE kcal/d) from NEINRA as a function of BW was daily NE intake (kcal/d) = −1,449.7 +126.6×BW (R2, 0.366; Figure 1), whereas daily NE intake (NE kcal/d) from NECVB as a function of BW was daily NE intake (kcal/d) = −1,347.7+140.42×BW (R2, 0.375; Figure 2).
Linear regression analysis between measured daily net energy net energy (NE) intake calculated from French NE system (= NE concentrations from French NE system×ADFI) and BW of pigs. BW, body weight; ADFI, average daily feed intake.
Linear regression analysis between measured daily net energy (NE) intake calculated from Dutch CVB NE system (= NE concentrations from Dutch CVB NE system×ADFI) and body weight (BW) of pigs. CVB, Centraal Veevoederbureau (Central Bureau for Livestock Feeding); ADFI, average daily feed intake.
DISCUSSION
Experiment 1: Metabolism trial
The NE concentrations in diets affected the ATTD of DM, CP, AEE, and OM in diets. This result is likely related to differences in fiber and lipid concentrations among five diets. To achieve increasing NE concentrations in diets, the concentrations of lipid were gradually increased, whereas those of fiber were accordingly decreased in this experiment. It has been suggested that dietary lipid slows the rate of digesta flow in the gastrointestinal tract, and as a consequence, improves the digestibility of other nutritional components in diets (Valaja and Silijander-Rasi, 2001; Kil et al., 2013a; Kim et al., 2013). On the other hand, increasing fiber concentrations in diets have been reported to decrease the ATTD of nutrients in diets (Yin et al., 2000; Le Goff and Noblet, 2001).
In the present study, the NE values of five experimental diets fed to early finishing gilts were not different between calculated NE values from NRC (2012) and Sauvant et al. (2004) feed ingredient table and measured NEINRA values, but the NECVB values were greater than NEINRA values. This result is in agreement with the previous experiment reporting that the NE values predicted from Dutch CVB NE system appeared to be greater than those predicted from the French NE system (Kil et al., 2013b). The French and Dutch CVB NE systems use the concentrations of digestible nutrients in feed ingredients to estimate the NE values of feeds and feed ingredients in a similar way (Rijnen et al., 2004). However, the Dutch NE system separates total digestible carbohydrates of starch and sugar into an enzymatically-digestible fraction and a fermentable fraction because of differences in energetic utilization of carbohydrates when they are utilized in either the small intestine or the large intestine of pigs (Blok, 2006). In addition, the Dutch CVB NE system quantifies digestible fat amounts based on the ATTD of fat determined with the amounts of acid-hydrolyzed EE in both feeds and feces, whereas the French NE system calculates digestible fat amounts based on the ATTD of fat determined with the amounts of EE in feeds and those of acid-hydrolyzed EE in feces (Noblet et al., 1994; Blok, 2006). This difference may be another reason for the observation that NE values calculated from the Dutch CVB NE system were greater than those calculated from the French NE system. However, the relative contribution of different digestible nutrient fractions seems comparable between these two NE systems (Kil et al., 2013b), such that the hierarchy of NE values for diets and feed ingredients is expected to be similar between the two European NE systems although absolute energy values can differ (Kil et al., 2013b). This notion was also supported by our result of similar hierarchy of NE concentrations in five different diets used in this experiment. An interesting finding in this experiment was the ratio of NECVB to NEINRA was decreased with increasing NE concentrations in diets. This result is likely consequence of increasing lipid concentrations in diets as NE concentrations in diets were increased in this experiment, which suggests that if diets contain high amounts of lipids, the NE concentrations in diets predicted from either NECVB or NEINRA would become similar.
Experiment 2: Growth trial
The final BW, ADG, and G:F were increased with increasing NE concentrations in diets. These results were different to those by Quiniou and Noblet (2012) who reported that ADG and G:F were not different among dietary treatments (8.1, 8.7, 9.3, 9.9, 10.5, and 11.1 MJ/kg NE) during the periods of 35 to 84 kg of BW. They also reported that the ADFI was decreased with increasing NE concentrations in diets. When dietary energy concentrations are decreased, pigs are reported to respond by increasing ADFI (Quiniou and Noblet, 2012). However, our results for ADFI showed decreased ADFI between 9.0 and 12.0 MJ/kg NE of diets but increased ADFI between 8.0 and 9.0 MJ/kg NE in diets. The reason for this result may be associated with high inclusions of distillers dried grains with solubles, sugar beet pulp, palm kernel meal, and copra meal in diets containing 8.0 MJ/kg NE. Anguita et al. (2007) reported that animals fed high amounts of fibrous ingredients such as sugar beet pulp showed decreased voluntary feed intake probably as a result of the higher water holding capacity of the diet, which leads to an increase in water retention capacity and gut fill (Bertin et al., 1988). In the present study, feed efficiency was increased linearly as NE concentrations in diets were increased from 8.0 to 12.0 MJ/kg. This result indicates the NE concentrations in diets required for early finishing gilts may exceed 12.0 MJ/kg (2,868 kcal/kg) of diets, which is greater than the current recommended NE concentrations (2,475 kcal/kg) (NRC, 2012) in diets fed to finishing gilts. To our knowledge, however, our experiment is the first to report the improvements in the growth performance of finishing gilts by feeding diets containing increasing NE concentrations above the NE recommendation such that the clear explanation for this observation is difficult to be made. Thus, more research regarding the NE concentrations in diets to optimize growth performance of early finishing gilts is required.
In this experiment, the NE intake per BW gain was increased when dietary NE concentrations were increased. This result agrees with previous experiments using weanling pigs (Oresanya et al., 2008) and growing-finishing pigs (Quiniou and Noblet, 2012). However, no difference in NE intake per BW gain was observed in either pigs fed the diets containing from 8.0 to 10.0 MJ NE/kg or pigs fed the diets containing from 11.0 to 12.0 MJ NE/kg when the NE intake was calculated from either NEINRA or NECVB. Quiniou and Noblet (2012) reported that for pigs with a BW ranging between 48 and 84 kg, the NE intake per BW gain was 6,795 kcal NE/kg BWG when NE concentrations in diets ranged from 8.1 to 11.1 MJ/kg. This value is in good agreement with our NE intake per BW gain from NEINRA (6,806 kcal/kg NE) when the value was averaged between 8.0 and 11.0 MJ/kg in this experiment. However, our result for the NE intake per BW gain of pigs fed diets containing 12.0 MJ NE/kg was greater than other treatments. This result may be due to higher fat depositions in pigs fed diets containing 12.0 MJ NE/kg.
We also predicted daily NE intake from the BW of pigs with the data for ADFI, measured NE concentrations (i.e., NEINRA and NECVB), and the BW of each pig. However, the predictability seems very low (R2, 0.366 and 0.374 for NEINRA and NECVB, respectively) because of large variation in daily NE intake possibly caused by age (or BW), environment, and their interaction. Therefore, it can be concluded that the BW of early finishing gilts is not a suitable sole source of variables for the prediction of the daily NE intake.
In conclusion, the calculated NE concentrations in diets fed to early finishing gilts from NRC (2012) and Sauvant et al. (2004) are close to the NE concentrations predicted from the French NE system, but are less than those predicted from the Dutch CVB NE system. Increasing NE concentrations in diets from 8.0 to 12.0 MJ/kg (calculated) improves the BW, ADG, and G:F of early finishing gilts. The BW of early finishing gilts cannot be a sole source of prediction variable for daily NE intake.
ACKNOWLEDGMENTS
This research was carried out with the support of the Cooperative Research Program for Agriculture Science and Technology Development (ID: PJ00934003), Rural Development Administration, Republic of Korea. This research was also supported by the Chung-Ang University Research Scholarship Grants in 2015.
Notes
CONFLICT OF INTEREST
We certify that there is no conflict of interest with any financial organization regarding the material discussed in the manuscript.