Effects of Direct-fed Microbial and Pine Cone Extract on Carcass Traits and Meat Quality of Hanwoo (Korean Native Cattle)
Article information
Abstract
The carcass traits and meat quality of Hanwoo (Korean native cattle) whose diets were supplemented with direct-fed microbial (DFM) and pine cone extract (PCE) were evaluated. Twenty head of Hanwoo steers were divided equally into four groups and for a period of 6 months were given different diets: One group was fed a basal diet as control (CON), the other three groups were fed a basal diet supplemented with DFM-1%, DFM+PCE-1% and DFM+PEC-3%, respectively. DFM+PCE3% diet resulted the lowest carcass quality grade. The loins of DFM-1% contained higher moisture and lower fat than did the loins from the CON group. The crude protein content of DFM+PCE-3% group was significantly higher than that of the other groups. The water holding capacity and Warner-Bratzler shear force of the DFM+PCE-1% and 3% groups were lower than those of the CON and DFM-1% groups. The DFM-1% and 3% groups contained lower saturated fatty acid, higher unsaturated fatty acid, mono-unsaturated fatty acid, and poly-unsaturated fatty acid than did CON and DFM+PCE 1% group. Moreover, the n6:n3 ratios of DFM-1% and DFM+PCE-1% and 3% groups were slightly lower than that of the CON group. Thus we concluded that DFM and PCE supplementation resulted healthier Hanwoo beef with lower fat content and n6:n3 ratio.
INTRODUCTION
Hanwoo beef is renowned for its juiciness, tenderness and flavor. Hanwoo beef is preferred by Korean consumers over imported beef, such as Aberdeen Angus or Holstein steer (Hwang et al., 2010). As such, the price of Hanwoo beef is generally considered to be the highest quality—and often the most expensive—beef in Korea. To maintain and improve the meat quality characteristics of Hanwoo beef, the feed and feeding management must also be improved. Feed supplementation and additives are often required to increase both the general performance of cattle and the quality of the beef and more specific purposes, such as improving the feed metabolism (Weese et al., 2008).
Probiotics are defined as live microbial feed supplements that provide post-ruminal benefit effects, including the facilitation of beneficial gut microflora establishment and improving its intestinal microbial balance. Because probiotics are composed of a wide variety of viable microbial cultures, culture extracts, enzyme preparations and its combination, thereof the US FDA has required that the term “direct-fed microbial” (DFM) be used in place of ‘probiotics’ when referring to a source of live, naturally occurring microorganisms (Krehbiel et al., 2003).
According to Weese et al. (2008), supplementing diets with DFM enhances the health status and immune regulation and increases the performance factor of host animals. DFM is also known to exhibit alternative antibiotic characteristics in digestive tracts (Krehbiel et al., 2003). DFM have been added as dietary supplements on the feed of cattle (Vyas et al., 2014). Seo et al. (2010) categorized microorganisms used as DFM for ruminants as lactic acid-producing bacteria, such as Lactobacillus, Bifidobacterium, Streptococcus and Enterococcus species; lactic acid-utilizing bacteria, including Megasphaera and Propionibacterium species; yeast and fungi. These bacteria act in both the intestinal tract as well as in the post-gastrointestinal tract. Lactobacillus was found to increased daily weight gain and improved feed efficiency in yearling steers fed a high-concentrate diet compared with control steers (Ware et al., 1988). Bacillus reduces the occurrence of diarrhea in piglets by modulating the immune reaction (Scharek-Tedin et al., 2013). Zerby et al. (2011) demonstrated that Saccharomyces cerevisiae improved the growth and carcass characteristics of lambs and steers. The use of those bacteria as dietary supplements for Hanwoo cattle is, however, remains still limited.
Plant extracts are secondary plant metabolites that may improve animal performance and health when used as effective feed additives for livestock (Liu et al., 2013). Pines (family Pinaceae, genus Pinus) are widely distributed globally around the world and are among the most important forest trees. Plantations of Korean pine (Pinus koraiensis), Japanese red pine (Pinus densiflora) and pitch pine (Pinus rigida) make up major pine plantations in Korea, with production increasing in recent years (Choi et al., 2005). As plantations expand, the production of pine cone, which are normally unused are also growing. Extract from pine cone shaves potential medical benefits for human, such as antitumor, antiviral and immune-potencies for human (Sakagami et al., 1991). Thus, the pine cone extract (PCE) may also be the effective dietary supplements for cattle.
Many studies have examined the effect of DFM supplementation and natural feed additives on the performance of live cattle and on carcass quality. To our knowledge, however, studies examining the effect of DFM and natural feed additives on meat are largely lacking. This research was conducted in order to evaluate the effect of dietary supplementation of DFM and PCE on the quality of Hanwoo cattle.
MATERIALS AND METHODS
Probiotic and diets
The direct-fed microbial/DFM used in this study contained Bacillus subtilis (±1.7×10⁷ log colony-forming unit [cfu]), Lactobacillus plantarum (±1.3×10⁷ log cfu) and Saccharomyces cerevisiae (±7.5×10⁷ log cfu). Two mixtures were formulated: the first consisting of 5% DFM, 70% growth media (corn, soybean hulls and barley) and 25% water (DFM), and the second consisting of 5% DFM, 70% growth media, 12.5% water and 12.5% of aqueous pine cone extract (DFM+PCE). The PCE was obtained via stem extraction. Probiotic mixtures was fermented at room temperature (±25°C) for 48 h until the moisture content reached 12%. The feed compositions are presented in Table 1.

Ingredient and chemical composition of formula feed (DM basis)
Experimental animals
A total of 20 heads of Hanwoo steers (23.50±1.62 months old) were randomly assigned to four different diets with feeding restriction system, with each group consisting of four animals. The average initial body weight was 592.20±69.13 kg. The control group (CON) was fed basal diet devoid of DFM, and the three other groups were fed basal diet supplemented with DFM-1%, DFM+PCE-1% or DFM+PCE-3%, respectively. Animals within the same group were raised in a 5×10 m pen on a farm located in the Gapyeong Agricultural Technology Center in Kyeonggi Province, South Korea. Feed intake and growth performance are shown in Table 2. After 6 months of feeding period, the animals were slaughtered in the Nonghyup Bucheon slaughtering house in Bucheon city, South Korea. The carcasses were weighed and then chilled at 2°C±2°C for 24 h in chilling room. Carcass traits were estimated using the Korean carcass grading system (KAPE, 2010). Parameters used to determine yield grade (hot carcass weight, backfat thickness and ribeye area) and quality grade (marbling score) were recorded. The loins (longissimus dorsi 1st lumbar vertebrae) were obtained, vacuum-packed, placed in an ice box and transported to Meat Science Laboratory at Kangwon National University. The loins were divided into two parts; the first part was stored at −70°C for proximate and fatty acid composition analyses and the second part was used for meat quality analyses.
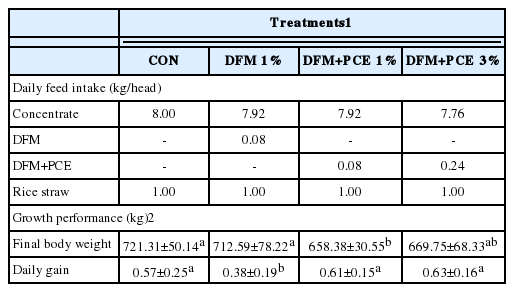
Feed intake and growth performance
Proximate analysis
The frozen beef were allowed to thaw overnight at 4°C prior to the meat quality analyses. The proximate analyses, including moisture, crude protein, crude fat and ash content, were performed according to methods outlined by the Association of Official Analytical Chemists methods (AOAC, 2007).
pH and instrumental color
The pH of meat slurry was measured at room temperature using a pH meter (SevenEasy pH, Mettler-Toledo GmbH, Giessen, Switzerland). A 10 g of each sample was homogenized with 100 mL of distilled water at 10,000 rpm for 60 s using a homogenizer (PH91, SMT Co. Ltd., Tokyo, Japan). The instrumental Commission internationale de l’éclairage (CIE) color of samples, including lightness (CIE L*), redness (CIE a*), yellowness (CIE b*), chroma and hue angle, were measured using a color difference meter (CR-400, Konica Minolta Sensing Inc., Tokyo, Japan). The color meter was standardized using a white plate (Illuminant C: Y = 93.6, x = 0.3134, and y = 0.3194). Ten times random measurements were taken for each sample.
Total myoglobin content
Total myoglobin content was analyzed according to the procedure described in Sammel et al. (2002). First, 5 g of each sample was homogenized with 15 mL of cold distilled water using a homogenizer (UltraTurrax T25 basic, IkaWerke GmbH and Co., Staufen, Germany) at 13,000 rpm for 10 s. The homogenate was kept at 4°C for an hour, then was centrifuged at 10,000×g for 30 min using a rotor JA-20 (Beckman Instruments, Inc., Palo Alto, CA, USA). and a centrifuge J2-21 (Beckman Instruments, Inc., USA). Supernatant was filtered through 0.45 syringe filter (Hydrophilic PTFE, Adventec MFS, Inc., Dublin, CA, USA). The absorbance of the supernatant was measured at a wavelength of 525 nm using a spectrophotometer (UV-mini-1240, Shimadzu, Kyoto, Japan).
Water holding capacity and cooking loss
The water holding capacity (WHC) was performed according to filter paper-pressed method described by Grau and Hamm (1953), whereby 0.3 g of each samples was weighed on a Whatman filter paper (No. 2), and then the samples were pressed between 2 plexiglass plates for 5 min. The areas of pressed sample and water were measured using a planimeter (Super Planix α, Tamaya Technics Inc., Tokyo, Japan). The WHC was calculated as follows:
To determine the cooking loss, 100 g of sample were boiled individually in polyethylene bags immersed in an 80°C water bath for 30 min, and then removed and allowed to cool. The samples were cooled for an additional 30 min. The initial weights of uncooked and cooked meat were recorded, and the cooking loss was calculated as follows:
Wu = Weight of uncooked meat (g)
Wc = Weight of cooked meat (g)
Warner-Blatzer shear force and texture profile analysis
Cooked sample (following cooking loss determination) were cut into cubes (1×1×1 cm), and Warner-Blatzer shear force (WBSF) and texture profile analysis (TPA) were measured using a texture analyzer (TA-XT2i version 6.06, Stable Micro Systems Ltd., Surrey, UK). The TPA parameters included hardness, adhesiveness, springiness, gumminess, chewiness, cohesiveness, and resilience and were measured twice at 70% compression with a pre-test speed 1.0 mm/s, a test speed 1.0 mm/s and a posttest speed of 5.0 mm/s, with a 2 s rest period between two cycles. Ten measurements were performed on the meat of each of 16 head of cattle.
Thiobarbituric acid reactive substances
Thiobarbituric acid reactive substances (TBARS) value was measured according to the procedure outlined by Sinnhuber and Yu (1977), whereby 0.5 g of ground beef were mixed with 3 drops of antioxidant solution (3% butylated hydroxyanisole-54% propylene glycol-3% butylated hydroxytoluene-40% Tween20), 3 mL of thiobarbituric acid solution (1% 4,6-Dihydroxy-2-mercaptopyrimidine), and 17 mL of 25% trichloroacetic acid. The mixture was heated at 100°C for 30 min and then, centrifuged at 3,000×g for 30 min. An absorbance of supernatant was measured at a wavelength of 532 nm using a spectrophotometer (UV-mini-1240, Shimadzu, Japan). The results were calculated as mg malonaldehyde per kg sample. A total of four measurements were performed on each samples.
Fatty acid composition
Lipids of samples were extracted from the samples using the methods described by Folch et al. (1957), in which 5 g of each sample was homogenized with 25 mL of chloroform:methanol (2:1, v/v) at 13,500 rpm using a homogenizer (Ultra Turax T25 basic, Ika WerkeGmbh & Co., Staufen, Germany). The homogenates were added with 0.88% of KCl and then were centrifuged at 3,000×g for 10 min. The supernatant was evaporated at 38°C on an N2 gas blowing concentrator (MG 2200, Eyela Co., Tokyo, Japan). The methylation was performed according to procedure set out by AOAC (2007). Briefly, 200 μL extracted lipid and 2 mL of 2 N NaOH were vortex-mixed and heated at 80°C for 60 min. The samples were cooled by immersing in cold water, vortex-mixed with 2 mL of 25% BF3-MeOH, heated again at 80°C for 60 min. After cooling for 10 min in cold water, the samples were mixed again with 3 mL of distilled water and 2 mL of hexane, vortexed and centrifuged at 3,000×g for 10 min. About 1.5 mL of the upper layer was collected and moved into vials. The fatty acid composition of each sample was analyzed using an Agilent 6890 N (Agilent Technologies, Inc., Santa Clara, CA, USA) equipped with the automatic sampler Agilent 7683 (Agilent Technologies, Inc., USA) and an HP-Innowax column (30 m length×0.32 mm i.d. ×0.25 μm film thickness; Agilent Technologies, Inc., USA). One microliter of sample was injected (split 1:10; 260°C) and then was carried out at a flow rate of 1.0 mL/min using helium. Oven temperatures were set at 150°C for 1 min, 150°C to 200°C at 15°C/min, 200°C to 250°C at 3°C/min, and 250°C for 5 min. The flame ionization detector was set at 280°C. The fatty acid peaks were identified and quantified by comparison with the retention time and peak area of fatty acid standards (47015-U, Supelco Analytical, Bellefonte, PA, USA).
Statistical analysis
Data were analyzed using SPSS statistic 19.0 for Windows Evaluation Version (2010). One-way analysis of variance followed by Duncan’s multiple range tests were used to determine statistical significance among the means at 95% significance level.
RESULTS
Table 2 shows that by daily restriction feeding of each diet of 9 kg, the final body weight of DFM+PCE1% and DFM+PCE3% groups were lower than that of CON and DFM1% groups. However, the average daily gain of DFM1% group was the lowest among other diet groups. DFM+PCE supplementation up to 3% did not affect average daily gain of Hanwoo steers during finishing period.
The means of carcass traits of Hanwoo cattle fed with DFM and PCE are shown in Table 3. Supplementation of DFM+PCE3% resulted higher hot carcass weight and larger rib eye area than that of DFM+PCE1% group, however both treatments had lower mean values than CON and DFM1% groups. No significant differences were found among diet groups on back fat thickness. The lowest average marbling score was found on DFM+PCE3% group, showing the leanest loin among other diet groups, while DFM+PCE1% group had better marbling score than DFM1% group. The yield index and grade were not different among diet groups. CON group had the highest quality grade followed by DFM+PCE1%, DFM1%, and DFM+PCE3% groups.

Carcass traits of Hanwoo cattle fed a diet supplemented with DFM and PCE
Table 4 summarizes the proximate analysis and quality characteristics data of DFM and PCE supplemented Hanwoo beef. No differences for crude ash content, cooking loss and myoglobin content were detected among the treatments. Hanwoo cattle fed diet supplemented with DFM-1% and DFM+PCE-1% and 3% had higher moisture and lower fat contents compared with the control groups. DFM+PCE-1% and 3% supplementation tended to improve the crude protein content of the meat; whereas the DFM+PCE-3% groups was significantly higher than that of the other groups.
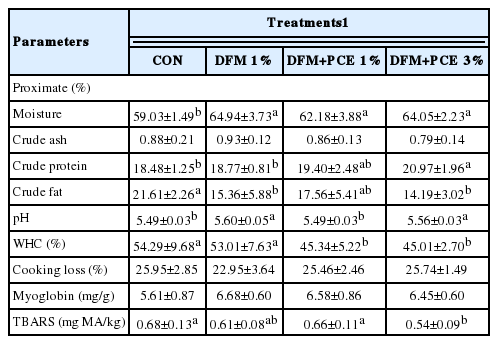
Proximate and quality characteristics of beef from Hanwoo cattle fed a diet supplemented with DFM and PCE
The pH of all groups is ranged from 5.49 to 5.60. The WHC of DFM+PCE-1% and 3% groups were significantly lower than those of the CON and DFM-1% groups but WHC between the CON and DFM-1% was not significantly different. The lowest TBARS value derived from the DFM+PCE-3% (p<0.05) groups; with no significant difference in TBARS value was observed among the other three groups.
Table 5 shows the instrumental color of Hanwoo loin taken from cattle whose diet was supplemented with DFM and PCE. Dietary supplementation with DFM significantly reduced the CIE L* of loin (p<0.05). The presence or absence of PCE had no effect on the color differential. No significant difference in CIE a*, CIE b* and chroma were found between CON and treatment groups.
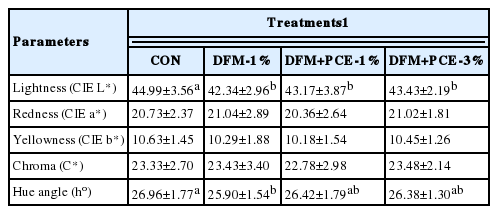
Instrumental color of beef from Hanwoo cattle fed a diet supplemented with DFM and PCE
The results of the TPA and texture obtained with WBSF analyses are presented in Table 6. No differences in fractuability, adhesiveness, cohesiveness and resilience of TPA were found among the experimental groups, and no difference was found in the WBSF value between CON and DFM-1% groups. The hardness (TPA) of the CON group was lower than that of the three treatment groups. The loins of Hanwoo fed DFM- or DFM+PCE-supplemented diets had higher gumminess and chewiness compared to CON group (p<0.05). However, there was no difference in hardness, gumminess and chewiness among the DFM and DFM+PCE-1% and 3% groups (p>0.05).
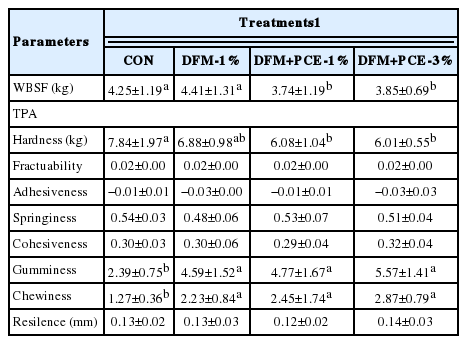
Warner-Blatzer shear force (WBSF; kg) and texture profile analysis (TPA) of beef from Hanwoo cattle fed a diet supplemented with DFM and PCE
Fatty acid compounds of Hanwoo fed a diet supplemented with DFM and CPE are presented in Table 7. Palmitic and oleic acid were the primary fatty acid compounds found in the Hanwoo beef examined in the present study. No difference in palmitoleic acid, oleic acid, vaccenic acid, alpha-linolenic acid, cis-eicosonic acid and arachidonic acid was found among the treatment groups (p>0.05). The total saturated fatty acid (SFA), unsaturated fatty acid (UFA), mono-unsaturated fatty acid (MUFA), and poly-unsaturated fatty acid (PUFA) of the DFM-1% and DFM+PCE-3% groups were higher than those of CON and DFM+PCE-1% groups. Moreover, the n6:n3 ratios of the DFM and DFM+PCE-1% and 3% were slightly lower than that of the CON group.

Fatty acid compounds of beef from Hanwoo cattle fed a diet supplemented with DFM and PCE
DISCUSSION
The effect of DFM and PCE inclusion in the finishing diet of Hanwoo steers significantly appeared on growth performance, particularly average daily gain. Because the differences on final body weight were merely caused by different age. CON and DFM1% groups consisted of Hanwoo steers that were one month older than DFM+PCE-1% and 3% groups. It can be seen by large variation on initial age. Our result of supplementation of DFM1% alone without PCE was not in line with previous finding (Vyas et al., 2014). Sex and diet may be responsible for this reason. However, DFM+PCE groups did not show any differences. Different age also affected hot carcass weight and rib eye area. Although DFM+PCE3% diet resulted the lowest carcass quality grade, our results suggest that the healthier beef can be produced by the supplementation of DFM+PCE3% during fattening period. Hanwoo cattle fed a diet supplemented with DFM-1% and DFM+PCE-1% and 3% had higher moisture and a lower fat content compared with the control groups. Breed type and diet are major factors influencing lipid deposition in meat (Costa et al., 2013); our results suggest that DFM and PCE supplementation decreased the fat deposition in muscle. DFM supplementation alone (i.e., without PCE) did not improve crude protein content. However, the inclusion of DFM+PCE-1% and 3% tended to improve the crude protein content of the meat; the crude protein content of the DFM+PCE-3% groups was significantly higher than that of the other groups. It would appear that the proximate quality of Hanwoo cattle whose dietary was supplemented with DFM+PCE-3% had better proximate content than did the other groups due to the lower fat and higher protein contents of its beef. Meat with lower fat and higher protein contents are generally regarded as being healthier for consumers. The inclusion DFM and bioactive compounds from PCE on ruminant’s diet may affect rumen microbiome, fermentation, and biohydrogenation, where starch levels on fattening diet supports the growth of lactic acid bacteria and yeast used in this study. Musso et al. (2010) highlighted that gut microbiota is associated with host energy metabolism. When lactic acid-producing bacteria is predominant, the harvesting of energy from diet increases, reducing fat deposition and regulating tissue fatty acid composition.
The pH of all groups of our results are slightly higher than those of Ba et al. (2014), who reported the pH values 5.43 and 5.47 for Hanwoo loin and semitendinosus muscles, respectively, and of Kim and Lee (2003), who recorded pH levels 5.47, 5.47, and 5.49 for Hanwoo loin grade 1, 2, and 3, respectively. There was no significant difference in WHC between the CON and DFM-1% groups, both of which fell within the normal range as compared of 51% to 55% WHC for Hanwoo loin ascertained by Kim and Lee (2003). However, the WHC of DFM+PCE-1% and 3% groups were significantly lower than those of the CON and DFM-1% groups. Apple (2007) stated that poor WHC is largely caused by pre-slaughter handling.
Hanwoo beef whose fed DFM+PCE-3%-supplemented diet had the lowest TBARS value among the other three groups (p<0.05); with no significant differences in TBARS value were observed among the other three groups. Xu et al. (2012) reported that because PCE influenced on superoxide radical scavenging, it has potential as natural antioxidant agents in functional foods or medicine. Our data showed that PCE may also exhibit antioxidant properties when used as feed additives to cattle feed. A comparison to other studies is made difficult; however, by the lack of research examining the use of PCE in cattle feed.
The loin meat from Hanwoo cattle that were fed DFM supplemented diet was darker than the loin meat collected from Hanwoo cattle that were fed control diet. The presence or absence of PCE had no effect on the color differential. A slightly difference in hue angle (h) was also found; in which loin meat of Hanwoo cattle fed a DFM-supplemented diet had higher h value than did control cattle. No significant difference in CIE a*, CIE b*, and chroma were found between CON and treatment groups. The instrumental color of L* and a* value in our results were similar to that observed by Ba et al. (2014), but the CIE b* value was lower. This might be related to different finishing diet. The CIE a* values of all groups was regarded as grade 1 according to Kim and Lee (2003).
The WBSF values for both the DFM+PCE-1% and 3% groups were significantly lower (p<0.05) than those of CON and DFM groups. This effect is regardless the percentage of DFM+CPE on diet. The WBSF of all groups in our study were higher than LD but similar to the semitendinosus muscle reported by Ba et al. (2014), and lower than that observed by Kim and Lee (2003).
The hardness (TPA) of the CON group was lower than that of the three treatment groups. The data suggests that supplementation with DFM+PCE-1% and 3% improved the texture quality of Hanwoo beef. This finding might be due to the relatively higher protein intake of DFM and DFM+PCE groups, as cattle in those groups consumed more protein, which was sourced from protein-bacteria (DFM) than did control animals. Dietary protein has been shown to influence instrumental texture variability (Marino et al., 2011). Berge et al. (1993), for instance, found that meat tenderness decreased in steers that were fed with higher protein-content diets. The loins of Hanwoo fed DFM- or DFM+PCE-supplemented diets had higher gumminess and chewiness compared to CON group (p<0.05).
Palmitic and oleic acid were the primary fatty acid compounds found in the Hanwoo beef examined in the present study, a finding in accordance with that of Ba et al. (2014) who found that palmitic and oleic acid as the major fatty acid in Hanwoo. The supplementation of DFM+PCE-1% to the Hanwoo cattle’s diet did not affect the composition of fatty acids, but it did lower the total unsaturated and mono-UFA as compared with CON group. However, the palmitic acid (C16:0) content was decreased, whereas the stearic acid (C18:0) and other PUFAs; gamma-linolenic acid (C18:3n6), eicosapentaenoic acid (C20:5n3), adrenic acid (C22:4n6) and docosahexaenoic acid (C22:6n3), was increased in the DFM-1% and DFM+PCE-3% compared with the CON and DFM groups (p<0.05). According to Wood et al. (2008), the major factor influencing the fatty acid composition of muscle in cattle is the total amount of fat in the muscle, which, in turn, the total amount of fat in muscle depends on the amount of triacylglycerols, a variable that is highly dependent on the degree of overall body fatness, the muscle type and the breed of cattle (Scollan et al., 2006).
The PUFA contents in our samples of all groups (3.68% to 5.16%) were higher than those reported by Panjono et al. (2011), who found 2.92% and 3.21% of PUFA of Hanwoo raised in summer and winter, respectively. The author of that study also noted that slaughter season and raising altitude affected fatty acids profiles in Hanwoo beef. The roles that genetic and nutrition play in determining relation to fatty acid composition of beef have both been widely studied, although it is generally recognized that genetic factors have less influence than do dietary factors (Scollan et al., 2006). The results showed that the highest PUFA content was found in the leanest beef from DFM+PCE-3% group. Wood et al. (2008) mentioned that lean muscle of animals contains higher phospholipid, which has much more PUFA content than SFA.
CONCLUSION
Supplementing the diet of Hanwoo cattle with DFM resulted in beef that had higher moisture and lower fat content compared with control animals, regardless of PCE addition. Moreover, supplementing cattle diet with DFM+PCE-1% and 3% tended to improve the crude protein content of the meat and lower TBARS value. The DFM supplementation on diet resulted slightly darker color and the PCE diet improved the tenderness. Supplementation with DFM+PCE-3% is considered producing healthier Hanwoo beef loin with lower fat content and higher PUFA content than without supplementation.
ACKNOWLEDGMENTS
This research was supported by Rural Development Administration Korea, under the grant number PJ00937201.
Notes
CONFLICT OF INTEREST
We certify that there is no conflict of interest with any financial organization regarding the material discussed in the manuscript.