Performance, Carcass Quality and Fatty Acid Profile of Crossbred Wagyu Beef Steers Receiving Palm and/or Linseed Oil
Article information
Abstract
The objective of this study was to determine the effect of palm and/or linseed oil (LSO) supplementation on carcass quality, sensory evaluation and fatty acid profile of beef from crossbred Wagyu beef steers. Twenty four fattening Wagyu crossbred beef steers (50% Wagyu), averaging 640±18 kg live weight (LW) and approximately 30 mo old, were stratified and randomly assigned in completely randomized design into 3 treatment groups. All steers were fed approximately 7 kg/d of 14% crude protein concentrate with ad libitum rice straw and had free access to clean water and were individually housed in a free-stall unit. The treatments were i) control concentrate plus 200 g/d of palm oil; ii) control concentrate plus 100 g/d of palm oil and 100 g/d of LSO, iii) control concentrate plus 200 g/d of LSO. This present study demonstrated that supplementation of LSO rich in C18:3n-3 did not influence feed intakes, LW changes, carcass and muscle characteristics, sensory and physical properties. LSO increased C18:3n-3, C22:6n-3, and n-3 polyunsaturated fatty acids (PUFA), however, it decreased C18:1t-11, C18:2n-6, cis-9, trans-11, and trans-10,cis-12 conjugated linoleic acids, n-6 PUFA and n-6:n-3 ratio in Longissimus dorsi and Semimembranosus muscles.
INTRODUCTION
The health benefits of α-linolenic acid (C18:3n-3) have become a leading topic for nutritional science research. The long-chain polyunsaturated fatty acids (LC-PUFA), especially linoleic acid (C18:2n-6) and C18:3n-3 have anticarcinogenic and cardioprotective roles in humans (Parodi, 1997). As a result, public health guidelines in most developed countries have recommended decreases in saturated and trans fatty acids and an increase in 18:3n-3, 20:5n-3, and 22:6n-3 in the human diet to reduce the incidence of chronic disease (World Health Organization, 2003). A reduction in the consumption of saturated fatty acids (SFA) and an increase in the consumption of polyunsaturated fatty acids (PUFA, fatty acids with more than one double bond) is encouraged, while monounsaturated fatty acids (fatty acids with one double bond; MUFA) are generally regarded as beneficial for human health. The main sources of supplementary fatty acids in ruminant rations are plant oils and oilseeds. Supplementation of plant oils and oilseeds rich in omega-3 fatty acids could increase omega-3 fatty acids in beef fat.
Challenges in increasing the n-3 FA content of ruminant tissues and products differ from non-ruminants. In addition to the issues of the effects of unsaturated fatty acids (UFAs) on the stability and sensory acceptability of products, these FAs inhibit various essential anaerobic bacteria of the rumen, especially those involved in fiber digestion, biohydrogenation of UFAs, and methanogenesis (Palmquist and Jenkins, 1980). Of major concern in modifying the FA composition of animal products is ruminal biohydrogenation; under almost all feeding conditions, >80% of dietary UFAs are partially biohydrogenated to myriad trans unsaturated products or completely biohydrogenated to saturated products, mainly stearic acid (C18:0). Only in recent years has a general interest caused detailed investigation of biohydrogenation processes and the associated microbiology. Most of the research aimed at improving dietary quality of beef has been focused on manipulation of animal feed with attempts to increase the content of 2 groups of fatty acids - intramuscular n-3 PUFA and conjugated linoleic acid (CLA) contents accomplished by feeding n-3 PUFA or linoleic acid (C18:2n-6) rich in ruminants’ diets (Scollan et al., 2006; Palmquist, 2009). In addition, low PUFA n-6/n-3 ratio aids in the prevention of many chronic diseases. Increasing the content of PUFA and reducing SFA with the net effect of increasing PUFA/SFA and reducing n-6/n-3 ratio are priorities (Scollan et al., 2006). In general, previous studies reported the effect of different linseed form and concentration on performance and on FA composition of muscle and adipose tissue in beef cattle (Mach et al., 2006). Herdmann et al. (2010) found significant increases in the concentrations of n-3 fatty acids (C18:3n-3, C20: 5n-3 and C22:5n-3 and C22:6n-3) in meat from German Holstein Bulls fed 3% linseed oil (LSO) and 12% rapeseed cake. Therefore, supplementation of LSO enriched in C18:3n-3 would increase C18:3n-3 in muscle lipid. Thus, the objective of the present study was to examine the effect of LSO supplementation on performance and beef fatty acid profile of Wagyu crossbred beef steers.
MATERIALS AND METHODS
Animals, experimental design, and treatments
Twenty four Wagyu crossbred fattening steers (50% Wagyu), averaging 640±18 kg live weight (LW) and approximately 30 mo old, were stratified by their LW into 3 groups and each group was randomly assigned to three dietary treatments. All steers were fed approximately 7 kg/d of 14% crude protein (CP) concentrate with ad libitum rice straw and had free access to clean water and were individually housed in a free-stall unit. The treatments were i) control concentrate plus 200 g/d of palm oil (PO); ii) control concentrate plus 100 g/d of PO and 100 g/d of LSO; iii) control concentrate plus 200 g/d of LSO. The PO was added to the first and second group to balance energy concentration in the rations. The chemical composition of concentrate used in the experiment are presented in Table 1 while the fatty acid composition of feed and oils used in the present study are presented in Table 2.

Chemical composition of the experimental diets
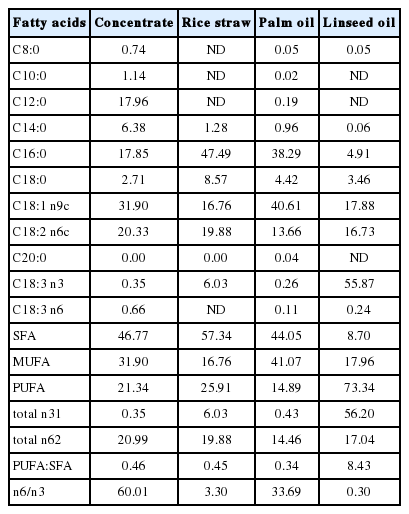
Fatty acid composition (g/100 g fat) of concentrate, rice straw and oils used in the experiment
The basal diet was formulated to meet NRC (2000) requirements. All steers received ad libitum rice straw, had free access to clean water, were individually housed in a free-stall unit, and individually fed according to treatments. The experiment lasted for 67 days with the first 7 days for adjustment, followed by 60 days of measurement period.
Measurements, sample collection, and chemical analysis
Feed refusals from each individual steer was weighed on 2 consecutive days weekly to calculate dry matter intakes (DMI). Samples were taken and dried at 60°C for 48 hours and at the end of the experiment, feed samples were pooled to make representative samples for proximate and detergent analyses. Samples were ground through 1 mm screen and analyzed for chemical composition. Dry matter (DM) was determined by hot air oven at 60°C for 48 h while CP was analyzed by Kjeldahl method (AOAC, 1995). Ether extract was determined by using petroleum ether in a Soxtec System (AOAC, 1995). Fiber fraction, neutral detergent fiber and acid detergent fiber were determined using the method described by Van Soest et al. (1991), adapted for Fiber Analyzer. Ash content was determined by ashing in a muffle furnace at 600°C for 3 h. The chemical analysis was expressed on the basis of the final DM. Fatty acids composition of concentrates, fresh grass and rice straw were determined by gas chromatography (GC).
Meat pH (pH meter model UB-5, Denver Instrument, Gottingen, Germany) was determined in Longissimus dorsi (LD) and Semimembranosus (SM) muscles at 45 min and 24 h. After dissection, the LD and SM samples were cut in to 2.5 cm thick slices, put into polyethylene bags, chilled at 4°C for 48 h and then stored in the refrigerator outside of the bag for 1 h (‘blooming’) before conducting color measurements using a Color Quest XE (HunterLab, Hunter Associates Laboratory, Inc., Reston, VA, USA).
Water-holding capacity was assessed via substance losses occurring during different procedures. Thawing and cooking losses were determined in the 2.5 cm thick slices of LD and SM frozen in polyethylene bags at −20°C. Thawing was performed over 24 h at 4°C. Before weighing, the sample surfaces were dried with soft paper. Afterwards, samples were sealed in heat-resistant plastic bags to be boiled in water bath (WNE 29, Memmert, Schwabach, Germany) at 80°C until an internal temperature of 70°C was reached. Samples were cooled to ambient temperature and weighed after drying the surfaces with soft paper. For the determination of the grilling loss, 2.5 cm thick slices were grilled in a convection oven (model 720, Mara, Taipei, Taiwan) at 150°C until an internal temperature of 70°C was reached. In the LD, additionally drip loss was determined. In the boiled samples, shear force were measured after cooling and drying. A steel hollow-core device with a diameter of 1.27 cm was punched parallel to the muscle fibers to obtain six pieces from each muscle sample. Measurements were carried out on a material testing machine by Texture analyzer (TA-TX2 Texture Analyzer, Stable Micro Systems, Surrey, UK) using a Warner–Bratzler shear. A crosshead speed of 200 mm/min and a 5 kN load cell calibrated to read over a range of 0×100 N were applied.
Samples of the LD and SM were minced and analyzed in duplicate for moisture, fat, ash and protein contents according to AOAC (1995). Total lipids in feed and beef samples were extracted using chloroform-methanol (Folch et al., 1957). Fifteen grams of each sample were homogenized for 2 min with 90 mL of chloroform-methanol (2:1) (Nissei AM-8 Homogenizer, Nihon Seiki Kaisha, LTD., Tokyo, Japan). Samples were then further homogenized for 2 min with 30 mL of chloroform. Then, samples were separated in separating funnel and 30 mL of deionized water and 5 mL of 0.58% NaCl was added. Fatty acid methyl esters (FAME) were prepared by the procedure described by Ostrowska et al. (2000), briefly, placing 30 mg of the extract into a 15 mL reaction tube fitted with a teflon-lined screw cap. One and a half mL of 0.5 M NaOH in methanol was added. The tubes were flushed with nitrogen, capped, heated at 100°C for 5 min with occasional shaking and then cooled to room temperature. One ml of C17:0 internal standard (2.00 mg/mL in hexane) and 2 mL of BF3 in methanol were added and heated at 100°C for 5 min with occasional shaking and 10 mL of deionized water were added. The solution was transferred to a 40 mL centrifuged tube and 5 mL of hexane were added for FAME extraction. The solution was centrifuged at 2,000 g, at 10°C for 20 min and then the hexane layer was dried over sodium sulfate and transferred into a vial for analyzing by GC (7890A GC System, Agilent Technologies, Inc., Wilmington, DE, USA) equipped with a 100 m×0.25 mm×0.2 μm film fused silica capillary column (SP1233, Supelco Inc, Bellefonte, PA, USA). Injector and detector temperatures were 250°C. The column temperature was kept at 70°C for 4 min, then increased at 13°C/min to 175°C and held at 175°C for 27 min, then increased at 4°C/min to 215°C and held at 215°C for 17 min, then increased at 4°C/min to 240°C and held at 240°C for 10 min.
Quantitative descriptive analysis was used for sensory evaluation (Stone et al., 1974), a test panel was selected from a number of students and faculty members of the School of Animal Production Technology, Suranaree University of Technology, who had undergone sensory evaluation training. Grilled 2.5-cm slices of LD and SM were cut into pieces of 1.3×1.3×1.9 cm and served warm. Panelists were asked to grade samples for tenderness, juiciness, flavor and overall acceptability and assessments were given individually using a structured line graph and determined on a straight line. Thus, each point on a linear scale to represent the quantity that can be measured with a ruler. Samples were served subsequently in a randomized order with respect to group and animal. The 24 samples (from 12 animals and two muscles) were tested by 8 persons.
Statistical analysis
All measured data were analysed by analysis of variance for complete randomized design using the Statistical Analysis System (SAS, 2001). Significant differences among treatment were assessed by Duncan’s new multiple range test. A significant level of p<0.05 was used (Steel and Torrie, 1980).
RESULTS AND DISCUSSION
Feed composition and performance
The chemical composition of the feeds are presented in Table 1 and the concentrate was formulated to meet the requirement of the steers. LSO had the highest proportion of PUFA (73.34 g/100 g fat) while PO had the highest proportion of SFA (44.05 g/100 g fat). In the concentrate, the main SFA was C12:0 (17.96 g/100 g fat) and C16:0 (17.85 g/100 g fat), whereas C18:1n-9 was the main MUFA in PO (40.61 g/100 g fat), C18:2n-6 was the main PUFA in 14% CP concentrate (20.33 g/100 g fat) and C18:3n-3 was the main PUFA in LSO (55.87 g/100 g fat) (Table 2). The supplementation of LSO was chosen to reduce SFA (8.70) and to increase n-3 FA (56.20) (Table 2).
No significant difference was found for DM and CP intakes among groups; however, the animals supplemented with LSO tended to have greater concentrate and CP intake than those fed the PO diets (p = 0.05). In particular, CP intake of the animals fed LSO was 97 and 70 g/d higher than those fed PO (Table 3). Palmquist and Jenkins (1980) concluded that fat at 5% to 10% of the diet reduced intake and digestion. Rule et al. (1989) also reported that DMI is often depressed when diets contain more than 8% fat. With diets containing lower levels of added fat, Huerta-Leidenz et al. (1991) reported no influence on daily gain, intake or feed conversion ratio when dietary whole cotton seed of 15% or 30% (3.3% and 6.6% additional fat) was supplemented. In the present trial, fat contents of experimental diets were between 5.0% and 5.1%, it is unlikely that these levels of fat affected feed intake. When individual FA intake was calculated (Table 3), cattle on LSO diets consumed more C18:3n-3 and PUFA and less C16:0, C18:1, SFA, and MUFA than those cattle on PO diet.
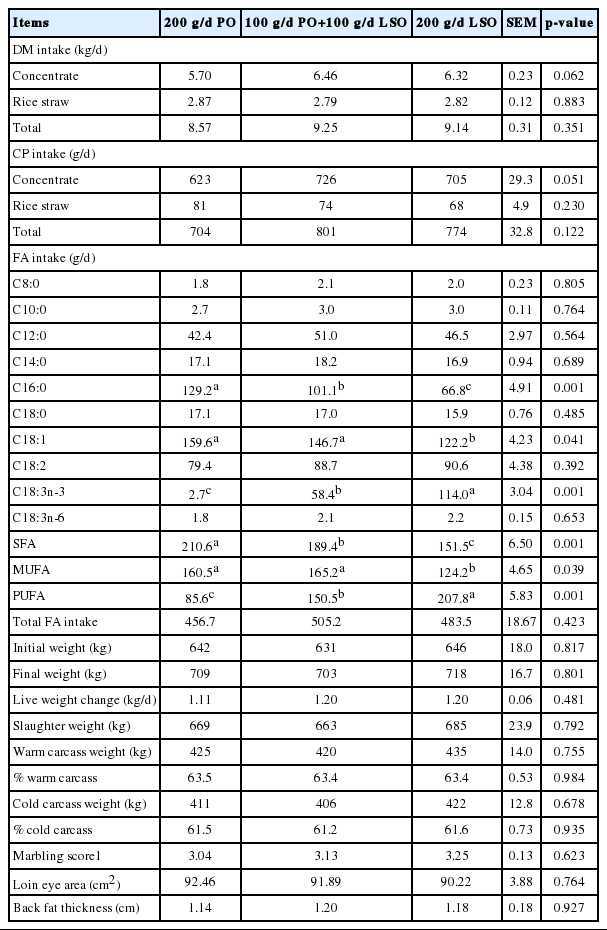
DM and CP intakes, and performances of Wagyu crossbred cattle fed palm and/or linseed oil (n = 8)
No remarkable changes were found for final LW and LW change among the treatments (Table 3). The amount of dietary fat did not affect LW of the steers over the course of the trial; however, LW was increased at 1.11, 1.20, and 1.20 kg/d in the animals fed PO, PO/LSO, and LSO, respectively (Table 3). Similarly, Noci et al. (2007) reported that 150 g/d sunflower oil (SFO) and 150 g/d LSO supplementation did not affected final LW and average daily gain (ADG). This is partially because total net energy (Mcal/d) consumption was balanced by treatment. Furthermore, He and Armentano (2011) supplemented a mixture of flaxseed oil and SFO at 5% of diet and reported no significant effects of supplementation on DMI, body weight, ADG, and gain per unit feed.
Carcass quality
Slaughter weight, warm carcass weight, % warm carcass, cold carcass weight, % cold carcass, beef marbling score, loin eye area (LEA) and back fat thickness were not significantly different among treatments (Table 3). Noci et al. (2007) reported that Charolais crossbred heifers fed 150 g/d SFO and 150 g/d LSO showed no differences in carcass weight and dressing percentage.
The LEA and 12th rib back fat thickness were not significantly different among treatments (Table 3). The eye muscle area can be used as a representative measure of the quantity, quality, and distribution of the muscle mass. Late-maturing muscles are used to represent the muscle tissue development rate. Thus, the longissimus is the most suitable muscle for analysis because, in addition to its late maturation, it is easy to measure. Zinn et al. (2000) did not observe effects on eye muscle area and fat thickness cover using Holstein steers fed diets containing protected fat or animal fat as a lipid source at up to 60.0 g/kg.
Beef quality
Initial (45 min post slaughter) and final pH (24 hour post slaughter) values were not different among the treatments (Table 4). The initial pH was considered ideal and final pH values were also found in the interval considered to be normal (5.4 to 5.8) for beef (Mach et al., 2008). The final pH corresponds to the accumulation of lactic acid resulting from the production of adenosine triphosphate from glucose encountered in the form of glycogen reserves. In general, cattle supplemented with grains possess a greater availability of glycogen at the time of slaughter and a lower final pH in the beef (Neath et al., 2007). The final pH values suggested that there was no elevated stress prior to slaughter, because acidification of the muscle occurred as expected, and that the level of substitution of oil supplement evaluated did not affect the final pH.

Beef characteristics of Wagyu crossbred cattle fed palm and/or linseed oil
The chemical composition of beef composed of moisture, protein, fat and ash were not significantly different among treatments (Table 4). The amounts of fat in the muscle typically result from a balance between dietary energy and metabolic requirements of the animal (Oliveira et al., 2012). If energy intake is higher than its metabolic demands, this excess will be stored as fat. In the present study, the greater supply of lipids in the diet was not enough to increase the deposition of fat in the muscle and back fat. The literature suggests that the total protein content is less variable in bovine meat, with values of approximately 20% observed in the LD muscle without the fat cover, and this is independent of food, breed, the genetic group, and the physiological condition (Marques et al., 2006).
The sensory tenderness, juiciness, beef flavor, color firmness and texture were unaffected by treatments. In another study, German Holstein and Simmental bulls finished on grass or fed a concentrate of silage, barley, and cracked linseed produced beef that had a higher n-3 PUFA content than did beef from animals fed a grass-based diet, but the sensory profiles did not differ, except that meat from grass-finished beef had higher bloody and fishy notes (Nuernberg et al., 2005). On the other hand, when steers were fed diets that had similar base components, but the diets differed in the amount or composition of fatty acids through the addition of different oils, lipid and color stability were more closely associated with fatty acid composition and greater abnormal flavors and rancidity scores (Scollan et al., 2006). Scheeder et al. (2001) evaluated the beef of bulls fed different sources of fat and found that the beef of animals fed with LSO tended to be juicier and to possess a more agreeable aroma. These results may be due to the higher proportions of n-3 PUFA in these animals, triggering odor precursors that are activated by oxidation during heating. However, changes in PUFA concentrations in the present experiment would not likely have been large enough to have affected taste panel assessments.
Beef color remained unaffected by treatments (Table 5). Values encountered in literature for L*, a*, and b* were used to measure beef color in the CIELAB space (Lightness, L*; redness, a*; yellowness, b*; CIE, 1978) being in the following ranges of variation: 33 to 41, 11.1 to 23.6, and 6.1 to 11.3, respectively. Values obtained in the present study were within the range given.
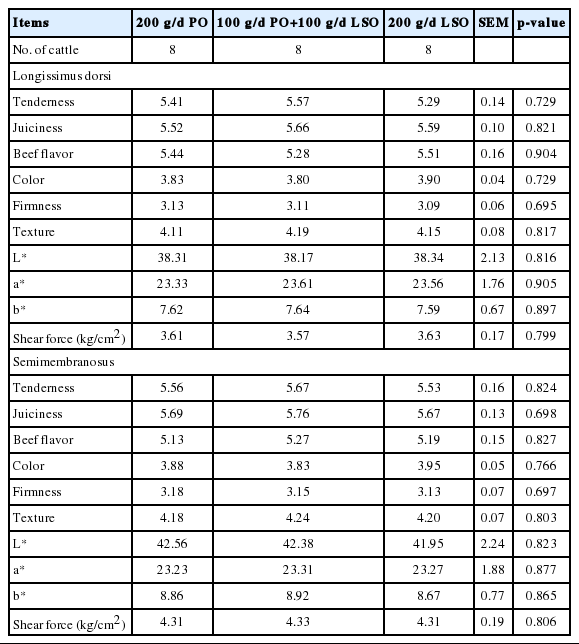
Sensory and physical evaluations of beef from Wagyu crossbred cattle fed palm and/or linseed oil
The shear forces of LD and SM muscle were unaffected (p>0.05) by the addition of LSO in the diets (Table 5). Beef tenderness is a trait considered to be of great relevance for consumers with shear force being an objective measure of tenderness. Bovine meat is considered to have an acceptable tenderness if its shear strength values are below 8 N (Swan et al., 1998). The beef in the report of Santana et al. (2014) was considered tender regardless of the lipid supplementation adopted because the average values obtained were 7.5 N. The present trial found shear force values between 3.57 and 4.33 kg/cm2 which were considered to be tender (Table 5). These values were closely related to the values obtained from sensory perception of tenderness by trained panelists (5.29 to 5.76; Table 5). Such variations in the shear force values may be caused by differences in the thicknesses of the blades utilized in the analysis
Beef fatty acid profile
In the current study, LSO-containing diets resulted in marked alternations in beef FA composition relative to the added PO in the diet and the responses to treatment diets in both LD and SM muscles showed the same trend (Tables 6 and 7). To compare with PO diet, LSO diets significantly decreased C18:1t-11, C18:2n-6 FAs, cis-9, trans-11, and trans-10, cis-12 CLAs, and C20:4n-6 FAs, and increased C18:3n-3 and C22:6n-3 FAs whereas they had no effect on C10:0 – C16:0, C20:5n-3, and C22:5n-3 FAs. The diets containing LSO resulted in greater LD and SM C18:3n-3 FAs, represented respectively 0.86 and 0.87; and 1.59% and 1.56% of the total beef FA when the animals were fed 100 and 200 g/d LSO diets compared to 0.48% and 0.52% in the animals fed the control diets (p<0.01).

Fatty acid composition (g/100 g fat) of Longissimus dorsi muscle from Wagyu crossbred cattle fed palm and/or linseed oil

Fatty acid composition (g/100 g fat) of Semimembranosus muscle from Wagyu crossbred cattle fed palm and/or linseed oil
The concentrations of total beef n-3 PUFA were increased in animals fed diets supplemented with LSO (p<0.01), whereas the contents of total beef n-6 PUFA were reduced when the steers were fed diets supplemented with LSO leading to a decrease (p<0.01) in the ratio of n-6 to n-3 FA in beef fat of steers fed LSO treatments. The concentration of C18:2n-6 ranging from 4.23% to 6.91% in LD and SM muscles were somewhat slightly higher than the 4.78% reported for the subcutaneous adipose tissue of Hanwoo steers fed linseed (Kim et al., 2009), and higher than the 1.43% reported in heifers fed different vegetable oils (Noci et al., 2007). The concentration of C18:2n-6 decreased with increasing LSO, possibly because of its partial conversion to C18:0 in the rumen. The increase in the concentration of n-3 PUFA coincided with the major increase in the concentration of C18:3n-3 in the LSO diets. These increases are in agreement with the results of Kim et al. (2009) who fed cattle with linseed. This can be explained by the higher intake of C18:3n-3 of LSO cattle (58.4 and 114 g/d of the respective PO/LSO and LSO compared to 2.7 g/d of the PO cattle).
The PO was added to the first and second group to balance energy concentration in the rations, however, the FA content of PO might affect FA composition in beef. Choi et al. (2015) demonstrated that the SFA (C16:0 and C18:0) strongly promote adipogenic gene expression in intramuscular preadipocytes whereas, the MUFA (C18:1 cis-9) and the PUFA (C18:2n-6 and C18:3n-3) depress adipogenic gene expression. Supplementing the diets of beef cattle with PO, rich in C16:0 would increase adiposity without increasing C16:0 in beef. Partida et al. (2007) demonstrated an increase in C16:0 in intramuscular fat of bulls after supplementing hydrogenated PO, although the total SFA content remained similar to control bulls. An increase of oleic acid in beef improves beef palatability (Westering and Hedrick, 1979) and increases its healthfulness (Gilmore et al., 2011). When the LSO results are compared with practical LSO-unsupplemented diets, Quinn et al. (2008) observed that C18:2n-6 and C18:3n-3 in LM muscle were increased 2 to 3 fold by adding 4% LSO to the diets of Holstein-Jersey steers whereas C20:4n-6 was reduced. Increased C18:3n-3 and decreased C20:4n-6 in both LM and SM muscles were also found when LSO was added in the present study. However, increased LSO in the diet reduced C18:2n-6 in the current study.
SFA, UFA, MUFA, and PUFA in LD and SM muscles were unaffected by dietary treatments. There was more total n-6 PUFA than total n-3 PUFA, and C18:2n-6 was the most concentrated PUFA across treatment. Feeding 100 and 200 g/d LSO increased total n-3 PUFA (p<0.01) and C18:3n-3 (p<0.01) in LD and SM muscles compared with the control treatment. Overall, feeding 200 g/d LSO led to approximate triple total n-3 PUFA compared with 200 g/d PO in LD and SM muscles. The lack of dietary effects on total PUFA in LD and SM muscles indicates that LSO addition had no effect on rates of lipolysis in the rumen. Feeding 100 and 200 g/d LSO increased C22:6n-3 (DHA) content when compared with the control treatment. The lack of diet effects on C22:5n-3 (DPA) in LD and SM relates to the limited capacity for the last steps in the n-3 PUFA elongation and desaturation pathway (Raes et al., 2004). Therefore, supplementing bovines with UFAs can increase their passage to the small intestine, which allows more absorption and the possibility of changing the fatty acid profile of beef. The percentages of total CLA (cis-9, trans-11 C18:2) in LD and SM were decreased by dietary LSO treatments (p<0.01, Tables 6 and 7), confirming the previous results of Bessa et al. (2007). In addition, Noci et al. (2007) observed that the cis-9, trans-11 CLA content in intramuscular fat was higher in heifers supplemented with SFO as source C18:2n-6 then with LSO. The decreases in CLA may be due to a reduction in delta-9 desaturase activity which would have been reflected in muscle concentrations of MUFA and SFA. This simply was due to dilution of C18:2n-6 by C18:3n-3 in the diet, as C18:2n-6 is the direct precursor of cis-9, trans-11 CLA and hence trans11, C18:1. The aim of the current study was to increase n-3 FAs in beef by supplementing LSO, rich in C18:3n-3 while PO was added to balance energy concentration in the rations. Choi et al. (2015) demonstrated that PO decreased C18:1trans- 11 and cis-9, trans- 11 CLA and increased C18:0, relative to control muscle while soy bean oil (SBO) increased C18:2n-6 and C18:3n-3, relative to control muscle. Increased C18:2n-6 supply to the diet by adding SBO did not change muscle C18:1trans- 11 and cis-9, trans- 11 CLA (Choi et al., 2015). However, the present study found reductions in muscle C18:1trans- 11 and cis-9, trans- 11 CLA when LSO was added. If CLA and n-3 FAs are needed to increase, a blend of C18:3n-3 and C18:2n-6 containing oils is required to supplement to the diets of finishing steers.
Treatments had no effect on total or individual SFA in LD and SM (Tables 6 and 7). The predominant SFA across all diets in LD and SM was C16:0, followed by C18:0 and C14:0. SFA relates to changes in endogenous FA synthesis that may not have been differentially affected by diet (Mapiye et al., 2013). Oliveira et al. (2012) with feeding different oils reported lower percentages (about 45%) of SFA.
CONCLUSION
Feeding a diet supplemented with 200 g/d of oil comprised of PO, PO/LSO, and LSO did not negatively affect any performance or carcass qualities of steers. The overall feed consumption of the steers was unaffected when dietary oil was provided. LSO supplement did also not influence muscle sensory and physical characteristics. LSO increased the percentage of n-3 fatty acids (mainly C18:3n3) in the LD and SM fat and lowered the n-6/n-3 ratio in beef. Thus, it can be concluded that 200 g/d LSO can be safety supplemented to diets of steers to enrich beef with potentially health beneficial FA.
ACKNOWLEDGMENTS
Authors would like to express special thanks to the Moongcharoen Farm, the Center for Scientific and Technological Equipment, Suranaree University of Technology for their great support. Financial support was provided by the Thailand National Research Council.
Notes
CONFLICT OF INTEREST
We certify that there is no conflict of interest with any financial organization regarding the material discussed in the manuscript.