Chemical and Physical Predictors of the Nutritive Value of Wheat in Broiler Diets
Article information
Abstract
The aim of this study was to establish relationships between chemical and physical parameters of wheat with performance and digestibilities of feed components in broiler chickens fed on wheat-based diets. Ninety-four wheat samples were selected for inclusion in four bird trials. Birds were housed in individual wire metabolism cages from 7 to 28 d and offered water and feed ad libitum. Dry matter intake (DMI), liveweight gain (LWG) and gain:feed were measured weekly. A balance collection was carried out from 14 to 21 d for determination of apparent metabolizable energy (AME), ME:gain, dry matter retention, oil and neutral detergent fibre (NDF) digestibility. At 28 d the birds were humanely killed, the contents of the jejunum removed for determination of in vivo viscosity and the contents of the ileum removed for determination of ileal dry matter, starch and protein digestibility. When wheat parameters were correlated with bird performance data, it was found that specific weight was not significantly (p>0.05) related to bird performance. Bird DMI, LWG and gain:feed were best correlated (p<0.05) with the rate of starch digestion, although the coefficients of correlation (r) were still low (0.246 to 0.523). A negative relationship (p<0.01) between AME and total (r = −0.432) and soluble (r = −0.304) non starch polysaccharide (NSP) was observed in this study. Thousand grain weight (TG) was positively correlated with DMI (r = 0.299), LWG (r = 0.343) and gain:feed (r = 0.371). When establishing multiple regression relationships, correlation coefficients greater than 0.8 were achieved for DMI, LWG, gain:feed and ileal crude protein digestibility. However, the economics involved in determining the parameters involved in the regressions make the process impractical.
INTRODUCTION
In Europe, wheat constitutes 60% or more of poultry diets (Austin et al., 1999), supplying 80% of metabolizable energy and 40% of amino acid requirements (McNab, 1991). However, the nutritive value of wheat is variable both in terms of its chemical composition and the availability of energy (Mollah et al., 1983; Rogel et al., 1987). A range of more than 10% in chicken growth rates has been observed when birds are offered different wheat samples (March and Biely, 1973; Rose et al., 1993; Scott et al., 1998; McCracken and Quintin, 2000). Therefore knowledge of the nutritive value of wheat is imperative to the poultry industry. Internationally, specific weight is used as a measure of feed wheat quality, with an agreed arbitrary minimum of 72 kg/hectolitre. However, reports from literature show a lack of relationship between specific weight and nutritive value of wheat for poultry (Wiseman, 2000; Miller et al., 2001; McCracken et al., 2002).
Other chemical and physical parameters of wheat have been suggested as indicators of feed wheat quality. Wiseman and McNab (1995) reported significant positive correlations between apparent metabolizable energy (AME) of wheat and thousand grain weight (TG) and Pirgozliev et al. (2003) found that TG was negatively correlated with feed conversion efficiency. In contrast, other authors (Hughes et al., 1996; Garnsworthy et al., 2000) found that TG was not correlated with AME. In some studies wheat endosperm hardness was positively correlated with broiler chick growth performance (Scott et al., 1998; Rose et al., 2001; Pirgozliev et al., 2003). Wheat endosperm hardness is an important characteristic in the quality of wheat for bread making (Ohm et al., 1998). Hardness of the endosperm affects the milling performance of wheat. Hard wheats shatter when milled and the flour is fine, with regular particle sizes and large surface areas and they yield angular endosperm particles in which starch granules are often mechanically damaged. Soft wheats tend to result in flour with irregular particle sizes, lower surface areas and with relatively little starch granule damage. It has been suggested that these starch damage characteristics may be important in improving the growth performance of broiler chickens fed wheat-based diets (Pirgozliev et al., 2003). However, other studies found that hardness showed no correlation with nutritive value (Garnsworthy et al., 2000).
The nutritive value of any feedstuff is influenced by its chemical composition and the degree to which the bird is able to digest, absorb and utilize these components (Wiseman and Inborr, 1990). Pirgozliev et al. (2003) showed, by step-wise multiple regression, that the amount of total starch, crude protein and ether extract were the nutrient composition variables significantly related to AME of the diets. Starch is the main source (>50%) of energy in most poultry diets, so variations in starch content and digestibility may strongly affect the energy value of poultry diets (Carré, 2004). McCracken and Quintin (2000) found a strong relationship (p<0.01) between the AME and the starch content of wheat. Rogel et al. (1987) and Wiseman et al. (2000) have both reported that the AME content of wheat is affected by starch digestibility and studies by Weurding (2002) have shown that rapid starch digestion has a negative effect on feed conversion efficiency. Slowly digestible starch is said to improve the efficiency of digestion of protein and amino acids. The rate of starch digestion may also affect the composition of the microflora. Birds fed slowly degradable starch showed a different profile of microflora, less Clostridium Perfringens (which is associated with necrotic enteritis) and a trend towards more favourable Lactobacilli bacteria, when compared with birds fed faster digested starch (www.aviagen.com). There is evidence that the endosperm structure of cereals may also affect their nutritive quality. It is generally believed that starch granules, with high amylose content (>40%), tend to be more resistant to enzyme hydrolysis than those with low amylose content. High amylose starch granules (about 70% amylose) from mutant plant genotypes display different crystalline structure, high resistance and low in vivo digestibility (Carré, 2004). Very low amylose (<1%) starch granules were also tested in chickens, and despite the fact that the low amylose starch seems more susceptible to enzyme hydrolysis than normal starch (Rooney and Pflugfelder, 1986), there was no clear advantage to low amylose wheat instead of normal wheat cultivars (Weurding et al., 2001; Pirgozliev et al., 2002).
In relation to defining quality, research has also indicated that the content of non-starch polysaccharides (NSP) is responsible for the low AME of some wheats (Annison, 1990; Classen et al., 1995; Choct et al., 1999). Reportedly, the anti-nutritional effects of NSP in broiler chickens are caused by soluble NSP (mainly arabinoxylan and some β-glucan) present in wheat cell walls. Evidence for the anti-nutritive effect of soluble NSP includes the negative relationship with AME, the fact that various sources of purified NSP depress AME, and that in situ degradation of cell wall NSP by glycanases increases AME (Hughes and Choct, 1999). In Canada, Classen et al. (1995) found a negative relationship between AME and different soluble NSP parameters. The anti-nutritive effect of soluble NSP on AME is manifested through inhibition of digestion of starch, lipid and protein in the small intestine (Choct and Annison, 1992). The mechanism of action of soluble NSP is thought to involve increased viscosity of digesta which limits contact between digestive enzymes and substrates, and contact between nutrients and absorption sites on the intestinal mucosa (Bedford and Morgan, 1996; Smits et al., 1997). Hence, previous studies (Classen and Scott, 1995; Wiseman and McNab, 1995; Dusel et al., 1997) have suggested that in vitro viscosity may also be a suitable basis for rapid estimation of energy value. It has been demonstrated that a significant negative relationship exists between intestinal viscosity and weight gain and feed conversion efficiency in chickens fed rye- and wheat-based diets (Bedford et al., 1991; Bedford and Classen, 1992). However, McCracken et al. (2001) found there were poor relationships between either gain:feed or wheat AME and in vitro or in vivo viscosity. Studies by George (2000) suggested that a considerable component of viscosity of wheat samples was associated with the protein fraction and Chesson et al. (2002) has highlighted the importance of amino acid digestibility of cereals as a component of nutritive value. Although the protein content of cereals is relatively low, the large amounts of cereals in poultry diets means they commonly supply over half of the total dietary protein and any improvements in the digestibility of protein has an important effect on the utilization of the whole diet. Therefore, the protein component of the wheat should also be examined when defining nutritive value.
Considering the range of different parameters suggested and the difference in findings, clarification on the chemical and/or physical factors related to wheat nutritive value is critical. The aims of this project were to identify chemical and physical parameters which consistently relate to the nutritive value of wheats in diets for poultry and to establish regression relationships between bird performance parameters and wheat chemical and physical parameters.
MATERIALS AND METHODS
Animal ethics
This study was conducted according to the Animals (Scientific Procedures) Act 1986 and was approved by the Newforge Ethical Committee.
Sample collection
The 94 wheat samples used in this study were gathered over a wide range of different locations, varieties and years. Thirty-two of the wheat samples were taken from Miller et al. (2001) and consisted of eight 1999 Northern Ireland varieties (Aardvark, Charger, Hereward, Reaper, Equinox, Napier, Rialto, Savannah and Consort) from two sites (Downpatrick and Limavady) and 16 GB wheats, of four different varieties (Buster, Consort, Riband and Haven) at four levels of specific weight (Broiler trial 1). In addition to these, ten samples: Claire, Consort, Malacca, Tanker, Napier, Savannah, Aarvark, Rialto, Riband and Soissons; were collected from each of the 2003 and 2004 harvests at Crossnacreevy, Northern Ireland (Broiler trial 2). Another 32 samples were collected from the 2005 harvest at Crossnacreevy (n = 10) and from HGCA Project No. 2979 entitled “GREEN Grain” being undertaken by ADAS (n = 18) and also from shipments from GB containing commercial wheat samples for Moy Park Limited (Dungannon, Northern Ireland) (n = 4) (Broiler trial 3). A further ten samples were selected from 2005 Crossnacreevy grain (n = 6) and from the ADAS grain (n = 4) for use in a fourth broiler trial (Broiler trial 4).
Diets
Wheats were selected to give as wide a range of bird performance results as possible. Wheat was ground in a hammer-mill using a 5 mm screen. The diet formulation (Table 1) was a typical UK starter/grower with a small inclusion of lysine, threonine and methionine to equalize these across all diets based on amino acid analysis of the wheat samples. Titanium dioxide was added as an indigestible marker. The diets were mixed, then heat treated (80°C, 90 s) and pelleted (3 mm die) at the Agri-Food and Biosciences Institute, Belfast.
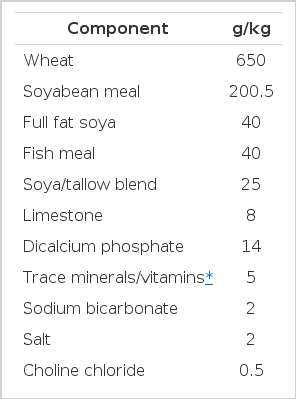
Composition of diets
Experimental design
The first broiler trial was conducted as part of the study by Miller et al. (2001), which investigated the 16 1999 Northern Ireland varieties and 16 GB wheats. Sixty-four birds were used in each of five replicates (ten birds/treatment), with two weight blocks of 32 in each replicate. All 32 treatments were randomly allocated within a weight block of 32 birds. The second broiler trial investigated 20 wheat samples, ten from each of the 2003 and 2004 Crossnacreevy harvest. Sixty birds were used in each of three replicates (nine birds/treatment), with three weight blocks of 20 in each replicate. All 20 treatments were randomly allocated within a weight block of 20 birds. The third broiler trial investigated 32 wheat samples selected from the 2005 Crossnacreevy harvest, HGCA Project 2979 and GB commercial samples. Sixty-four birds were used in each of five replicates (ten birds/treatment), with two weight blocks of 32 in each replicate. All 32 treatments were randomly allocated within a weight block of 32 birds. The fourth trial investigated ten wheat samples selected from the 2005 Crossnacreevy harvest and HGCA Project No. 2979. Sixty birds were used in each of two replicates (12 birds/treatment), with six weight blocks of ten in each replicate. All ten treatments were randomly allocated within a weight block of ten birds.
Birds and management
For each replicate, 100 male Ross broiler chicks from 30 to 40 wk old breeders and one breeder farm were obtained at hatching from Moy Park Ltd. (Dungannon, Northern Ireland). They were placed in a commercial brooder for seven days with ad libitum access to water and a crumbled starter diet (Hi-Grain Chick Crumbs, John Thompson and Sons, Belfast, UK). This contained cereal grains, oilseed products and by-products, cereal grain products and by-products, minerals, oils and fats. Proximate analysis (g/kg) of the commercial starter diet (as given by the supplier) gave oil 35, protein 195, fibre 40, ash 60 and methionine 4. At seven days, all birds were weighed and the heaviest and lightest discarded, leaving a sufficient amount so the birds can be allocated to experiment according to the randomization. Birds were placed in individual wire metabolizm cages (31×22.5×30 cm3) at an initial room temperature of 33°C, reduced by 1°C every two days down to 24°C. The light:dark cycle was 18:6 and relative humidity was set for 50%. Birds were offered water and feed ad libitum from 7 to 28 d, with DMI, LWG and gain:feed being recorded on a weekly basis.
The balance procedure for determination of AME was carried out from d 14 to d 21. The individual bird excreta was collected daily and stored at 4°C. At the end of the balance week the excreta was weighed and then oven dried at 80°C. The sample weights were allowed to equilibrate and were then milled through a hammer mill fitted with a 0.75 mm screen and stored for subsequent analysis. At 28 d, birds were humanely killed by dislocation of the spinal cord and the contents of the proximal jejunal removed for determination of in vivo viscosity and the contents of the ileum collected to determine ileal digestibility.
Analysis of wheat samples, diets, excreta and ileal digesta
The wheat samples were analyzed for DM, specific weight, TG, in vitro viscosity, gross energy (GE), nitrogen (N), neutral detergent fibre (NDF), starch, total and soluble NSP, lysine, threonine, amylose, hardness, rate of starch digestion and protein profiles. The diets were analyzed for titanium dioxide, DM, crude protein (N×6.25), oil, NDF, ash, starch and GE. The excreta samples were analyzed for DM, GE, oil and NDF content. The ileal digesta were analyzed for DM, titanium dioxide, crude protein (N×6.25) and starch. All analyses were carried out in duplicate and results reported on a DM basis.
DM was determined by oven drying at 100°C for 24 h and ash content was determined by ashing samples in a muffle furnace at 450°C for 16 h (AOAC, 1990). Specific weight was measured using a Digi-sampler hectolitre test weight machine (ELE International Limited), and TG by using a Numigral seed counter (Tecator Ltd, Sweden) and measuring the weight of one thousand grains in duplicate. In vitro viscosity was determined using a modification of the method described by Bedford and Classen (1993). The digesta was centrifuged (13,400 g for 8 min) and viscosity measured using a Brookfield LVDV II cone and plate viscometer at 20°C. Nitrogen was determined using the LECO FP-2000 dry combustion analyzer (Leco Corporation, Michigan, USA) and oil B by acid hydrolysis (3 M-HCl), followed by solvent extraction with petroleum ether (40 to 60°C) in a Soxtec system (Stoldt, 1952). NDF was determined using the Fibertec system (Tecator Ltd, UK) according to the method of Van Soest (1963) and total starch was determined using a commercial enzyme assay kit (Megazyme International Ireland Ltd) as described by McCleary et al. (1997). Total and soluble NSP content were determined using a commercial enzyme assay kit as described by Englyst et al. (1994). Amino acid content was determined, following acid hydrolysis (6 N HCl), on a Biochrom 20 amino acid analyzer, using the synthetic amino acid Norleucine as an internal standard. GE was determined using an isothermal automated bomb calorimeter (PARR, Model 1271). Amylose content was determined using a commercial assay kit (Megazyme International Ireland Limited) which is a modification of the procedure as described by Yun and Matheson (1990). The hardness of the wheat samples was firstly measured using NIRS to predict a single kernel characterization system (SKCS) (Harper Adams University) and then repeated at AFBI, Hillsborough using a more recent version of the equation obtained from Campden Chorleywood Food Research Association (CCFRA, Gloucestershire). Rate of starch digestion was determined by the Englyst method (Englyst et al., 1996). In vitro starch digestion follows first-order kinetics, and in vitro starch digestion rate was estimated using the following equation: DCt = D (1−e−k(d)·t), where DCt is the starch fraction at time t and fraction D is the potentially digestible starch fraction that will digest at a fractional rate of kd (h−1). This terminology was the same as used by Weurding et al. (2001). The percentage starch at each time period was expressed as a fraction of the final starch value obtained from the above rate equation. Profiling of the protein fractions was measured by electrophoretic and densitometric analysis and this was carried out by CCFRA, Gloucestershire. The detected bands were grouped into five major bands: band 1: HMW-glutenin subunits, band 2: larger LMW-glutenin and ω-gliadin subunits, band 3: smaller LMW-glutenin and ω-gliadin subunits, band 4: α-, β-, γ-gliadin subunits and band 5: albumins and globulins. Titanium dioxide content was measured according to the procedure by Leone (1973) and modified by Peddie et al. (1982).
Statistical analysis
The results of the trials were subjected to analysis of variance using Genstat Release 9.2, with initial weight as a co-variate for growth parameters. Regression relationships between all bird performance parameters and all wheat chemical and physical parameters were established and a number of multiple regressions examined using stepwise regressions. For the stepwise regressions, forwards selection was used with additional explanatory variates added until no significant improvement in fit was obtained.
RESULTS
Table 2 shows the range and standard deviation of chemical and physical parameters of wheat. The range in broiler performance and the nutrient utilization of the wheats when formulated into diets is given in Table 3.
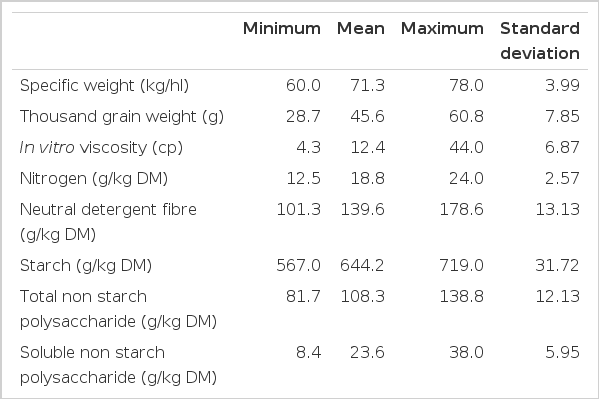
The range and standard deviation of chemical and physical parameter of wheat
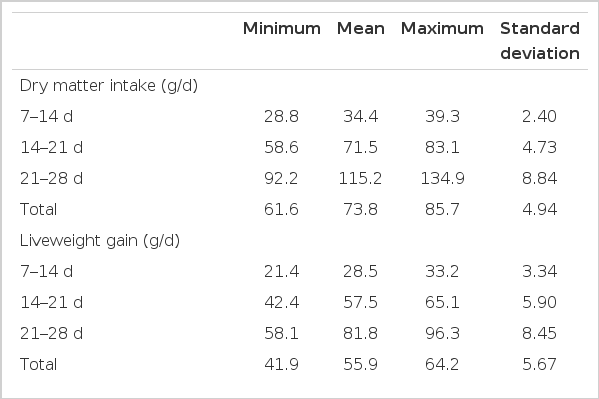
The range and standard deviation in broiler performance and nutrient utilisation
Regression analysis
All results from the single regression analysis are shown in Table 4(a), (b) and Table 5. Total DMI, LWG and gain:feed were positively correlated with TG, in vitro viscosity, total NSP (DMI and LWG only), soluble NSP (DMI only), threonine, hardness, RSD rate constant and protein band 4 (α-, β-, γ-gliadin subunits), and negatively correlated with lysine, protein band 1 (HMW-glutenin subunits) and 2 (larger LMW-glutenin and ω-gliadin subunits). In vivo viscosity was positively correlated with in vitro viscosity, NDF, hardness, protein band 2 and protein band 5 (albumins and globulins) and negatively correlated with starch, amylose and protein bands 3 (smaller LMW-glutenin and ω-gliadin subunits) and 4. ME:GE, AME content and ME:gain were positively correlated with NDF (AME and ME:GE only), protein band 2 and protein band 5 (ME:GE and AME only) and negatively correlated with in vitro viscosity, CP, starch (ME:GE and AME only), total NSP, soluble NSP, threonine, GE, RSD rate constant hardness (ME:gain only) and protein band 4. DM retention was positively correlated with starch and threonine and negatively correlated with in vitro viscosity, CP, total NSP, lysine, GE and protein band 2 (Table 4). Ileal dry matter digestibility was positively correlated with TG and was negatively correlated with CP, total NSP, threonine and protein bands 1, 2, 4 and 5. Ileal starch digestibility was positively correlated with starch, amylose and protein band 3 and negatively correlated with TG in vitro viscosity, NDF, CP, total NSP, soluble NSP, threonine, GE, hardness, RSD rate constant and protein band 4. Ileal CP digestibility tended to show opposite correlations to those of ileal starch digestibility, with ileal CP being positively correlated with TG, in vitro viscosity, CP, NDF, total NSP, GE, hardness, RSD rate constant and protein band 4 and negatively correlated with starch, amylose and protein bands 1 and 3. A number of significant correlations were observed between wheat chemical and physical parameters (Table 5). Specific weight was positively correlated with hardness and protein bands 1 to 3 but negatively correlated with CP, total NSP, soluble NSP, threonine and protein band 4. Thousand grain weight was positively correlated with in vitro viscosity, amylose, RSD rate constant and protein band 4 and negatively correlated with lysine and protein bands 1 to 3. In vitro viscosity was positively correlated with CP, total NSP, soluble NSP, threonine, GE, hardness, RSD rate constant and protein band 3 and was negatively correlated with starch, amylose and protein bands 1 and 3. CP was positively correlated with total NSP, soluble NSP, lysine, threonine, GE, hardness, RSD rate constant and protein bands 1 and 4 and was negatively correlated with starch, amylose and protein band 5. NDF was positively correlated with total NSP, lysine, GE, hardness and protein band 2 and was negatively correlated with starch, amylose and protein band 3. Starch was positively correlated with amylose and was negatively correlated with lysine, GE, hardness and protein band 2. Total NSP was positively correlated with soluble NSP, threonine, GE, hardness, RSD rate constant and protein band 4 and negatively correlated with amylose and protein bands 1 and 3. Soluble NSP was positively correlated with threonine, GE, hardness, RSD rate constant and protein bands 4 and 5 and negatively correlated with amylose and protein bands 1 to 3. Lysine was positively correlated with protein bands 1 and 2 and negatively correlated with threonine and amylose. Threonine was positively correlated with GE, hardness, RSD rate constant and protein band 4 and negatively correlated with protein bands 2 and 3. GE was positively correlated with hardness, RSD rate constant and protein bands 1 and 4 and negatively correlated with amylose. Amylose was positively correlated with protein bands 1 and 3 and negatively correlated with hardness, RSD rate constant and protein band 2. Hardness was positively correlated with RSD rate constant and protein band 4 and negatively correlated with protein band 3. RSD rate constant was positively correlated with protein band 4 and negatively correlated with protein bands 2, 3 and 5. Protein band 1 was positively correlated with protein bands 1 and 2 and negatively correlated with protein band 5. Protein band 2 was negatively correlated with protein band 4. Protein band 3 was negatively correlated with protein band 4 and 5 and protein band 4 was negatively correlated with protein band 5.
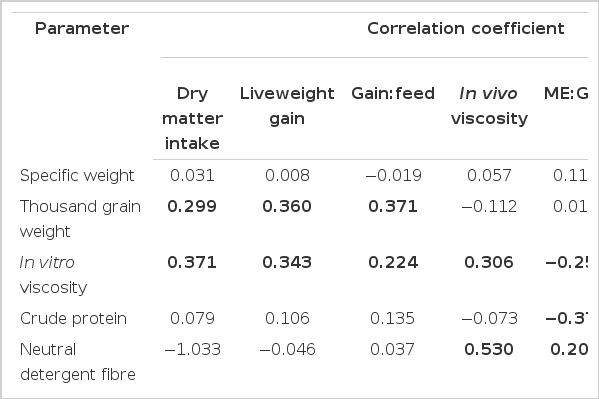
Relationships between bird parameters and chemical and physical parameters of wheat

Relationships between bird digestibility parameters and chemical and physical parameters of wheat

Correlation between chemical and physical parameters of wheat
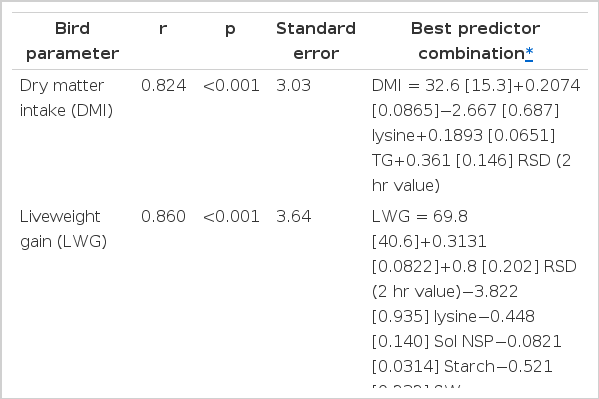
The results from the stepwise multi-regression analysis are shown in Table 6. The best prediction combinations were for total DMI (r = 0.824, p<0.001) from in vitro viscosity, lysine, TG and RSD (2 h); total LWG (r = 0.860, p<0.001) from TG, RSD (2 h) lysine, soluble NSP, starch and SW; total gain:feed (r = 0.863, p<0.001) from TG, RSD (2 h), soluble NSP, protein band 1, CP and NDF and ileal starch digestibility (r = 0.829, p<0.001) from TG, soluble NSP, amylose, RSD (0.125 and 1 h) and starch.
Multi-regression analysis
DISCUSSION
Characteristics of wheat samples
The wheat samples used in this study were sourced over different locations, years and growing conditions to create a wheat sample database with wide ranging chemical and physical parameters. This aim was successful in that the ranges for each of the measured parameters were greater than most quoted in literature, but still within typical limits expected for wheat (Garnsworthy et al., 2000; McCracken and Quintin, 2000; McCracken et al., 2001; Rose et al., 2001; Steenfeldt, 2001; Carré et al., 2002; Pirgozliev et al., 2003; Wilkinson et al., 2003; Rafuse et al., 2005; Samli et al., 2006).
Correlations
One of the primary objectives of this study was to determine the relationship (if any) between wheat chemical and physical parameters and performance variables. The comparison of the results of this study with other results from literature (Garnsworthy et al., 2000; McCracken and Quintin, 2000; McCracken et al., 2001; Rose et al., 2001; Steenfeldt, 2001; Carré et al., 2002; Pirgozliev et al., 2003; Wilkinson et al., 2003; Rafuse et al., 2005) proved difficult as no other study measured the wide range of parameters assessed in this study and of those that had measured the same parameters, the results varied. Therefore, because of the variance of results from the literature and the relatively poor correlations obtained in this study (maximum correlation coefficient (r) of 0.594), it is difficult to clearly define which of the wheat properties are most useful, if any, in indicating bird responses. However, specific weight was not significantly (p>0.05) related to any of the bird parameters measured in this study. This agrees with other reports (McCracken et al., 2001; Rose et al., 2001; Pirgozliev et al., 2003), which also show a lack of correlation between wheat specific weight and bird performance parameters. This further enhances the argument that specific weight is of no benefit when predicting feed wheat nutritive value for broilers and use of the industry standard of 72 kg/hl cannot be justified.
Thousand grain weight was positively correlated with DMI (r = 0.299), liveweight gain (r = 0.343) and gain:feed (r = 0.371), which agrees with the findings of previous work (Pirgozliev et al., 2003). However, TG was not related to AME (p>0.05) and this again is in keeping with previous work from our laboratory (Magee, 1994; McCracken et al., 2001).
In this study, numerous wheat chemical and physical parameters were significantly (p<0.05) related to bird performance. DMI and LWG were best correlated with RSD (r = 0.523 and 0.50 respectively) at 0.375 h, and all RSD parameters were positively related (p<0.05) to DMI, LWG and gain:feed. In the current study, the relationships with RSD, although significant, were relatively weak (r <0.523) and significances may be attributed to the large dataset. However, it would appear that the rate of starch digestion plays an important role in bird performance. This agrees with Waldron et al. (1995) who also found increases in hydrolysis of starch were related to increases in weight gain and concluded that the lower rates of starch hydrolysis that occur in some wheat varieties may be a factor implicated in poorer performance in broiler chickens. However, this is in direct contrast to the theory that rapid starch digestion has a negative effect on feed conversion efficiency (Weurding, 2002).
This study found that there was no significant (p>0.05) relationship between soluble NSP and in vitro viscosity and indeed positive relationships between in vitro viscosity and DMI, LWG, gain:feed and in vivo viscosity were observed. However, it must be emphasized that, although the relationships in this study were statistically significant (p<0.05), the correlation coefficients were very poor (r = 0.37, 0.34, 0.22 and 0.31 respectively). McCracken et al. (2001) also found poor relationships between feed conversion efficiency and in vitro or in vivo viscosity (correlation coefficients of 0.06 and 0.32 respectively). These results add further ambiguity to the relationship between viscosity and bird performance, as it has been reported that an increase in the viscosity of the digesta, brought about by increased soluble NSP, leads to a decrease in liveweight gain and feed conversion efficiency (Bedford et al., 1991; Bedford and Classen, 1992, Dusel et al., 1997). The difference in findings may be attributed to the relatively low in vivo viscosity values of the wheat samples used in this study and that of McCracken et al. (2001). However, the low in vivo viscosity values are more typical of those from a commercial broiler diet. Although a significant negative relationship between intestinal viscosity and weight gain and feed conversion efficiency was not demonstrated in this study, a negative relationship was found between AME and total and soluble NSP (correlation coefficients of −0.43 and −0.30 respectively). This may add to the findings of several studies that demonstrated that the content of non-starch polysaccharides may be responsible for the low AME of some wheats (Annison, 1993; Classen et al., 1995; Choct et al., 1999). Choct and Annison (1992) and Steenfeldt (2001) both reported that the arabinoxylan content of wheat and wheat-based diets becomes detrimental to chickens when the concentration reaches a certain level. Choct and Annison (1992) reported highly significant negative correlations between the total pentosan content of the diet and the ileal digestibility coefficients of starch, protein and lipid and Steenfeldt (2001) reported a negative correlation between the dietary arabinoxylan content and the apparent fat digestibility coefficients measured from excreta. In this study, total NSP was significantly (p<0.01) negatively correlated with ileal starch digestibility (−0.405), but positively correlated with ileal protein digestibility (0.361), DMI (0.395) and LWG (0.312). Perhaps the level of NSP was not sufficiently high to become detrimental to the performance of the birds, although Choct and Annison (1992) stated that cereal NSP exhibit anti-nutritive activity at levels as low as <50 g/kg in broiler diets, which is much lower than those found in this study.
Attempts to establish multiple regression relationships were more successful than single regressions. Correlation coefficient values greater than 0.8 were achieved for DMI, LWG, total gain:feed and ileal crude protein digestibility (Table 6). However, the number of parameters and the cost and complexity involved in determining the parameters in the best predictor combinations would be too great to make the process economically worthwhile in a commercial setting. For example, the best correlation coefficient was 0.863 for gain:feed, which involved the determination of N, TG, RSD, soluble NSP, protein band 1, NDF and dry matter (as all results reported on a dry matter basis) in duplicate. This equates to an approximate cost of £350 and involves over 15 h of labour.
Acknowledgements
The authors gratefully acknowledge the cooperation of Dr Ethel White (Plant Testing Station, AFBI), Prof. Roger Sylvester-Bradley (ADAS), Mr John Sloss (Moy Park) and Dr Tom Scott (Agri-Food Research Centre) in obtaining the wheat samples. Dr David Kilpatrick and Mrs Sally Dawson (Biometrics Division, AFBI) who provided advice and help with the statistical analysis. The work was funded by the Department of Agriculture and Rural Development (Northern Ireland) and the Home Grown Cereals Authority.