Validation of Prediction Equations to Estimate the Energy Values of Feedstuffs for Broilers: Performance and Carcass Yield
Article information
Abstract
The objective was to evaluate the use of prediction equations based on the chemical composition of feedstuffs to estimate the values of apparent metabolisable energy corrected for nitrogen balance (AMEn) of corn and soybean meal for broilers. For performance and carcass characteristics, 1,200 one-d-old birds (male and female) were allotted to a completely randomised factorial 2×8 (two genders and eight experimental diets) with three replicates of each sex with 25 birds. In the metabolism trial, 240 eight-d-old birds were distributed in the same design, but with a split plot in time (age of evaluation) with five, four and three birds per plot, respectively, in stages 8 to 21, 22 to 35, and 36 to 42 d of age. The treatments consisted of the use of six equations systems to predict the AMEn content of feedstuffs, tables of food composition and AMEn values obtained by in vivo assay, totalling eight treatments. Means were compared by Scott-Knott test at 5% probability and a confidence interval of 95% was used to check the fit of the energy values of the diets to the requirements of the birds. As a result of this study, the use of prediction equations resulted in better adjustment to the broiler requirements, resulting in better performance and carcass characteristics compared to the use of tables, however, the use of energy values of feedstuffs obtained by in vivo assay is still the most effective. The best equations were: AMEn = 4,021.8–227.55 Ash (for corn) combined with AMEn = −822.33+69.54 CP-45.26 ADF+90.81 EE (for soybean meal); AMEn = 36.21 CP+85.44 EE+37.26 NFE (nitrogen-free extract) (for corn) combined with AMEn = 37.5 CP+46.39 EE+14.9 NFE (for soybean); and AMEn = 4,164.187+51.006 EE-197.663 Ash-35.689 CF-20.593 NDF (for corn and soybean meal).
INTRODUCTION
The poultry industry worldwide has seen significant developments in recent decades, following the increase in consumption of chicken by the population. In this scenario, the improvement in nutrition, genetics, health and management have allowed the continued development of this activity. However, to adequately meet the nutritional requirements, it is necessary to use diets that maximize the utilisation of nutrients.
Currently, the main ingredients used in diets for broilers are corn, which contributes ∼65% of metabolisable energy, and soybean meal as the main protein source, contributing energy to a lesser extent. However, for efficient formulation of poultry, it is necessary to precisely know the energy content of the feedstuffs, because the dietary energy balance can influence the nutrient intake and thus affect the performance and carcass characteristics of broilers.
The apparent metabolisable energy corrected for nitrogen balance (AMEn) is often used in the elaboration of poultry diets. However, there is a wide variation in chemical and energy composition of feedstuffs, making it difficult to estimate the correct AMEn values. In practice, some problems are found in the determination of AMEn values, such as the time required for the metabolic assay and different methodologies available. Therefore, nutritionists have used chemical and energy composition tables of the feedstuffs used in animal nutrition. However, this practice has limitations, since the values are derived from ingredients obtained under various conditions, which can often lead to the development of unbalanced diets of broilers. The possibility of using equations to predict the AMEn values of feedstuffs has been an objective of researchers (Nascimento et al., 2011ab; Rochell et al., 2011). The importance of the prediction equations for estimating the AMEn values of feedstuffs is the facility to get simple chemical analysis of the feedstuffs, eliminating the need for biological testing (in vivo determination), which are expensive and often lengthy. However, for these equations to be effective, validation studies using animal tests are needed (Alvarenga et al., 2011).
The objective of this study was to evaluate the use of prediction equations to estimate the AMEn values of corn and soybean meal used in diets for broilers at different ages and compare them to the use of energy composition tables or in vivo assays to obtain the energy values of these feedstuffs.
MATERIALS AND METHODS
The experiment was conducted at the Avian Centre, Department of Animal Science, Federal University of Lavras, Minas Gerais, Brazil. The experimental protocol was approved by the Bioethics Committee of the Federal University of Lavras.
Experimental design, animals, housing, and diets
Two experiments were conducted: performance and metabolism. For performance, 1,200 Cobb 500 broiler chicks (males and females), weighing 46.5±0.4 g, were housed in a brick shed with a floor covered with wood shavings and fed diets formulated for the different phases (1 to 7, 8 to 21, 22 to 35, and 36 to 42 d of age). A completely randomised design in the factorial scheme 2×8 (2 genders and 8 experimental diets) with three replicates of each sex with 25 birds (experimental unit) was used. All boxes were equipped with feeders and drinkers, whose height was adjusted according to the age of birds.
Simultaneously, a metabolism trial was conducted, divided into different phases (8 to 21, 22 to 35, and 36 to 42 d old) to determine the values of metabolisable energy and coefficient of metabolisability of nutrients of the diets. Two hundred and forty eight-d-old birds were distributed in the same experimental design of the performance trial, but with a split plot in time (phase of evaluation) with five birds per experimental unit in the 8 to 21 d period, four in the period from 22 to 35 d and three during 36 to 42 d. In each group diets were based on requirements suggested by Rostagno et al. (2005).
The experimental diets consisted of specific diets for each growth period (1 to 7, 8 to 21, 22 to 35 and 36 to 42 d old; Tables 1, 2, 3 and 4, respectively), made with AMEn values of corn and soybean meal estimated by prediction equations (six equations obtained from the literature) based on the chemical composition of the feedstuffs: crude protein (CP), ether extract (EE), nitrogen free extract (NFE), neutral detergent fibre (NDF), acid detergent fibre (ADF) and crude fiber (CF); obtained from the energy and chemistry composition of food tables (Rostagno et al., 2005) or obtained from in vivo assays. The treatments were defined as:
R1: diet formulated using AMEn values (kcal/kg as-fed) of corn and soybean meal described in Tables (Rostagno et al., 2005), being 3,381 and 2,256 kcal/kg, respectively;
R2: AMEn values (kcal/kg as-fed) obtained by in vivo assay, in metabolic cages, being 3,261 and 2,108 kcal/kg;
R3: AMEn (kcal/kg in DM) estimated by equation prediction showed by Janssen (1989), specific for corn and soybean meal: AMEn (corn) = 36.21CP+85.44EE+ 37.26NFE, being 3,834 kcal/kg in DM or 3,336 kcal/kg as-fed; AMEn (soybean meal) = 37.5CP+46.39EE+14.9NFE, being 2,548 kcal/kg in DM or 2,264 kcal/kg as-fed.
R4: AMEn (kcal/kg in DM) estimated by general equation for protein and energy feedstuffs) described by Nascimento et al. (2009) and indicated by Alvarenga et al. (2011) as more applicable: AMEn = 4,101.33+56.28EE-232.97Ash-24.86NDF+10.42ADF, being 3,902 kcal/kg in DM or 3,395 kcal/kg as-fed (for corn) and 2,605 kcal/kg in DM or 2,315 kcal/kg as-fed (for soybean meal)
R5: AMEn values (kcal/kg in DM) estimated by general equation for protein and energy feedstuffs described by Mariano et al. (2012): AMEn = 4,164.187+51.006EE-197.663Ash-35.689CF-20.593NDF, being 3,890 kcal/kg in DM or 3,385 kcal/kg as-fed (for corn) and 2,568 kcal/kg in DM or 2,281 kcal/kg as-fed (for soybean meal).
R6: AMEn values (kcal/kg in DM) estimated by specific equations proposed by Nascimento et al. (2011 a and b) and indicated by Alvarenga et al. (2011) due to low standard-error of estimative in predict the AMEn values of feedstuffs for broilers: AMEn (energy feedstuffs) = 4,205.23+30.58EE-130.35Ash-58.29CF-28.31NDF+16.71ADF, being 3,795 kcal/kg in DM or 3,302 kcal/kg as-fed for corn; AMEn (protein feedstuffs) = 2,707.71+58.63EE-16.06NDF, being 2,668 kcal/kg in DM or 2,370 kcal/kg as-fed for soybean meal.
R7: AMEn values (kcal/kg in DM) estimated by specific equations for corn and by-products described by Rodrigues (2000) and soybean meal and by-products described by Rodrigues et al. (2002): AMEn (corn) = 4,021.8–227.55Ash, being 3,799 kcal/kg in DM or 3,306 kcal/kg as fed; AMEn (soybean meal) = −822.33+69.54CP-45.26ADF+90.81EE, being 2,491 kcal/kg in DM or 2,213 kcal/kg as-fed.
R8: AMEn values (kcal/kg as fed) obtained by the general equation described by Rostagno et al. (2005): AMEn = 4.31 CPdigestible+9.29 EEdigestible+4.14 ENNdigestible, being 3,415 kcal/kg for corn and 2,295 kcal/kg for soybean meal.
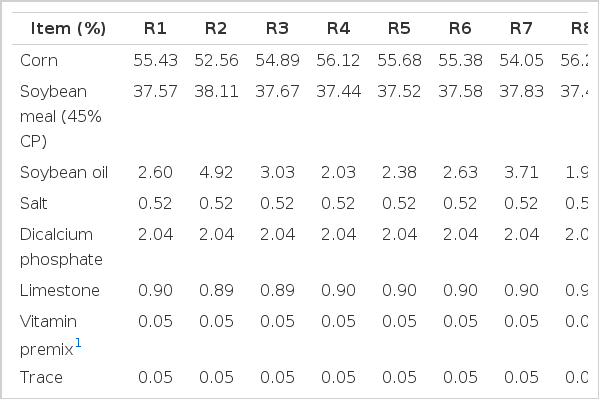
Composition of experimental diets to broilers from 1 to 7 d of age


Experimental procedure
In the performance trial, birds were weighed at the beginning and end of each growing phase to determine the weight gain. The diets and orts were also weighed to determine the feed intake. The feed:gain was calculated in each evaluated period. At the end of the experiment, two birds with average weight of the experimental unit were slaughtered for carcass evaluation. Prior to sacrifice, the birds were fasted for 12 h and weighed immediately. After slaughter, the animals were plucked and eviscerated and carcasses without heads and feet were weighed. For the determination of carcass yield, the weight of the clean eviscerated carcass and body weight obtained prior to slaughter was considered. The fat in the abdominal region, near the bursa of Fabricius and the cloaca was separated and weighed. The income of breast, wings, thighs, drumsticks and abdominal fat was calculated considering the weight of the eviscerated carcass (Mendes et al., 2004).
In the metabolism trial, the technique of total collection of excreta (Sibbald and Slinger, 1963) was used. The collections were performed in the last 3d of each evaluated growing phase (d 19, 20 and 21; 33, 34, and 35; and 40, 41, and 42, respectively). The excreta were stored in a freezer (−5°C) until the end of the collection period, when they were thawed, weighed and homogenised. Next, representative samples were removed and subjected to pre-drying in a forced air oven (65°C) to constant weight. After drying, the faeces were ground (using a knife mill with a sieve of 1.0 mm) and stored at 4°C until the chemical analyses.
Chemical analysis
The DM was determined using an oven (method 943.01), crude protein (CP) by the Kjeldahl method (method 954.01) and ether extract (EE) without acid hydrolysis (method 920.39), according to AOAC (1995). The gross energy (GE) was determined by calorimetric bomb (model 1261, Parr Instrument Company, Moline, IL, USA). All analyses were conducted in duplicate.
Calculation of variables
The energy values of diets were calculated using the equations proposed by Matterson et al. (1965) and adjusted for the nitrogen retention. The calculations of the apparent metabolisability coefficient (AMC) of dry matter (AMCDM), crude protein (AMCCP) and ether extract (AMCEE), following equations was used:
The AMEn, AMCDM, AMCCP and AMCEE of experimental diets were evaluated in each growing period.
Statistical analyses
The AMEn values of experimental diets were compared to the broiler requirements using a confidence interval of 95%. The data of performance, carcass and coefficient of metabolisability of nutrients were subjected to analysis of variance using the statistical program Sisvar version 5.3 (Ferreira et al., 2011). The following model was used: Yij = μ+Gi+Dj+GDij+eij where Y is the dependent variable, μ is the mean, G is the gender, D is the diets, GD, is the interaction between factors and e is the residual error. SNK test was used to test treatments in factorial arrangements. The level of significant difference was set at p<0.05.
RESULTS
During the period of 8–21d of age of broilers, the use of prediction equations or tables (Rostagno et al., 2005) resulted in diets with underestimated energy values compared to the broilers requirements (Table 5). During 22 to 35 d old, the equations proposed by Janssen (1989) and Mariano et al. (2012) and general equations proposed by Nascimento et al. (2009) and Rostagno et al. (2005) or the use of tables (Rostagno et al., 2005) were adequate but the use of AMEn values of feedstuffs obtained in vivo and the other prediction equations resulting in diets with high AMEn compared to the requirements for this phase. During 36 to 42 d old, only the equations proposed by Janssen (1989) and the specific equations proposed by Nascimento et al. (2011a; b) and Rodrigues (2000) and Rodrigues et al. (2002) were suited to the values required by the birds. At this phase, all other equations, as well as tables or equations proposed by Rostagno et al. (2005), resulted in diets with AMEn lower than recommended, while the use of energy values obtained in vivo was overestimated.
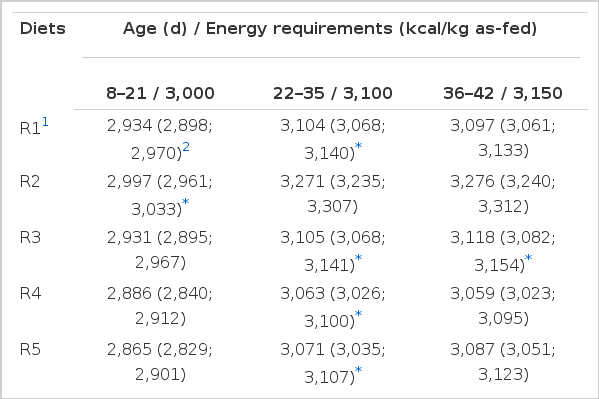
Apparent metabolizable energy corrected to nitrogen balance (kcal/kg as-fed) with respective confidence intervals (95%), obtained in metabolism trial with broilers diets formulated with energy values of corn and soybean meal obtained from tables, in vivo assay or prediction equations
Regarding AMC, the diets with higher EE content had the highest (p<0.05) values of AMCDM only during 36 to 42 d of age of broilers, in other words, the use of in vivo values of AMEn of feedstuffs or obtained by equations proposed by Janssen (1989) or specific ones proposed by Nascimento et al. (2011a; b) or Rodrigues (2000) and Rodrigues et al. (2002) led to the diets with the highest values.
The use of AMEn of feedstuffs obtained in vivo or by equations proposed by Janssen (1989), Nascimento et al. (2009) (general equation) and Mariano et al. (2012), that also resulted in diets with higher EE content, generated (p<0.05) diets with higher AMCCP during 8 to 21 d of age. During 22 to 35 d, all diets had similar values, except (p<0.05) those formulated with AMEn values of feedstuffs shown in tables (Rostagno et al., 2005) or obtained by the equation prediction proposed by Janssen (1989), whose values were lower. During 36 to 42 d, the use of the equation proposed by Rostagno et al. (2005) resulted (p<0.05) in higher AMCCP.
Higher values (p<0.05) of AMCEE during 8 to 21 d of age were obtained in diets formulated with AMEn of feedstuffs obtained in vivo or by equations proposed by Rodrigues (2000) and Rodrigues et al. (2002). In the following stages, only the use of in vivo values were effective (p<0.05), followed by the use of specific equations of Nascimento et al. (2011a; b) or those proposed by Janssen (1989) or Mariano et al. (2012) or Rodrigues (2000) and Rodrigues et al. (2002) in the period 22 to 35 d of age, and only by Rodrigues (2000) and Rodrigues et al. (2002) during 36 to 42 d old.
No interactions (p>0.05) between gender and diets was observed in any variables (Table 6). The diets did not affect (p>0.05) the weight gain. Lower feed intake was observed (p<0.05) during the total period of evaluation (1 to 42 d) when diets were elaborated with AMEn values determined in vivo or estimated by the prediction equation proposed by Janssen (1989). The feed:gain was lower (p<0.05) when AMEn values of feedstuffs obtained in vivo were used in all evaluated periods, except in the first week of age of broilers, when no difference was observed between the diets. Regarding equations, those proposed by Rodrigues (2000) and Rodrigues et al. (2002) showed lower feed:gain during 1 to 21 d of age of broilers, keeping this behaviour in the later stages. Considering the period of 1 to 42 d old, equations proposed by Janssen (1989) or Mariano et al. (2012) showed better feed:gain (p<0.05), similar to the equations proposed by Rodrigues (2000) and Rodrigues et al. (2002).

Apparent metabolisability coefficient (AMC) of nutrients, performance and carcass and cuts yield of broilers fed diets elaborated using prediction equations, composition tables or in vivo assay to estimate the energy values of feedstuffs
No effect of the diets was observed in carcass traits (Table 6), except for carcass yield, which was higher (p<0.05) when AMEn of feedstuffs was obtained in vivo or by equations proposed by Janssen (1989) or Mariano et al. (2012) or Nascimento et al. (2011a; b) or Rodrigues (2000) and Rodrigues et al. (2002).
DISCUSSION
The results show the importance of knowledge of chemical composition of feedstuffs used for broilers. The differences observed between the AMEn of diets show the necessity of using appropriate AMEn of feedstuffs. The use of tables to obtain the AMEn values of feedstuffs is not always adequate to meet the requirements of the broilers, as shown in the phases of 8 to 21 and 36 to 42 d old (Table 5). This result is probably due to the fact that most studies use broilers from 22 to 35 d old to determine the AMEn values of feedstuffs. This suggests the necessity of using more accurate methods to determine the energy values of feedstuffs used in broiler nutrition.
It was observed that diets formulated with AMEn values of feedstuffs obtained in vivo fit the broiler requirements only during 8 to 21 d of age. Probably, this occurred because the energy values of the ingredients described in the tables were determined with broilers in the growth phase (21 to 35 d old), in which the bird’s digestive capacity is already more developed. In contrast, the digestive tract of birds in the pre-initial phase is in early development, with less ability to digest, which affects the utilization of the energy content of the ingredient. This fact was also observed by Nir et al. (1993) in which a value of 3,244 kcal of AME/kg for the first week-old birds was obtained, and this value was 6% lower than indicated in the Nutrient of Requirements of Council (NRC, 1994). In the present work, because the highest AMEn values of the diets were observed in later stages of growing, and were higher than those calculated to meet the broilers requirements, it is suggested that dietary nutrients have a higher capacity of utilisation in older broilers.
Brumano et al. (2006) observed that the AMEn values of protein feedstuffs evaluated with broilers from 41 to 50 d of age was 13% higher than the AMEn values obtained with broilers from 21 to 30 d old. Kato et al. (2011) also suggest that broilers until 2 wk take less nutrients of corn. This fact indicates that with advancing age and the development of their digestive tract, there is better feed utilization by the birds.
Regarding the differences observed between the AMEn values of diets, it was noted that higher oil inclusion resulted in diets with high levels of AMEn, as verified in diets formulated with AMEn values determined in vivo or by equations proposed by Rodrigues (2000) and Rodrigues et al. (2002). It is known that the presence of higher amounts of lipids can improve the energy efficiency of the diet, since these nutrients produce 2.25-fold more calories than carbohydrates. In fact, it was observed in the present work that diets with higher AMCEE had higher AMEn values. Moreover, the extra-caloric effect of the oil may have a direct influence on nutrient digestibility (Sakomura et al., 2004). In this case, it is important to consider the adequate energy balance of diets, since low energy limits the development of tissues and the excess reduces the intake of essential nutrients.
Regarding AMCCP, this value represents the coefficient of nitrogen retention by birds. According to Tesseraud et al. (2011), the AMCCP are related to the amino acids balance in the diet since the lack or excess of one or more amino acids may interfere with synthesis of protein in tissue. Although the amino acid profile was the same between the experimental diets, the use of the dietary amino acids is related to the digestibility of protein, which in turn depends on the presence of other nutrients in the diet, such as lipids or fibres. In this study, all diets had similar values, although they differed statistically but with no relation to the performance or carcass traits.
The results obtained with performance show that the adequate adjustment of the dietary energy in diets for broilers in the initial phase of growing is essential for the development of the birds in the later stages. In the present study, the use of AMEn values of feedstuffs determined in vivo to formulate diets was the only one that met the requirements of broilers during 8 to 21 d of age (Table 5), whereas other sources used to obtain the AMEn values resulted in diets with energy values lower than recommended. On the other hand, the performance could also be related to different levels of oil used that could influence the use of dietary nutrients. It is important to emphasise that the addition of oil was related to food energy values estimated by equations, tables, or in vivo assay.
Influence of energy levels of diets on performance can be found in the literature. Positive results of performance with increase of the AMEn levels in diets were observed by Mendes et al. (2004), Sakomura et al. (2004), Duarte et al. (2007) and Dozier et al. (2011). On the other hand, some studies have shown negative effects of energy levels in the feed:gain (Albuquerque et al., 2003) and weight gain (Xavier et al., 2008), probably due to the imbalance between major nutrients in cellular metabolism. These studies reinforce the necessity of knowing the actual energy value of feedstuffs, avoiding unbalanced diets for poultry.
Regarding the characteristics of carcasses, the results showed that the use of different energy values of feedstuffs could influence the carcass yield of broilers. Andreotti et al. (2004), when working with oil levels ranging from 0 to 9.9%, found that this nutrient may also influence abdominal fat and carcass traits. On the other hand, Monfaredi et al. (2011) claim that oil supplementation in low-energy diets can reduce the abdominal fat and improve the carcass yield, arguing that the presence of lipid spares the use of amino acids as energy sources, these being directed towards protein synthesis. In the present work, the greater carcass yield may be related not only to the presence of oil in the diets, but also to the different energy levels. The best combinations of corn, soybean meal and soybean oil resulting from the use of certain equations or values of AMEn of feedstuffs obtained in vivo led to the balance of nutrients adequate to the bird's metabolism, improving the carcass yield.
Overall, considering all parameters, the best equations were the specific ones proposed by Janssen (1989) or Rodrigues (2000) and Rodrigues et al. (2002) and also the general equation proposed by Mariano et al. (2012). The equations proposed by Rodrigues (2000) and Rodrigues et al. (2002) are specific equations for corn and soybean and their respective by-products, while the equations proposed by Janssen (1989) are specific to corn and soybean only. On the other hand, the equation presented by Mariano et al. (2012) is indicated for any concentrated feedstuffs used for broilers. However, further studies should be performed regarding this last equation to test the effectiveness with other foods.
In this study, it was found that all equations were better than the use of tables of chemical and energy composition of feedstuffs, resulting in broilers with better performance and carcass yield. Despite these indications, no equations were as efficient as the use of AMEn of food obtained in vivo. The results suggest that knowledge of the energy value of food is important, since this directly influences the energy values of diets.
Acknowledgements
The work was supported by Fundação de Amparo à Pesquisa do Estado de Minas Gerais (FAPEMIG), Conselho Nacional de Desenvolvimento Científico e Tecnológico (CNPq) and Instituto Nacional de Ciência e Tecnologia em Ciência Animal - INCT-CA.