Effect of High Phytase Inclusion Rates on Performance of Broilers Fed Diets Not Severely Limited in Available Phosphorus
Article information
Abstract
Phytate is not only an unavailable source of phosphorus (P) for broilers but it also acts as an anti-nutrient, reducing protein and mineral absorption, increasing endogenous losses and reducing broiler performance. The objective of this study was to investigate the anti-nutritional effects of phytate by including high levels of phytase in diets not severely limited in available P. A total of 768 male Arbor Acres broilers were distributed in six treatments of eight replicate pens of 16 birds each consisting of a positive control diet (PC), positive control with 500 FTU/kg phytase, negative control (NC) diet with lower available P and calcium (Ca) levels and the same NC diet with 500, 1,000 or 1,500 FTU/kg phytase. Body weight gain (BWG), feed intake (FI), feed conversion ratio (FCR) and mortality were determined at 21 and 35 d of age while foot ash was determined in four birds per pen at 21 d of age. FI, FCR and foot ash where not affected by the lower mineral diets at 21 d of age nor by the enzyme inclusion but broilers fed lower Ca and available P diets had lower BWG. At 35 d of age no difference was observed between broilers fed the positive or NC diets but broilers fed 500, 1,000 and 1,500 FTU/kg on top of the NC diet had better FCR than broilers fed the positive control diet. When compared to birds fed a diet adequate in P, birds fed the same diet included with 500, 1,000 and 1,500 FTU/kg of phytase in marginally deficient available P and Ca diets had an improvement of performance. These results support the concept that hydrolysing phytate and reducing the anti-nutritional effects of phytate improves bird performance on marginally deficient diets that were not covering the P requirement of birds.
INTRODUCTION
The nomenclature used in the literature for the substrate of phytase enzymes varies from phytin (complexes of inositol hexaphosphate with potassium, magnesium and Ca as occurs in plants), phytic acid (myo-inositol hexaphosphate), and the term most commonly used in animal nutrition: phytate (mixed salt of phytic acid; Selle and Ravindran, 2007). Originally recognized as a source of P during the germination process in plants, it also plays an important role in preventing oxidative stress and consequently embryo death (Doria et al., 2009). This is thought to be related to the ability of phytic acid to chelate minerals such as I, Ca and Zn, reducing the formation of reactive oxidative compounds that can be created during germination (Doria et al., 2009).
In animal nutrition, phytate is recognized as an unavailable source of P for broilers and swine, but this has changed recently with the advent of exogenous phytases (Elkhalil et al., 2011). Nevertheless, besides being a possible source of P, phytate is also considered an anti-nutrient for broilers (Cowieson et al., 2011), reducing protein (Liu et al., 2009) and mineral absorption (Plumstead et al., 2008), increasing mucus production (Cowieson et al., 2004) and interfering with broiler performance (Linares et al., 2007).
Differences exist between phytases in their ability to degrade phytate and thus release P and as a result this needs to be taken into account when they are used in commercial diets (Silversides et al., 2004). The inclusion of higher levels of phytase in broilers diets has shown to improve broiler performance (Pirgozlev et al., 2011), while also improving the antioxidant status of animals (Karadas et al., 2010), which can be related to a reduction in the anti-nutritive effect of phytate. As a result, the objective of this study was to investigate the anti-nutritional effect of phytate and benefits associated with phytate hydrolysis with the inclusion of high doses of phytase in a diet not severely limited in available P.
MATERIALS AND METHODS
Birds
Seven hundred- sixty eight male Arbor Acres broilers were sourced specifically for the experiment and housed in 48 pens with 16 birds per pen from d 0 to 21 and 12 birds per pen from d 22 to 35. Pen dimensions were 1.0×1.5 m with rice hulls as bedding. Birds had ad libitum access to nipple water drinkers and semi-automatic feeders. Treatments consisted of a positive control diet (PC), PC diet with 500 FTU/kg phytase (PC500), negative control (NC) diet with lower available P and Ca levels (NC), and the same NC diet with 500 (NC500), 1,000 (NC1000), or 1,500 FTU/kg (NC1500) phytase. The phytase used in this experiment was an enhanced E. coli phytase (Quantum Blue), provided by AB Vista Feed Ingredients (Marlborough, UK), with an expected activity of 5,000 FTU/g.
Feed production
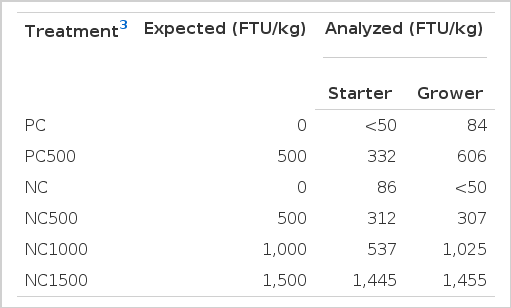
Diets were formulated as described in Table 1. The starter diet was provided from 0 to 21 d and the grower from 22 to 35 d of age. During manufacture of the PC and NC diets, three samples were collected, homogenized and a sub-sample taken for Ca and P determination. Portions of the PC and NC diets were then separated and re-mixed with the relevant phytase inclusion level to generate the other treatments. The same sampling protocol was followed to collect samples from all treatments for phytase analysis.

Ingredient and nutrient composition of experimental diets
Sample collection
Birds were weighed by pen before to placement (d 0), on d 21, and on d 35 to determine mean BW and calculate mean body weight gain (BWG) for each period and on cumulatively (d 0 to 35). Feed intake (FI) was measured and feed conversion ratio (FCR) calculated for each period and cumulatively (d 0 to 35). Mortality and building temperature were recorded daily. Culled birds or mortality were weighed, and FI and FCR were adjusted according to the number of bird days. At d 21, four birds per replicate were euthanized by cervical dislocation and their left feet were collected for determination of bone ash. Foot samples were cleaned from any other material, de-fatted and weighted prior to ash determination as described by Garcia and Dale (2006). Degree of maturation of bones for bone ash determination at the age investigated is an important factor as it’s important to ensure that bone selected is still growing and mineralising to likelihood of detecting differences between treatments (Karimi et al., 2011). Foot ash achieve a pick at around 21 d, reducing it afterwards (Oliveira, 2006).
Mineral analysis and enzyme activity in feed
Dietary Ca was determined by atomic absorption and P analyses were conducted colorimetrically (Vipperman et al., 1974). Enzyme activity determination were conducted by a laboratory (ESC, Ystrad Mynach., UK) using the reference method of analysis recommended by the supplier (Basu et al., 2007).
Statistical analysis
All statistical analyses were carried out using JMP version 8 (SAS Institute Inc, Cary, NC, USA). Data were analysed using the least square means procedure. Pen was considered as the experimental unit and the model included treatment and replicate pen. Mortality data was log transformed prior to statistical analysis but reported (Table 3) as untransformed because is more acceptable for readers. Significant means were separated using t-test, with significance accepted at p<0.05 and trends were discussed at p<0.10.
Analysis of variance of the effect of P level and phytase inclusion on FCR, BWG, FI, mortality and foot ash of broilers at 21 d
RESULTS AND DISCUSSION
Animal performance and foot ash
Analyzed dietary Ca and P values were higher than expected but with similar differences between treatments (Table 1). Analyzed phytase activity results varied from target but not untowardly (Table 2). Determination of phytase activity in feeds are extremely variable, with reproducibility and repeatability relative standard deviations varying up to 13% and 43% depending on the method of analysis (Gizzi et al., 2008). This high variation in phytase determination in feed makes difficult to take conclusions based in these values. As a consequence, all conclusions in this experiment were taken as phytase inclusion and activity in feed were as expected.
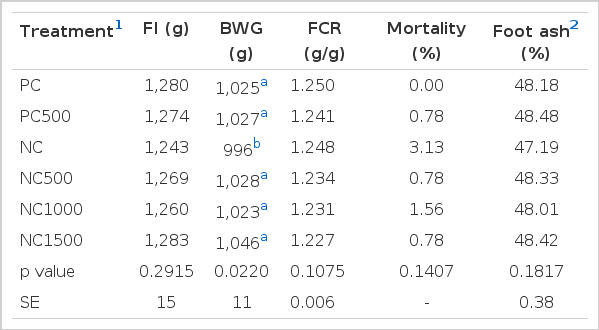
Results on broiler performance from d 0 to 35 and foot ash at d 21 are presented in Table 3 and 4, respectively. Mortality was less than 4% not affected (p>0.05) by dietary treatments. FI, FCR and foot ash of broilers at 21 d of age were not affected (p>0.05) by the lower P and Ca in the diet nor by the enzyme inclusion. Broilers fed the low Ca and P (NC) diet without phytase inclusion had lower (p<0.05) BWG at 21 d than broilers fed all other diets. At 35 d of age, no differences (p>0.05) were observed between broilers fed the PC or the NC diet. Broilers fed PC500, NC1000 or NC1500 were more efficient (p<0.05) by approximately 3 points compared to broilers fed the PC.

Analysis of variance of the effect of P level and phytase inclusion on FCR, BWG, and FI of broilers at 35 d
The PC diet was formulated to mimic feed formulation levels currently used in Southeast Asia (Creswell, 2012), while the NC diet was formulated to be marginally deficient in Ca and available P. When comparing the trial’s formulation with levels of energy, amino acids and minerals recommended by the genetic line (Aviagen, 2009), Ca and available P levels of the current trial were lower, while energy and amino acids were close or higher than the recommendation. Levels of Ca and P formulated in this trial are supported by the literature that shows birds requirement of available P to be 0.39% from 0 to 21 d (Waldroup et al., 2000) and 0.33% from 21 to 42 d (Yan, 2001) and that 0.9% calcium may be excessive for optimum bird performance (Driver et al., 2005).
At 21 d of age, broilers fed lower available P and Ca diets had lower BWG than birds fed PC diets but no differences in FI, FCR or tibia ash were observed. At 35 d of age no difference of performance was observed between birds fed PC and NC diets. The performance of animals fed the PC diets were comparable with the guidelines for this genetic line (Aviagen, 2012), and supports the tenet that this diet met the birds’ nutrient requirements. The absence of difference in bone mineralization at 21 d in the birds fed the NC diet compared with birds fed the PC diet, when the former had lower BWG, was not expected as P requirements for bone mineralization are generally considered to be higher than that for animal performance. One explanation for this observation could be that bone mineralization was measured by the ash concentration (as a percent) and not bone ash content (as mg/bone) on an absolute basis. Bone ash content (as mg/bone) is a more sensitive method to determine bone mineralization when compared with bone ash concentration (Hall et al., 2003; Coon et al., 2007). In addition, the methodology described had been used for birds at 14 d of age (Garcia and Dale, 2006) while in the present study foot ash was determined using older birds, which may also interfere in the final result due to higher mineralization in these bones. The small differences in performance between birds fed the PC and NC diets could have been influenced by the actual concentration of both Ca and P in the diets being slightly higher than expected (Table 1), but this also confirms the PC diet was well above requirement for these nutrients and the NC diet was only marginally deficient.
At 21 d, phytase inclusion in the NC diet improved animal performance to a level comparable to the PC and the PC500 diets, which may suggest phytase was able to hydrolyze the phytate, improving P digestibility and consequently the performance of birds fed marginally deficient P diets. The use of phytase to hydrolyze phytate and increase P availability is the major reason why phytase is commercially used in broiler nutrition (Onyango et al., 2005). At 35 d, animals fed the PC500, NC1000 or NC1500 had better FCR than animals fed the PC diets. This improvement cannot necessarily be explained by an improvement in P nutrition as the low P and Ca in the NC diet did not negatively influence performance compared with the PC.
Phytate interacts with proteins (Liu et al., 2009), reducing its digestibility for broilers, reduces mineral absorption (Plumstead et al., 2008), and increases endogenous losses (Cowieson et al., 2004), characterizing it as an anti-nutrient for broilers (Cowieson et al., 2011). Phytase hydrolyzes the phytate molecule, releasing P and at the same time reducing the concentration and thus the anti-nutritional effects of phytate. Previous trials have shown that birds fed high levels of phytase have better FCR (Pirgozlev et al., 2011) and anti-oxidant status (Karadas et al., 2010), compared with birds fed diets sufficient in available P. In the present experiment, 500 FTU/kg inclusion of phytase in an available P adequate diet and 1,000 and 1,500 FTU/kg inclusion of phytase in a marginally deficient diet improved FCR of birds compared with birds fed a diet meeting the available P and Ca requirement, supporting the concept that hydrolysing phytate and consequently reducing the anti-nutritional effects of phytate can improve bird performance, particularly feed efficiency.
IMPLICATIONS
Phytate interferes with bird performance by reducing amino acid digestibility, mineral absorption and increasing endogenous losses.
The use of high dosages of phytase may allow for significantly improved FCR beyond that achievable with standard diets through the elimination of the anti-nutrient effects of phytate.
These results infer that growth performance of the modern broiler is currently constrained by dietary phytate.