T Cells Development Is Different between Thymus from Normal and Intrauterine Growth Restricted Pig Fetus at Different Gestational Stage
Article information
Abstract
This experiment was conducted to evaluate the development of T cells in intrauterine growth retarded (IUGR) piglets at different gestational stages, and tentatively explore the relationship between T cells development and the Notch signaling pathway. A total of 18 crossbred (Landrace×Large white) primiparous sows were mated at similar weights and estruses and euthanized at d 60, 90 and 110 of gestation with six replicates for each time point. One IUGR and one normal fetus were picked from each litter. The T-cell subsets, mRNA expression of Delta-like1, Delta-like4, Jagged1, and Notch2 genes in the thymus were investigated. Compared to normal piglets, CD3+CD4−CD8+ cells in IUGR fetuses at d 90 was 0.13% lower (p<0.05). At d 110 of gestation CD8+ T cells in IUGR fetuses was 0.19% lower (p<0.05). The percentage of CD8+ T cells was 3.14% lower (p<0.05) of the total T cells in IUGR pigs at d 60. The abundance of Notch2 and Delta-like4 mRNA at d 110 was 20.93% higher and 0.77% (p<0.05) lower, and Delta-like1 mRNA at d 90 was 0.19% (p<0.05) higher compared to normal pigs. These results suggested that normal fetuses had a greater proportion of T-cell subsets at earlier gestation periods, and the Notch signaling pathway was likely partially responsible for these differences to some degree.
INTRODUCTION
Intrauterine growth retardation (IUGR) is defined as impaired growth and development of the mammalian embryo/fetus or its organs during pregnancy, and is a major concern in domestic animal production and human health (Wu et al., 2006; Rosenberg, 2008). Much research has shown that IUGR is a significant risk factor with respect to increased neonatal morbidity and mortality rates in domestic animals and humans, especially in the first day after birth (Williams et al., 1982; Azzam et al., 1993; Van Rens et al., 2005). Pig exhibits the most severe naturally occurring IUGR among domestic mammals with 15 to 20% of newborns have a birth weight <1.1 kg in comparison with a normal birth weight of 1.4 kg (Wu et al., 2006; Wang et al., 2008). Humans express diminished thymus and spleen size, the smaller number of lymphocyte counts, reduced cell-mediated immunity and thymopoietin production (Ferguson et al., 1974; Chandra, 1975; Manerikar et al., 1976; Mussi-Pinhata et al., 1993; Neumann et al., 1998; McDade et al., 2001).
The development and function of T cell is necessary to animal growth. The thymus is one of the most important lymphoid organs in swine and is required for normal T-lymphocyte development and function (Jiménez et al., 2001; Hozumi et al., 2008; Patel et al., 2009). Recently, many researchers have demonstrated that the Notch signaling pathway, encompassing Notch receptors and ligands, is a very important way to modulate T lymphocyte development (Jaleco et al., 2001; Costa et al., 2005). In mammals, Notch receptors include Notch 1 to 4, while Notch ligands include the Jagged (Jagged1, 2) and Delta-like (Delta-like1, 3, 4) families (Wolfer et al., 2002). The roles of Notch receptors and ligands have been studied through knock-in and knock-out mice or hematopoietic progenitors. However, there is little information about the T cells development from thymus in IUGR piglet, especially at different gestation periods. And it is still not clear the genes expression of the Notch signaling pathway in IUGR fetuses. To investigate the differences of early development of T cells and the expression of the Notch signaling pathway between normal and IUGR fetuses, we determined the T cell subsets at different gestation periods in the fetus, and the mRNA expression levels of Delta-like1, Delta-like4, Jagged1 and Notch2 genes.
MATERIALS AND METHODS
Animals and tissue collection
A total of 18 crossbred (Landrace×Large white) primiparous sows were mated at similar weights and estruses and kept in a Lantau Peak breeder of the Hunan Zhenghong Company, then slaughtered at d 60, 90 and 110 of gestation, with six replicates at each time point. One normal (average body weight 133±9 g, 792±75 g, 1,453±89 g, respectively) and one IUGR fetus (average body weight 87±4 g, 480±24 g, 712±52 g, respectively) (body weight less than 3% average litter weight) were selected from each litter to collect the thymus (Rosenberg, 2008). One part of the thymus was washed in Hank’s buffered salt solution (HBSS) and phosphate-buffered saline (PBS), placed into RPMI 1640 and stored at 4°C immediately, under sterile conditions, with another part stored in liquid nitrogen.
Cell isolation
The collected thymus was placed in a cell culture dish containing PBS and moved to a laminar flow cabinet, then washed with HBSS and PBS three times to remove any contaminating blood. Following removal of the thymic capsule with ophthalmic scissors and fine forceps, thymus lobes were collected in a Petri dish (9 cm diameter) with PBS to isolate thymocytes. All thymocytes were filtered through a 100 μm cell sieve, washed and resuspended in PBS. Cell viability was greater than 99%, as measured by trypan blue exclusion (Dacasto et al., 2001).
Flow cytometry
About 1×10⁶ T cells were seeded into a flat-bottomed microtiter plate (Becton Dickinson, Lincoln Park, NJ, USA) and then stained with 2 μl of a primary antibody, diluted in PBS (FITC-labeled IgG2b mouse anti-pig-CD4, PE-labeled IgG2a mouse anti-pig CD8α or SPRD-labeled mouse anti-pig CD3ε; Southern Biotechnology Associates, Inc., Birmingham, AL, USA) and appropriate isotype control antibodies (mouse IgG2b for anti-CD4, mouse IgG2a for anti-CD8 and mouse IgG1 for anti-CD3ε; Southern Biotechnology Associates). After incubation for 30 min at room temperature, cells were washed twice with PBS and centrifuged for 15 min at 1,000×g. Finally, cells were diluted with PBS and made up to a final volume of 500 μl. Three-color flow cytometric analysis was conducted with a Coulter XL flow cytometer (Beckman Coulter Corp., USA).
Total RNA isolation and reverse transcription (RT)
Total RNA was isolated from the thymus using an RNeasy Mini Kit (Qiagen GmbH, Hilden, Germany) according to the manufacturer’s instructions. RNA integrity was verified electrophoretically by ethidium bromide staining, and RNA in samples was quantified. The RNA concentration and purity was determined using UV-clear microplates (TECAN) at OD260 and OD280. The OD260/OD280 ratio of all samples was greater than 1.80. Total RNA was reverse transcribed by adding 2 μl of RNA isolated from each pig or cell sample to a 25 μl reaction containing 2.0 μl oligo(dT)18 primers (Promega), 1.0 μl dNTPs (Sigma), 1.25 μl RNasin inhibitor (Promega), 2.5 μl M-MLV transcriptase (Promega), 5.0 μl M-MLV RT reaction buffer (Promega) and 11.25 μl RNase-free water. The first-strand reaction mixture included RNA, oligo(dT)18 primers and 5× buffer, and was incubated at 75°C for 5 min, followed by 2 h at 37°C after the addition of the remaining reagents. The reaction was terminated by incubation for 5 min at 95°C. The resulting cDNA was stored at −20°C for relative quantification by PCR.
Real-time PCR analysis
Quantitative analysis of PCR was carried out on a DNA Engine Opticon 2 fluorescence detection system (MJ Research) according to optimized PCR protocols with a DyNAmo SYBR Green qPCR kit (Finnzymes). The PCR consisted of 10.0 μl SYBR Green qPCR mix, 2.0 μl cDNA, 7.6 μl double distilled water and 0.4 μl primer pairs (25 μM forward and 25 μM reverse) in a total volume of 20 μl. The following thermal profile was used: 50°C for 2 min, 95°C for 10 min, then 33 cycles of 94°C for 30 s, appropriate annealing temperature for 30 s, 72°C for 30 s with a single fluorescence measurement. Following the 33 cycles, a melting curve program (65 to 95°C with a heating rate of 0.1°C/s and continuous fluorescence measurement) was incorporated and then a final incubation at 72°C for 8 min. The annealing temperatures for Delta-like1, Delta-like4, Notch2, Jagged1 and β-actin were 66, 60, 58, 62, and 64°C, respectively. All samples were measured in triplicate. To amplify Delta-like1, Delta-like4, Notch2 cDNA fragments, the sequences for PCR primer pairs were designed in Oligo6.0 and are presented in Table 1.
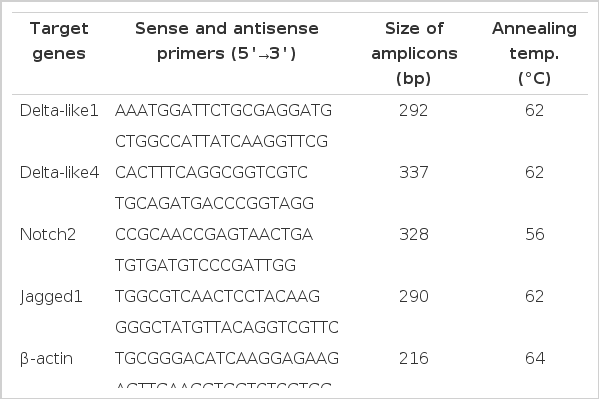
Oligonucleotide primers used in various PCRs
Statistical analysis
All data were analyzed by paired Student’s t-test using SAS 8.2. Differences were considered statistically significant when the p-value was less than 0.05.
RESULTS
Percentage of T-cell subsets in total lymphocytes during gestation
Some differences were observed among T-cell subsets at d 60, 90 and 110 of gestation (Table 2). There was a significant (p<0.01) difference in percentage of CD3+CD4+CD8+ or double positive (DP) T cells in total lymphocytes between IUGR and normal fetuses at d 60 of gestation (2.07% vs 2.47%). CD3+CD4−CD8+ (CD8+ T) cells in IUGR fetuses were lower (p = 0.065) than those in normal fetuses at d 60 (0.52% vs 0.94%). Flow cytometric analysis demonstrated that the numbers of CD8+ T cells (0.13%, p<0.01) and αβ-T cells (0.87%, p<0.05) were decreased in IUGR fetuses at d 90 (2.99% vs 3.12%, 9.64% vs 10.51%, respectively). Compared with normal fetuses, the percentage of CD3+CD4−CD8− or double negative (DN) T cells and CD8+ T cells in total lymphocytes was 0.41% (p<0.01) lower and 0.19% (p<0.05) lower in IUGR fetuses at d 110.
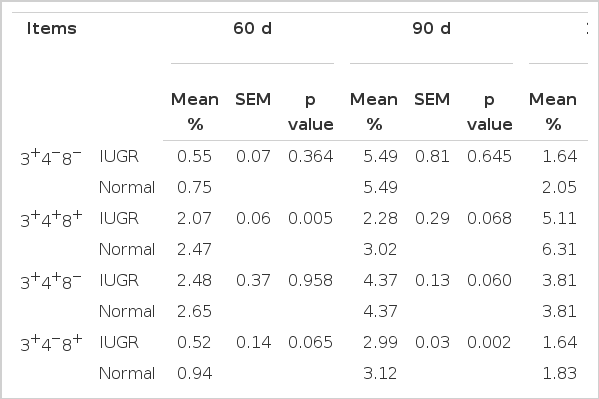
The percentage of T-cell subsets in total lymphocytes during gestation
Differences in percentage of T-cell subsets among total T lymphocytes
Contrary to the percentage of DP T cells in total lymphocytes, the percentage of total lymphocytes were not different between IUGR and normal fetuses at d 60 (Table 3). The percentage of CD8+ T cells in IUGR fetuses was 3.14% lower than that of normal fetuses at d 60 (p<0.05). As gestation continued, normal fetuses had higher numbers of CD8+ T cells at d 90 (p = 0.068), with no difference on d 110. The percentage of CD3+CD4+CD8− (CD4+ T) cells compared with T cells in IUGR fetuses at d 60 was 5.66% higher than that of normal fetuses (p = 0.062). At d 110, no difference existed in the percentage of T-cell subsets (p>0.1) between IUGR and normal fetuses.
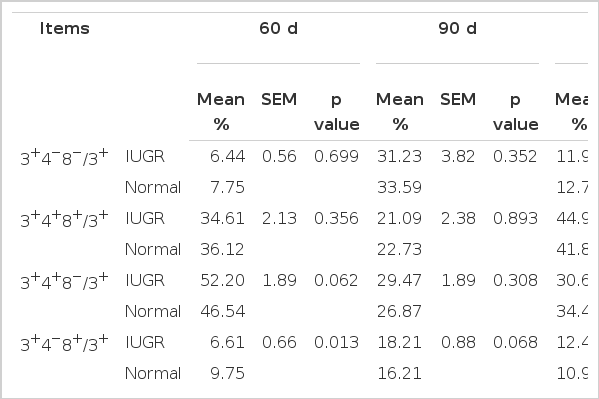
The percentage of T-cell subsets among total T lymphocytes during gestation
mRNA expression of Delta-like1, Delta-like4, Notch2 and Jagged1
Quantitative real-time PCR was performed to determine the difference in mRNA abundance levels of Delta-like1, Delta-like4, Notch2 and Jagged1 relative to β-actin between normal and IUGR fetuses. As shown in Figure 1, Notch2 mRNA abundance in IUGR fetuses was closed to that of normal fetuses at d 60 and 90, and was finally 20.93% higher at d 110 (p<0.05). There was a significant (p<0.05) difference in Delta-like1 mRNA abundance levels between IUGR and normal fetuses at day 90 of gestation (0.32% vs 0.13%). The Delta-like4 mRNA abundance in IUGR fetuses was decreased by 0.77% compared with normal ones at d 110 (p<0.05). Jagged1 mRNA was not detected at all three gestation stages.
Real-time PCR analysis. The expression of Delta-like1 (A), Delta-like4 (B) and Notch2 (C) mRNA in the thymus relative to β-actin. Each point represents the mean±SE; p<0.05 compared with the normal group.
DISCUSSION
The procedure of T cell development in the thymus progresses from DN T cells to DP T cells, and then to a CD4+ T or CD8+ T cell, and finally to mature CD4+ and CD8+ T cells being released into the peripheral blood. It has been reported that IUGR fetuses and infants have a lower immune capability than normal ones (Ferguson et al., 1974; Williams et al., 1982; Azzam et al., 1993; Van Rens et al., 2005; Rosenberg, 2008). Some experiments were conducted to determine whether the difference was caused by the composition of T-cell subsets. One former experiment showed that differences existed in T-cell subsets between IUGR and normal piglets after birth, probably explaining why IUGR piglets had lower immunity than normal ones (Lin et al., 2009). Thus, we speculated that the different development of T-cell subsets could possibly explain why IUGR piglets and infants had higher mortality and morbidity rates, especially in the first week after birth. In the present study, we attempted to verify whether there was a difference at earlier developmental stages of the thymus. This was the first time that differences in T cell development between IUGR and normal fetuses at different stages of gestation had been investigated.
The percentage of T-cell subsets to total lymphocytes gives an account of whether IUGR piglets possess a standard ability of T cell development compared to normal piglets (Neumann et al., 1998). In the present study, the percentage of CD3+CD4+CD8+ cells in IUGR fetuses at day 60 was lower than in normal fetuses, however, at later periods of gestation, this difference was no longer apparent. This was the possible reason that CD4+ and CD8+ T cells exhibited a slow pace of development during the early stages of T cell development in IUGR piglets.
The αβ-T cells are the progenitor cells that continue along the maturation pathway, and their numbers provide details regarding the capacity for T-cell development. CD3+, a surface antigen, is used to distinguish T cells from B cells, therefore the percentage of CD3+ gives an indication of whether T cell development in the thymus is normal. The higher percentage of αβ-T and CD3+ cells in normal fetuses at d 60 and 90 allows for the conclusion that normal fetuses have a greater proportion and absolute number of T-cell subsets after birth than IUGR fetuses.
The percentage of T-cell subsets represents their balance among the total T cell population. In this study, the percentage of DP T cells amongst total lymphocytes was significantly different between IUGR and normal fetuses. The total number of T lymphocytes was not different at d 60. This suggested that the absolute number of DP T cells in IUGR piglets was lower than that of normal piglets, although the proportion of T cells was normal. The differences between T-cell subsets in IUGR and normal piglets diminished over time but were still present. So, the IUGR fetuses could recover to a normal immune condition.
The flow cytometry results demonstrated that some T cell subsets in the thymus of normal fetuses were higher than in IUGR piglets, possibly explaining the discrepancy in quantity or proportion of T cell subsets, lower levels of immunity and higher mortality rates after birth (Ferguson et al., 1974; Manerikar et al., 1976; Mussi-Pinhata et al., 1993; Neumann et al., 1998; Rosenberg, 2008; Lin et al., 2009).
Compared with normal fetuses, the trend of Notch2 mRNA abundance in IUGR fetuses was lower at d 60, then a little higher at d 90, and finally observed to be at a high level at d 110. The different expression levels of Notch2 mRNA and proportion of T cell subsets between the IUGR and normal groups suggested that Notch2 played some role in T cell differentiation, which was in accordance with others research results (Maekawa et al., 2003; Witt et al., 2003). Saito et al. (2003) showed that Notch2 was only required for B cell development. Delta-like1 mRNA expression was different compared to Notch2, with normal piglets exhibiting higher levels than IUGR piglets at d 60 and 110, while at d 90, levels in IUGR piglets were higher. Many reports have shown that Delta-like1 could induce fetal liver, cord blood, bone marrow CD34, fetal thymus and hematopoietic progenitor cells to develop into mature T cells (Schmitt and Zúñiga-Pflücker, 2002; Costa et al., 2005; Patel et al., 2009). The discrepancy in expression between Delta-like1 mRNA agrees with the difference in proportion of T cell subsets between IUGR and normal fetuses during gestation. Delta-like4 mRNA expression was quite low between d 60 and 90, but then increased by d 110, and was significantly higher in normal fetuses. This probably indicated that the effects of Delta-like4 on T cell development occurred during the latter stages of gestation. Hozumi et al. (2008) showed that Delta-like4 is indispensable in the thymic environment for specific T cell development. Some results also supported the fact that Delta-like4 could induce formation of progenitor cells into T cells (Costa et al., 2005; Lefort et al., 2006). The result of this study showed that Jagged1 mRNA was not detected at all three gestation stages, which indicates that Jagged1 seems not related to the development of T cell of pig fetus. However, Jaleco et al. (2001) demonstrated Jagged1 can mediate differential effects of Notch signaling and provide a useful system to further address cell-fate decision processes in human lymphopoiesis. The different results maybe are related to different experimental animal and stage. The above results showed that normal fetuses have a greater proportion of T cell subsets at earlier gestation periods, and the genes expression of Notch signaling pathway has the corresponding change with T cells development. Thus we can conclude that Notch signaling pathway plays an important role in these differences. Notch signaling does play a role in T cell differentiation, but different Notch receptors and ligands are expressed at various stages of development. Further researches should be focus on the basis of this relationship.
Acknowledgements
The work was supported by New Century Excellent Talents in University (NCET-08-0540), the National Natural Science Foundation of China (No. 31172216, 31129006), the Special Foundation for Winners of National Excellent Doctoral Dissertations (2007B61).