Genetic Parameter Estimation in Seedstock Swine Population for Growth Performances
Article information
Abstract
The objective of this study was to estimate genetic parameters that are to be used for across-herd genetic evaluations of seed stock pigs at GGP level. Performance data with pedigree information collected from swine breeder farms in Korea were provided by Korea Animal Improvement Association (AIAK). Performance data were composed of final body weights at test days and ultrasound measures of back fat thickness (BF), rib eye area (EMA) and retail cut percentage (RCP). Breeds of swine tested were Landrace, Yorkshire and Duroc. Days to 90 kg body weight (DAYS90) were estimated with linear function of age and ADG calculated from body weights at test days. Ultrasound measures were taken with A-mode ultrasound scanners by trained technicians. Number of performance records after censoring outliers and keeping records pigs only born from year 2000 were of 78,068 Duroc pigs, 101,821 Landrace pigs and 281,421 Yorkshire pigs. Models included contemporary groups defined by the same herd and the same seasons of births of the same year, which was regarded as fixed along with the effect of sex for all traits and body weight at test day as a linear covariate for ultrasound measures. REML estimation was processed with REMLF90 program. Heritability estimates were 0.40, 0.32, 0.21 0.39 for DAYS90, ADG, BF, EMA, RCP, respectively for Duroc population. Respective heritability estimates for Landrace population were 0.43, 0.41, 0.22, and 0.43 and for Yorkshire population were 0.36, 0.38, 0.22, and 0.42. Genetic correlation coefficients of DAYS90 with BF, EMA, or RCP were estimated to be 0.00 to 0.09, −0.15 to −0.25, 0.22 to 0.28, respectively for three breeds populations. Genetic correlation coefficients estimated between BF and EMA was −0.33 to −0.39. Genetic correlation coefficient estimated between BF and RCP was high and negative (−0.78 to −0.85) but the environmental correlation coefficients between these two traits was medium and negative (near −0.35), which describes a highly correlated genetic response to selection on one or the other of these traits. Genetic Trends of all three breeds tend to be towards bigger EMA or greater RCP and shorter DAYS90 especially from generations born after year 2000.
INTRODUCTION
The most popular pig breeds in Korea are Landrace and Yorkshire for maternal lines and Duroc for paternal line. There are some, but not in large scale as Duroc, minor paternal line breeds used in small scale, which are Berkshire or Hampshire. Recent industrial needs for genetic evaluation of pigs for selection are increasing with global trends for seed stock pig patient. In Korean system of pig breeding, grand-grandparent (GGP) stockers maintain purebred animals. Grandparent stockers make cross between Landrace and Yorkshire lines (PS) for distribution to commercial farmers. Commercial feedlot operators usually adopt paternal lines as terminal sires to make three-way crossbreds.
The objective of this study was to estimate genetic and environmental variances of days to 90 kg body weight and ultrasound meat traits and covariances between these in purebred pig populations.
MATERIAL AND METHODS
Performance testing
Pigs weaned at around three to four weeks of ages, when they weigh around 35 kg, were grouped together by sexes into performance testing until they reach 70 to 110 kg body weight. At least four pigs per litter were selected for testing. At the time of testing, body weight was measured and ultrasound scanning on the back was made with A-mode (amplitude mode) scanners. Back fat thicknesses on the shoulder (on the 4th thoracic vertebrae), mid-back (on the last thoracic vertebrae) and loin (on the last lumbar vertebrae) were averaged. Days to 90 kg body weight (DAYS90) was calculated according to Korean Swine Performance Recording Standards (KSPRS), which assumes body weight at birth as 1 kg.
Eye muscle area (EMA) was estimated with A-mode ultrasound measures scanned at 5 cm ventral to the dorsal point of the last thoracic vertebrae. Average of three backfat thickness measurement was adjusted for body weight by the formula suggested by KSPRS.
EMA from ultrasound scanner were used directly for analyses without body weight adjustments. Retail cut percentage (RCP) was estimated also from A-mode scanner by the function embedded and used for analyses without body weight adjustment as well.
Models
Models for parameter estimation were separate for growth performance (DAYS90) and ultrasound scanned measurements.
Here, DAYS90: the days to 90 kg body weight calculated by the formula
ADG: average daily gain (g) from birth to test day
BF: average of back fat thicknesses (mm) measured at three points
EMA: eye muscle area (cm2, estimated from A-mode ultrasound scanner)
RCP: retail cut percentage (%, also estimated from A-mode ultrasound scanner)
CG: contemporary group effect (year and season of birth-farm)
sex: sex categories (1 = gilts, 2 = boars)
finwt: final weight (body weight at the end day of performance testing, kg)
And μ, β1, u, e are population mean, linear regression coefficient, breeding value of the animal (BV), temporary environmental effect, respectively.
EM REML estimates of the genetic and environmental variances and covariances between traits were estimated by remlf90 program (Mizstal, 2002). For random effects (u and e), all the genetic or environmental covariances between traits were assumed not zero. But the covariances between genetic and environmental effects were assumed to be all zeros.
Standard error estimates of the heritability estimates were approximated by the scalar modification of the method suggested by Fischer et al. (2004). The derivation of the variance of heritability estimate used in our study is as follows.
RESULTS AND DISCUSSION
Table 1 show the data structure for analyses by breeds. There were tendency to have greater number of boars for testing in Duroc population and greater number of gilts in Landrace or Yorkshire populations. This might be the farmers’ preference to keep animals of paternal or maternal use after completion of performance testing.
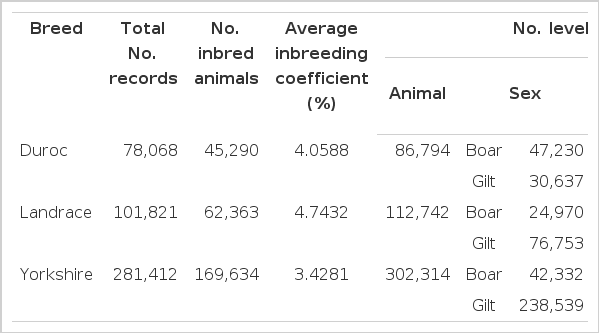
Pedigree and performance data structure by breeds
Estimates of fixed effects are summarized in Table 2 by breed groups. Estimates for sex effects were calculated from averaging out the other fixed effects (effects of contemporary groups) and applying average end weight multiplied by corresponding regression coefficients. Days required for gilts to reach 90 kg body weight (DAYS90) were larger than for boars by about 6 d in Landrace or in Yorkshire breeds and by about 4 d in Duroc breed. Gilts tended to have thicker backfat (BF) and larger eye muscle area (EMA) but smaller retail cut percentage (RCP) estimated by ultrasound scanner on the final day of the test. Partial regression coefficients of BF, EMA, and RCP on body weight at the test were all close to zero but were all significantly different from zero as they were estimated in preliminary analyses with least squares generalized linear models (data not shown). Estany et al. (2002) observed that, in the lines of Landrace pigs, a line selected for bigger litter size had thicker subcutaneous backfat than a random mating control line. However, no such typical trend was found in our study populations by the differences among breed groups. Even if direct comparisons between breed groups are not possible because of no connectedness between them, Duroc pigs had almost similar but a little longer DAYS90 and a little thicker BF than Yorkshire pigs. Landrace pigs tended to have longer DAYS90 and thicker BF than Yorkshire or Duroc pigs, which might somehow support the evidence of maternal breed selection for bigger litter size as was found out of the experiments of Estany et al. (2002). However, Petry et al. (2004) could not find any strong evidence of correlated responses in growth performance or in carcass characteristics as responses to selection for litter size. Therefore, paternal or maternal breed differences weekly observed in our study populations cannot be understood as differences in the directions of selection by breeds.

Solutions and least squares means for the fixed effects from least squares models
Variance components
Genetic parameter estimates in Table 3 show that days to 90 body weight (DAYS90) or pork yield predictor traits, BF, EMA and RCP estimated from ultrasound scanners are all moderately to highly heritable similar to the values in the literature (Chen et al., 2002; Noguera et al., 2002; Kim et al., 2004; Arrango et al., 2005). Hicks et al. (1999), on the other hand, reported much higher heritability estimates (0.43 for ADG and 0.69 for BF) in Japanese Large White population. Suzuki et al. (2006) reported higher heritability estimates in Duroc pigs; 0.51 for ADG, 0.48 for EMA and 0.73 for BF when they measured pigs at around 105 kg body weight and scanned with B-mode. Heritability estimates of Li and Kennedy (1994)’s in Canadian populations were lower for days to 100kg body weight (0.26 to 0.32) and higher for back fat thickness (0.50 to 0.55) than the results from our studies. The heritability estimates in this study were similar among three breed groups.
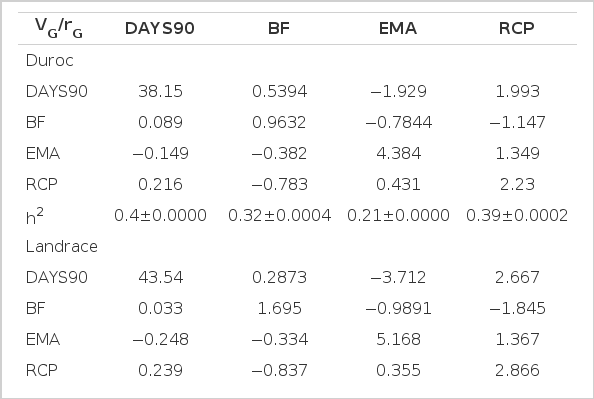
Genetic variances (diagonals), covariances (above diagonals), heritability estimates (h2±SE) and genetic correlation coefficients (below diagonals)
BF’s in all three breeds were lowly but positively correlated genetically or environmentally with DAYS90. However, in the study results of Kim et al. (2004), who estimated parameters in a Korean company, a subpopulation of our study populations showed negative genetic and phenotypic correlation between these two traits in all three breeds (Duroc, Landrace and Large White) as similar to the estimates by Li and Kennedy (1994) in Canadian populations. In the report of Chen et al. (2002), the genetic and phenotypic correlations between days to 113.5 kg and backfat thickness were estimated all to be negative but close to zero with STAGE test data for all breeds. Genetic correlation between BF and EMA were all moderate and negative, which was in agreement with the estimates by Chen et al. (2002). However, the genetic correlation between EMA and DAYS90 were all high and negative, which again controvert to the estimates by Chen et al. (2002) whose estimates were low but positive. This contradiction in correlation structure between DAYS90 and ultrasound measures of BF or EMA would be the difference in linear adjustment of ultrasound, which, in our case, no prior adjustment was applied instead of using body weight as a covariate in the estimation models. RCP estimated from ultrasound was positively correlated genetically with DAYS90 or with EMA and negatively correlated with BF in all breeds.
Environmental correlation coefficients shown in Table 4 were similar to genetic correlation coefficients (Table 3) in direction of association between traits. But the environmental correlation coefficients between BF and EMA (−0.016 to −0.115) or between BF and RCP (−0.277 to −0.363) were estimated to be much smaller in magnitude than genetic correlation coefficients between those (−0.334 to −0.382 between BF and EMA, and −0.783 to −0.851 between BF and RCP). This is supportive of the idea that RCP, that is predicted from ultrasound scanned values of backfat thickness and eye muscle are, is mostly determined by the genetic potential of BF. And EMA or RCP are more associated with genotypes of BF than with feeding environments. Genotypes of EMA or environmental effects on EMA are positively affecting RCP but as much as those of BF.

Environmental variances (diagonals), covariances (above diagonals), and environmental correlation coefficients (below diagonals)
Genetic trends
Genetic trends described as average breeding values over the years of births in three major breeds studied are illustrated in Figure 1 along with average inbreeding coefficients (aveF). Average inbreeding coefficient tended to rise rapidly from around 1998. But it became rather stable from 2000 to 2011 with a big drop in 2004 especially in Duroc herds. This might indicate a possible explanation that most Duroc seed stock farmers had replaced boars with imported ones once for every five years by the year 2004. Among the traits evaluated, it seems that selection of boars and gilts of all three breeds had been made towards larger EMA. Genetic potential for DAYS90 tended to increase by around year of birth 2000, which is an unfavorable direction in terms of daily body weight gain or feed efficiency. But then after, DAYS90 tend to decrease sharply. Genetic potential of Duroc herds for BF tended to decrease and that for RCP tended to increase especially the generations of pigs born from 2000. However, in Landrace or Yorkshire herds, genetic potentials for BF tend not to change, but those of RCP tend to increase steadily from generations born from early 1990’s. These genetic changes seem to follow the similar pattern to the trend in average inbreeding coefficients.
Genetic trends of days to 90 kg and ultrasound traits(scales on left vertical axis) with average inbreeding coefficients (aveF, scales on right vertical axis) by the year of births(BF = average EBV of backfat thickness; DAYS90 = average EBV of days to 90 kg body weight; EMA = average EBV of eye muscle area; RCP = average EBV of retail cut percentage).
In our study, BF was modeled with linear covariate function of final body weight along with the other ultrasound scanned measure traits (EMA and RCP) while BF was pre-adjusted for body weight already. But still significant amount of variation due to regression term of body weight was left. Partial regression of BF on body weight was negative for all breed groups. And the genetic and environmental correlation coefficients between DAYS90 and BF were all positive, different from literature estimates. This might indicate that pre-adjustment of ultrasound backfat measure for body weight at the time of measure was not enough to adjust for differential growth of pigs around the test end day. Negative partial regression coefficients of BF on body weight mean that pigs weighing heavier than average tend to have thinner backfat. This is also implied by the positive genetic correlation between DAYS90 and BF shown from our study even if the correlation coefficients were small near zero. A possible explanation to the genetic correlation structure between traits is that pigs by the end day of performance test weighing around 90 kg were immature to show fat growth. However, significance of partial regression of BF on body weight implies that there are still considerable individual variations with regards to differential body growth.
Acknowledgements
This study was funded by a research project (Project ID: PJ008453, Title: Research on the National Livestock Resource Evaluation and Breeding System) of Rural Development and Administration (RDA), Korea. Authors also thank members of Korea Animal Improvement Association of their efforts in collecting performance data and database management.