Comparison of Quality Traits of Meat from Korean Native Chickens and Broilers Used in Two Different Traditional Korean Cuisines
Article information
Abstract
With the aim of investigating the differences in the quality traits between Korean native chicken (Hanhyup, KNC) and broilers commonly used in two different traditional Korean cuisines, the chemical composition and sensory properties of breast and thigh meat from the two chicken strains were assessed. KNC for baeksuk (chicken meat braised in soup with various Oriental medicinal plants; KNL), KNC for samgyetang (similar to baeksuk but young chickens and ginseng are used; KNS), broiler for baeksuk (BL), and broiler for samgyetang (BS) were used as treatments in this study. KNL and KNS contained higher protein but lower fat content than BL and BS. The L* values of breast and thigh meat, but not the a* values, were significantly different between KNS and BS, whereas significant differences in both values were observed between KNL and BL. Compared to the other three types of chickens, KNS contained the highest total and insoluble collagen content, and KNL and BL showed higher inosine-5’-monophosphate content in their meat. Overall, KNL and KNS contributed darker, less tender meat with higher protein and less fat content together with more n-3 fatty acids, as opposed to their counterparts used for the same cuisines. Based on the results of the sensory analysis, even though there are some differences in physiochemical traits, different chicken sources do not differ in overall sensory quality. This information can help consumers to understand better the meat available for their preferred traditional cuisines.
INTRODUCTION
In Asian countries, including South Korea, relatively small amounts of meat or meat products were included in the diets of consumers in the past; their diets mainly consisted of grains and vegetables. However, with the rapid economic growth and globalization of the food industry, the amount of meat production and consumption has grown rapidly in these countries in recent years (Nam et al., 2010). In addition to its relatively cheaper price, several other factors make chicken meat superior to red meat. Such factors include its health benefits, because it contains less fat and cholesterol; easy to handle portions; and less religious barriers (Jaturasitha et al., 2008). Accordingly, per capita consumption of chicken meat has increased approximately five-fold during the last four decades in Korea (Liu et al., 2012).
However, with the increasing demand for chicken meat, farm households tend to produce more broilers, especially on a large scale, because they can be sent to the market within 5 to 6 wk, providing more economic benefits (Choe et al., 2009). As a result, the global chicken meat industry has been based on only a few fast-growing broiler strains produced by commercial breeding companies under intensive fattening systems (Jaturasitha et al., 2008), and indigenous chicken breeds have been neglected.
In Korean dishes, chicken is often served roasted or braised with vegetables or in soups. Two of the most well-known cuisines are samgyetang and baeksuk that are traditionally prepared using young and mature native chickens, respectively, braised in a soup with various Oriental medicinal plants, and eaten especially during the summer time to overcome heat (Nam et al., 2010). Typically, native chicken meat in different countries has a unique taste and texture (particularly after cooking) that attracts domestic consumers to a greater extent than the meat from commercial broilers (Wattanachant et al., 2004). As a result, Korean consumers have become increasingly interested in Korean native chickens (KNC) because of their characteristic flavor and texture. However, compared to commercial broilers, traditional KNC have not been produced in sufficient numbers to meet the consumer demand because of their poor commercial performances, including lower growth rates, poor feed efficiency, and lower lean-muscle gaining ability (Jeon et al., 2010).
Little is known about the meat characteristics of some KNC breeds, such as Hanhyup, used in traditional Korean cuisines. Their unique taste and texture in comparison with those of broilers have yet to be clearly evaluated via scientific analyses, and there is a clear need to elucidate the physicochemical factors that influence the taste and texture of these chickens and their contribution towards each cuisine. Therefore, the principal objective of this study was to determine the diversity of quality traits of meat from KNC (Hanhyup) and broilers used for traditional Korean cuisines, mainly samgyetang and baeksuk, and to identify the unique characteristics contributed by each type of chicken to the specific dish.
MATERIALS AND METHODS
Sample preparation
KNC aged 12 wk (KNL) and 7 wk (KNS), and broilers aged 5 wk (BL) and 3 wk (BS) were used as treatments in this study. KNL and BL were used for the preparation of baeksuk (chicken meat braised in soup with various Oriental medicinal plants) whereas KNS and BS were used for samgyetang (similar to baeksuk but using young chickens and ginseng). Ten birds from each type of chicken were purchased from a local market (N mart, Daejeon, Korea) and stored in a freezer at −80°C until further use. Breast and thigh meat from half of each bird were dissected after chilling at 4°C for 24 h, and they were trimmed of visible skin, fat, and connective tissues. The dissected breast and thigh meat were then minced separately for the chemical analyses. The remaining half of each bird was used for sensory analyses.
Analysis of physiochemical properties
Proximate composition: The proximate composition of breast and thigh meat of each bird was determined as outlined by AOAC (1995). Briefly, moisture content was measured by drying the samples (2 g) at 102°C for 15 h. Crude fat and crude protein contents were measured by the Soxhlet extraction system (TT 12/A, Gerhardt Ltd., Germany), and the Kjeldahl method (VAPO45, Gerhardt Ltd., Germany), respectively.
pH value: pH of breast and thigh meat from each bird was measured using a pH meter (750P, Istek Co., Korea) after calibration using buffers (pH 4.01, 7.00, and 9.21) at room temperature according to the method described by Jung et al. (2011). The mean value of three repeated measurements from each sample was used.
Water-holding capacity: Water-holding capacity (WHC) was determined according to the method of Ryoichi et al. (1993). Two grams of the mined sample was wrapped on a round filter paper (No. 4, Whatman Ltd. Kent, UK), subsequently placed into a centrifuge tube and centrifuged (CR 20B2, Hitachi Koki Co., Ltd. Fukuoka, Japan) at 6,710×g for 10 min. The released water absorbed into the filter paper was weighed and calculated as a percentage of the initial moisture of meat.
Color values: The color values of breast and thigh meat were measured on the surface of meat samples using a colorimeter (Spectrophotometer, CM-3500d, Minolta, Japan) which was calibrated against a black and a white reference tile. The values of lightness (CIE L*), redness (CIE a*), and yellowness (CIE b*) were obtained using the average value of three repeated measurements taken from different locations on the meat surface. Each color value was analyzed by Spectra Magic Software (Minolta Inc., Japan).
Total and insoluble collagen contents: The total collagen content of each sample was determined by acid hydrolysis as described by Palka (1999). The sample (500 mg) was hydrolyzed with 25 ml of 6 M HCl at 110°C for 24 h. The hydrolysate was filtered, neutralized with 10 M and 1 M NaOH, and diluted with distilled water to a final volume of 250 ml. Hydrolysate (4 ml) and 2 ml of chloramine T solution (1.41 g of chloramines T, 10 ml of distilled water, 10 ml of n-propanol, and 80 ml of citric buffer at pH 6.0) were mixed in a test tube and allowed to stand for 20 min at room temperature. Then, 2 ml of 4-dimethyl-aminobenzaldehyde solution (10 g of p-DABA, 35 ml of HClO4-60%, and 65 ml of isopropanol) was added and the solutions were shaken and heated at 60°C for 20 min. The samples were then cooled for 5 min in tap water and the absorbance was measured at 558 nm using a spectrophotometer (DU 530, Beckman Instruments Inc., USA). The amount of hydroxyproline was determined by comparison with a standard curve. The total collagen content (mg of collagen per g of meat) was calculated from the hydroxyproline content using a coefficient of 7.25.
Soluble collagen was extracted according to the method of Liu et al. (1996). First meat samples (2 g) were homogenized with 8 ml of 25% Ringer’s solution. The homogenates were heated at 77°C for 70 min and centrifuged at 2,300×g at 4°C for 30 min. The extraction was repeated twice and the sediment was then hydrolyzed with 6 M HCl at 110°C for 24 h. The hydroxyproline content of the sediments was determined and the insoluble collagen content was calculated as described previously.
Nucleotide content: The meat samples (5 g each) were mixed with 25 ml of 0.7 M perchloric acid and centrifuged at 1,130×g for 1 min to extract nucleic acids. The extracted nucleic acids were centrifuged at 2,090×g for 15 min and then filtered through a filter paper (No.4, Whatman International Ltd. USA). The supernatant was then adjusted to pH 7.0 with 5 N KOH. The pH-adjusted supernatant was placed into a volumetric flask and made up to 100 ml with 0.7 M perchloric acid (pH 7.0). After cooling for 30 min, the supernatant was centrifuged at 1,130×g (0°C) and then filtered through a 0.2 μm PVDF syringe filter (Whatman International Ltd.). The filtrate (5 ml) was analyzed using HPLC (ACME 9000, Younglin Instruments Inc, Korea). For the analytical conditions of the HPLC, Waters-Atlantis dC18 RP column (4.6×250 mm, 5 μm particles, Waters Co., USA) was used. Mobile phase was 0.1 M triethylamine in 0.15 M acetonitrile (pH 7.0). The flow rate of the mobile phase was 1.0 ml/min and the injection volume was 10 μl. The column temperature was maintained at 35°C and the detection was monitored at a wavelength of 260 nm. The peaks of the individual nucleotides were identified using the retention times for standards: hypoxanthine, inosine, inosine-5’-monophosphate (IMP), adenosine-5’-monophosphate (AMP) (Sigma, USA), and the concentration was calculated using the area for each peak.
Fatty acid composition: Fatty acid composition was analyzed by the original method of Folch et al. (1957) with some modifications done by Jung et al. (2010). Lipids were extracted from breast and thigh meat by mixing meat samples (10 g) and 50 ml of Folch solution (chloroform: methanol = 2:1). To this solution, 0.88% KOH was added, followed by vigorous mixing while capped and incubation at room temperature for 2 h. Then, the upper layer was removed, and chloroform was evaporated using N2 gas (99.999%). After cooling, 1 ml of methylating reagent (BF3-methanol, Sigma Chemical Co., USA) was added to 100 μl of lipid, which was heated at 70°C for 30 min. The samples were removed from the water bath and allowed to cool, after which 2 ml of hexane (HPLC grade) and 5 ml of distilled water were added to the samples. The samples were then vortexed and the upper layer removed. The fatty acid methyl ester dissolved in hexane was transferred to a GC vial. Fatty acid composition was analyzed using a gas chromatograph (GC 6890N, Agillent, USA) equipped with a mass selective detector. A split inlet (split ratio, 50:1) was used to inject samples into a HP-5MS capillary column (30 m×0.25 mm×0.25 μm film thickness, Agillent, USA). The ramped oven temperature was 150°C for 3 min, increased to 180°C at 2.5°C/min and maintained for 5 min, and increased to 220°C at 2.5°C/min and maintained for 25 min. Inlet temperature was 210°C and the detector temperature 250°C. Helium was the carrier gas at constant flow of 0.7 ml/min. The temperature of the mass spectrometer (MS) source, MS quadrupole, and transfer line into the MS were 230, 150, and 280°C, respectively. The fatty acid composition was identified by a mass spectrum database (NIST Library, mass spectral search program, version 5.0, USA).
Sensory evaluation
The panel consisted of seven trained assessors who had previous experience in assessing KNC and broiler meat. Breast and thigh meat were heated in a pot of water (1.5 times the weight of chicken meat) until an internal temperature of 85°C reached. During the process, breast and thigh meat were heated for 1 h with maximum heat being applied for 30 min then minimum heat being applied for 30 min. Breast and thigh meat samples (2.0×3.0×1.5 cm) were then placed on coded white dishes and served with drinking water. Soup (20 ml) from each sample was also served to each panelist. Samples were evaluated using a 9-point hedonic scale (1 = unlike extremely, 5 = like moderately, 9 = like extremely). The sensory parameters tested were color, flavor, taste, tenderness, chewiness, and overall acceptability for cooked meat whereas tenderness and chewiness were not included in the analyses of soup. All samples were labeled with random 3-digit numbers and presented to panelists in random order. Whole sensory analysis was repeated for three times.
Statistical analysis
Analysis of variance was conducted by the procedure of General Linear Model using SAS program version 9.1 (SAS, 2002, SAS Institute, Cary, NC, USA). Comparisons of means were analyzed by Duncan’s multiple range tests at p<0.05.
RESULTS AND DISCUSSION
Proximate composition
The proximate composition of breast and thigh meat of Korean native chicken (Hanhyup; KNC) and broilers is presented in Table 1. In breast and thigh meat, KNC contained a higher (p<0.05) percentage of protein but a lower fat and moisture contents than broilers. However, there was no difference in protein content between KNL and KNS for both meat portions (p>0.05). Further, this parameter was not different between the breast meat of BL and BS (p>0.05), whereas BS showed a higher protein content in thigh meat than BL (p<0.05). Previous studies have reported that the protein content of broiler pectoralis muscle ranged from 22.6% to 24.7% (Smith et al., 1993; Qiao et al., 2002), and the protein content observed in this study was within this range. Choe et al. (2010), Jung et al. (2011), and Lee et al. (2011) compared the quality of fresh commercial KNC and broilers and reported no difference (p>0.05) in crude protein content in breast and thigh meat.
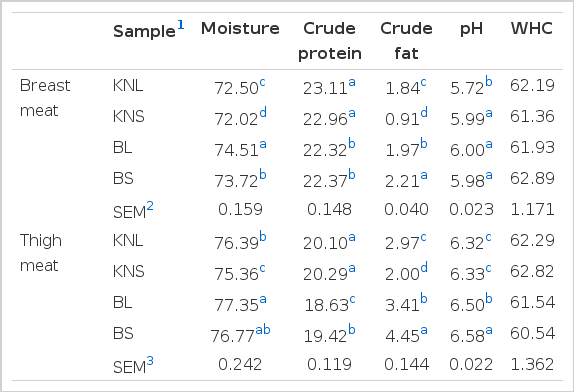
Proximate composition (%), pH, and water-holding capacity (WHC; %) of breast and thigh meat of Korean native chicken (Hanhyup) and broiler
Regarding fat content, significant differences were found among all four groups for both meat portions. The highest fat content was recorded in BS for breast and thigh meat (2.21% and 4.45%, respectively), whereas KNS recorded the lowest values for both meat portions (p<0.05). Similar results have recently been observed, where broilers had a higher fat content in both meat portions than KNC (Young and Choi, 2003; Lee et al., 2011). Choe et al. (2010) and Jung et al. (2011) suggested the relatively low fat content of the KNC meat to be a unique compositional characteristic. Thai indigenous chicken also contained a lower fat content than broilers (Wattanachant et al., 2004). In addition, Ji et al. (2007) revealed that older birds had more fat in the meat than the younger birds. In this study, however, broilers had more fat in the meat than the older slow-growing birds. This confirms that the genotypic effect on fat deposition could go beyond age influence in some cases (Tang et al., 2009).
In general, differences in moisture content were observed among all four types of chicken (p<0.05; Table 1). For both portions of meat, the highest and lowest moisture contents were observed in BL and KNS, respectively. However, Lee et al. (2011) demonstrated that the moisture content of leg meat was higher in KNC than in broilers (p<0.05), whereas no difference (p>0.05) was observed between both portions of meat by Choe et al. (2010) and Jung et al. (2011).
pH and water-holding capacity
In terms of the pH of breast meat, KNL showed lower values than all other types of chicken investigated in the present study (p<0.05; Table 1). The pH values of thigh meat, in general, differed among the types of chicken used, except KNL and KNS (p<0.05). The highest pH value was observed in the thigh meat of BS. Overall, KNC showed lower pH values than broilers in both portions of meat; this finding is in agreement with the reports of Jeon et al. (2010) and Lee et al. (2011). Furthermore, Jung et al. (2011) also showed similar results, although only for the thigh meat of KNC and broilers at the commercial stage, whereas Choe et al. (2010) found the same trend but only for the breast meat. Sung et al. (2000) compared the meat characteristics of KNC and a dual-purpose breed (Wangchoo) and explained that the pH of leg meat decreased with increasing age, regardless of the strain, and similar results could be observed in this study for thigh meat. Differences in pH values among the types of chicken investigated may be attributed to the pre-slaughter stress, which changes muscle glycogen content and eventually has an effect on the rate and extent of pH decline (Berri et al., 2007). Because ultimate pH is considered to be the main factor that affects all quality attributes, including color (Dadgar et al., 2011), observed changes in pH values may affect the quality attributes.
Huff-Lonergan and Lonergan (2005) explained that early postmortem events, including the rate and extent of pH decline; proteolysis; and even protein oxidation, affect the ability of meat to retain moisture. A trend was found by Tang et al. (2009) in their study, in which WHC was lowest for fast-growing broilers (Avian and Lingnanhuang) and highest for Chinese native breeds (Wenchang and Xianju). However, as shown in Table 1, the WHC values measured in the breast and thigh meat were not different (p>0.05) among the four types of chicken in this study. In addition, no differences (p>0.05) in WHC were noted between the two chicken strains KNC and broiler by other researchers (Choe et al., 2010; Jung et al., 2011; Lee et al., 2011).
Surface meat color
With regard to color values, the L* values of breast and thigh meat were different (p<0.05) among the types of chicken used, except KNL and BS for breast meat and BL and BS for thigh meat (Table 2). KNL had higher L* and a* values in breast meat than BL, whereas the L* value of thigh meat was higher in BL than in KNL (p<0.05). A previous study confirmed that the L* values, but not the a* and b* values, of KNC breast were higher than those of the broilers (Choe et al., 2010). Further, Jung et al. (2011) demonstrated that the lightness value of KNC thigh was lower (p<0.05) than that of CB in all the tested production stages, whereas no difference (p>0.05) in the L* value of breast and leg meat between KNC and broilers was observed by Lee et al. (2011).
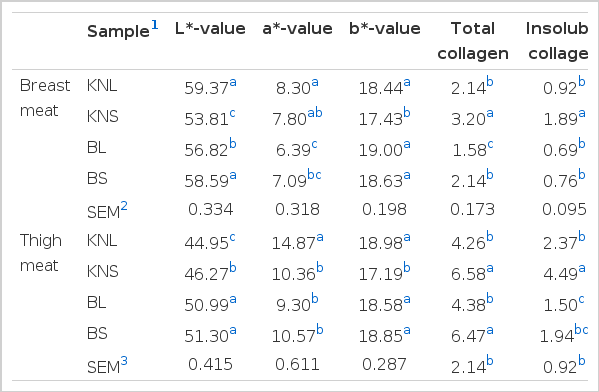
Surface-meat color, total collagen content (mg/g) and insoluble collagen content (mg/g) of breast and thigh meat of Korean native chicken (Hanhyup) and broiler
Swatland (2008) explained that low-pH chicken breasts had the highest reflectance (p<0.001), whereas high-pH chicken breasts had the greatest transmittance into their tissues and across individual muscle fibers (p<0.001), which is associated with darker meat (Fletcher, 1999). Similarly, Petracci et al. (2004) reported that pH was negatively correlated with lightness in turkey and chicken breast meat, respectively. Thus, the brighter color of KNL breast meat can be attributed to a relatively low pH value. The darker color of thigh meat from all chicken types as opposed to breast meat can be attributed to their higher contents of red fibers with greater myoglobin levels (Barbut, 2002) and to higher pH values (Petracci et al., 2004).
In addition, KNL possessed the thigh meat with the highest a* value among all types of chicken. The L* values of breast and thigh meat, but not the a* values, were different (p<0.05) between KNC and broilers used for samgyetang. In contrast, KNS expressed lower b* values for breast and thigh meat than the other types of chicken. In general, the broiler meat investigated in this study had the expected levels of lightness and reduced red color compared with KNC meat with respect to both portions of meat. This difference in meat color can be used to distinguish the origin of chicken strains (Jeon et al., 2010).
An important factor that influences consumer preference for meat is the color difference. Therefore, the characteristic differences in meat color between KNC and broilers may influence consumer preference when they are used to make the same dish. According to Fletcher (1999), various factors, including heme pigments, genetics, and feeding, can affect the color of meat. The present study confirmed the presence of a strong genetic influence on meat color.
Total and insoluble collagen contents
In general, total collagen content in breast meat was different (p<0.05) among the types of chicken investigated during this study (Table 2). The highest total collagen content in thigh meat was found in KNS and BS; this was different (p<0.05) from the content observed in KNL and BL. Similar trends were observed in the breast meat as well. Jeon et al. (2010) reported that KNC contained much higher total collagen levels (p<0.05) than broilers in both breast and thigh meat. Furthermore, Jaturasitha et al. (2008) confirmed that Thai indigenous chickens had higher values (p<0.05) with respect to total and insoluble collagen content in thigh meat. The different collagen content in chicken meat influences the texture and tenderness characteristics of the meat (Jeon et al., 2010). In this regard, Wattanachant et al. (2004) confirmed that the texture of commercial broilers was more favorable than that of indigenous strains. Conversely, commercial Korean native chickens were preferred by Korean consumers to broilers, mainly because of their unique texture generated from higher cohesiveness, chewiness, and gumminess (Choe et al., 2010).
The insoluble collagen content of breast meat in KNS was higher than that observed in the other three types of chicken. In addition, the same parameter in thigh meat differed (p<0.05) among almost all types of chicken, where the highest value was again observed in KNS. It was shown that the older Chinese native breeds of chicken (Wenchang and Xianju; age, 112 d) had higher shear force than the fast-growing broilers Avian (age, 49 d) and Lingnanhuang (age, 56 d), mainly because of the differences in collagen cross-linking (Tang et al., 2009). Similarly, KNC had a higher insoluble collagen content than the broilers in this study. Although it had been demonstrated that collagen cross-linking increases with age (Fletcher, 2002), the data obtained in the current experiment did not concur with that trend.
According to the results presented here, it can be suggested that KNS and BS, in general, contribute less tender meat for samgyetang, and KNL and BL provide more tender meat for baeksuk. In the present study, the birds had been killed at different ages, and therefore, the difference in collagen content can mainly be attributed to the effect of genotype and age differences at the time of death (Dawson et al., 1991).
Nucleotide content
As shown in Table 3, BS showed lower (p<0.05) AMP content in breast and thigh meat than the other types of chicken. In contrast, KNL and KNS had higher (p<0.05) AMP content in their thigh meat. However, no differences (p>0.05) in the AMP content of thigh meat were reported between KNC and broilers by Jung et al. (2011). Inosine content of breast meat was higher (p<0.05) in BL and BS than in KNL. However, only BL showed a remarkably higher value (p<0.05) for the same parameter with respect to the thigh meat. In a previous study, the inosine content of thigh meat was lower in KNC than in broilers (Choe et al., 2010; Jung et al., 2011). Higher IMP content (p<0.05) could be observed in the breast meat of BL than in the chicken used for samgyetang. KNL also contained higher IMP levels, although the difference was not significant. However, KNL reported higher (p<0.05) IMP content in thigh meat than BS; this is similar to the findings of Jung et al. (2011). Further, Ahn and Park (2002) reported that the concentrations of IMP in meats from 15-wk old KNC were higher than those in meats from 6-wk old broilers. Rikimaru and Takayashi (2010) also reported that the thigh meat from Hinaijidori (age, 22 wk) had higher IMP content than that from broilers (age, 8 wk), when the same environmental conditions were provided.
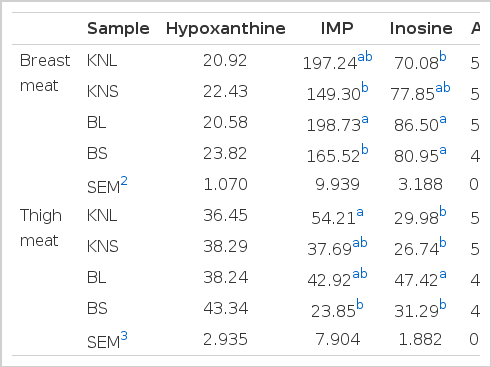
Nucleotide content (mg/100 g) of breast and thigh meat of Korean native chicken (Hanhyup) and broiler
However, there was no difference (p>0.05) in the hypoxanthine content of breast and thigh meat among the four types of chicken. A study by Choe et al. (2010) revealed no differences (p>0.05) in AMP, IMP, and hypoxanthine contents between KNC and broiler meat.IMP is considered as one of the main flavor precursors in meat (Zhao et al., 2012), which is used in conjugation with monosodium glutamate for a synergistic effect (Manabe et al., 1991). Therefore, the results of this study suggest that BL may have a desirable flavor because of higher IMP and inosine contents, which might have resulted in a superior taste score than that for the other chicken types in the sensory test. However, when the types of chicken for similar cuisine (i.e., KNL vs BL and KNS vs BS) were compared, there was no difference (p>0.05) in IMP content among them. Hence, it can be suggested that no changes in sensory attributes occur, even when KNC meat is replaced by broiler meat in samgyetang and baeksuk.
Fatty acid composition
Higher saturated and monounsaturated fatty acid contents (p<0.05) were found in breast and thigh meat of BL than in other types of chicken (Table 4). In contrast, the polyunsaturated fatty acid content of breast and thigh meat, including essential fatty acids such as linoleic acid (C18:2) and arachidonic acid (C20:4), were higher (p<0.05) in KNC than in the other two types of broilers for both meat portions. Compared to broilers, KNL and KNS expressed higher levels of eicosapentaenoic acid (EPA; C20:5) and docosahexaenoic acid (DHA; C22:6), respectively, which are known to be n-3 fatty acids. Sung et al. (2000) have reported that chicken meat contained oleic acid (C18:1), palmitic acid (C16:0), and linoleic acid (C18:2) as the major fatty acids; this finding was in agreement with the results presented here.
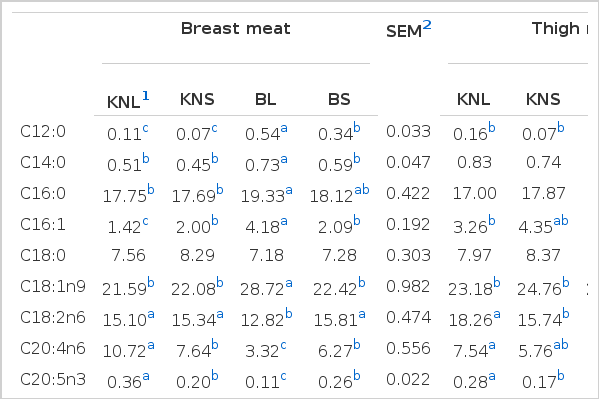
Fatty acid composition (%) of breast and thigh meat of Korean native chicken (Hanhyup) and broiler
Similar to the results of the present study, commercial broiler meat was observed to contain higher (p<0.05) palmitoleic acid (C16:1) and oleic acid (C18:1) contents than KNC (Jeon et al., 2010; Jung et al., 2011). Together with the results of Choe et al. (2010), those reported by Jeon et al. (2010) and Jung et al. (2011) further confirmed that KNC showed higher (p<0.05) content of arachidonic acid than commercial broilers. A Japanese native chicken breed, Hinaijidori, also showed higher (p<0.05) arachidonic acid and DHA content than broilers in thigh meat (Rikimaru and Takahashi, 2010; Takahashi et al., 2012). Since essential fatty acids should be provided as a dietary supplement because of the inability of biogeneration in the body (Cho et al., 2008), the higher arachidonic and linoleic acid contents of KNC can be an attractive nutritional quality trait for health-conscious consumers. This is further strengthened by higher levels of EPA and DHA present in the meat.
In a comparison of the types of chicken used in different cuisines, it was noted that there were no differences (p>0.05) in fatty acid content between chickens used for samgyetang, except for lauric acid (C12:0) and DHA (C22:6). However, the trend is the opposite for chickens used for baeksuk, where KNL showed higher polyunsaturated fatty acid content but lower saturated and monounsaturated fatty acid contents than BL.
Sensory evaluation of breast meat, thigh meat, and soup
Table 5 shows the results of the sensory characteristics of breast meat, thigh meat, and soup from the different types of chicken studied. Although the color and flavor of breast meat did not differ (p>0.05) among the different types of chicken, sensory panelists preferred the color, flavor, taste, and chewiness of thigh meat (p<0.05) from KNS than the thigh meat from other types of chicken. Similar to thigh meat, breast meat from KNS showed a higher (p<0.05) sensory score for chewiness. Although the color evaluation revealed that KNC was darker and redder (p<0.05) than broilers (Table 3), sensory evaluation data showed no difference (p>0.05) between KNC and broiler meat for color preference. This may suggest that the color difference between KNC and broiler meat does not affect consumers’ sensory perception after cooking. However, sensory characteristics, including color, odor, taste, texture, chewiness, and overall acceptance, did not differ substantially between KNC and broilers during a study conducted by Choe et al. (2010). It was reported by Jeon et al. (2010) that the color preference for North Korean native chicken was lower (p<0.05) than that for South Korean native chicken (SKNC) and broilers with respect to thigh meat. However, there were no differences between SKNC and broiler thigh meat, and finding was consistent with the results of the present study. In the study by Jeon et al. (2010), texture, taste, odor, juiciness, and overall acceptance did not differ (p>0.05) among samples. In addition, the chewiness of breast and thigh meat was not different (p>0.05) between KNC and CB (Jeon et al., 2010; Lee et al., 2011). However, Jung et al. (2011) described that sensory panelists gave higher scores for color, but lower scores for odor, taste, and overall acceptance, for broiler thigh meat than that from KNC. In addition, the chewiness of thigh meat was observed to be higher (p<0.05) in KNC than in broilers, which is similar to the chewiness data obtained in this study.
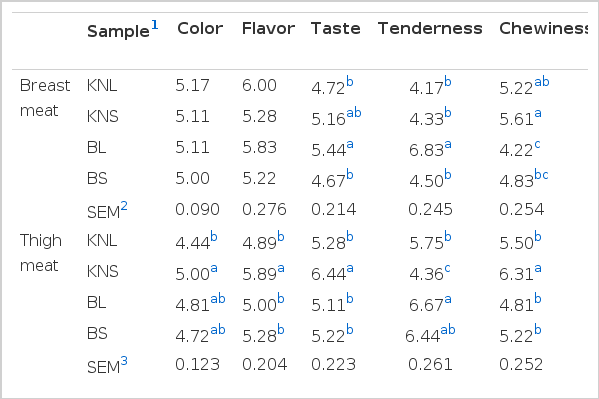
Sensory evaluation of breast meat, thigh meat, and soup of Korean native chicken (Hanhyup) and broiler
BL was observed to have the highest values for taste and tenderness of breast meat. Higher levels of taste in BL breast meat can be attributed to the greater IMP and inosine contents found in this meat (Table 3). The synergistic effect of higher taste and tenderness values led BL to having the highest sensory score for overall acceptability as well. The effect of the lower tenderness value of KNS (p<0.05) than that of BL on overall acceptability of thigh meat was overcome by the higher sensory scores (p<0.05) achieved for color, flavor, and taste by KNS; this eventually resulted in KNS having a higher overall acceptability characteristic. The higher tenderness values of BL breast and thigh meat can be attributed to the lower content of total and insoluble collagen in these meats (Table 2). Fletcher (2002) described that collagen cross-linking, which increases with age, is generally associated with increased toughness. The only sensory parameter of soup that showed a difference (p<0.05) among the types of chicken tested was the color, where KNL and BL expressed higher values as opposed to the other two types of chicken.
CONCLUSIONS
In general, KNS contributed less tender, darker meat with more protein, less fat, and a higher overall acceptability score for samgyetang than BS. The characteristics provided by KNL and BL for baeksuk were the same as that provided by KNS and BS, respectively. However, the overall acceptability did not differ between KNL and BL meat. Further, KNL and KNS provided more polyunsaturated fatty acids, including n-3 fatty acids, whereas BL and BS supplied more saturated fatty acids to the respective cuisines. Based on the results of this study, it can also be suggested that different chicken sources for traditional cuisines have some characteristic physicochemical traits, but they do not vary in overall sensory quality. This information can help consumers to understand their preferred traditional cuisines.
Acknowledgements
This work was carried out with the support of “Cooperative Research Program for Agriculture Science & Technology Development (Project No. PJ90701104)”, Rural Development Administration, Korea.