Comparison of Mathematical Models Applied to F1 Dairy Sheep Lactations in Organic Farm and Environmental Factors Affecting Lactation Curve Parameter
Article information
Abstract
The objective of this study was to compare the goodness of fit of four lactation curve models: Wood’s Gamma model (WD), Wilmink (WL), and Pollott’s multiplicative two (POL2) and three parameters (POL3) and to determine the environmental factors affecting the complete lactation curve of F1 dairy sheep under organic management. A total of 5,382 weekly milk yields records from 150 ewes, under organic management were used. Residual mean square (RMS), determination coefficients (R2), and correlation (r) analysis were used as an indicator of goodness of fit for each model. WL model best fitted the lactation curves as indicated by the lower RMS values (0.019), followed by WD (0.023), POL2 (0.025) and POL3 (0.029). The four models provided total milk yield (TMY) estimations that were highly correlated (0.93 to 0.97) with observed TMY (89.9 kg). The four models under estimated peak yield (PY), whereas POL2 and POL3 gave nearer peak time lactation estimations. Ewes lambing in autumn had higher TMY and showed a typical curve shape. Higher TMY were recorded in second and third lambing. Season of lambing, number of lambing and type of lambing had a great influenced over TMY shaping the complete lactation curve of F1 dairy sheep. In general terms WL model showed the best fit to the F1 dairy sheep lactation curve under organic management.
INTRODUCTION
Milk production from sheep is an important activity in Mediterranean countries, where production is oriented to cheese manufacturing. In Latin-American countries there exists no evidence of a similar degree of development in relation to European countries (Haenlein and Werndorff, 2006).
Organic milk products are shown as an alternative to produce and many people preferentially consume dairy products from systems where animal welfare and equilibrated environmental impact are priorities (Köpke, 2003). Alongside this, the increasing demand for organic products creates an incentive for farmers to increase their farm’s profitability (Rotz, 2007). However, organic farms must comply with regulations that affect sheep’s milk production potential (Nauta et al., 2006), resulting in lower milk yields than from conventional farms (Tzouramani et al., 2011). Due to this, it is important to develop methodologies like lactation curve models to understand the associated factors limiting production and develop strategies to overcome them.
Lactation curve models can be classified as empirical and mechanistic. The first are based on milk yield records and some of the most common are Woods Gamma model (1967), Wilmink model (1987) and Grossman and Koops model (1988). The second are based on the biology mammary gland e.g., number of parenchyma cells growing and their differentiation to secretory cells, and the subsequent decreasing rate. Dijkstra et al. (1997) and Pollott (2000) models fall in this category.
Wood’s Gamma model (WD) has been the most widely used to fit lactation curves. However, inconsistencies in fitting the different stages of lactation properly are reported (Olori et al., 1999; Pollott and Gootwine, 2000). Mechanistic models are reported to outperform empirical models (Pollott and Gootwine, 2000). Milk production is affected by genetic and environmental factors; by using mathematical models of lactation, we can determine the relative importance of these environmental factors affecting curve parameters and milk yields (Pollott and Gootwine, 2000).
Limited information exists regarding complete lactation curves in dairy sheep (Dag et al., 2006; Keskin and Dag 2006). Some reports have been published using milk records from ewes under experimental conditions (Portolano et al., 1996). Perhaps Pollott and Gootwine (2000) were the first reporting dairy sheep curve characteristics using complete lactation under commercial conditions. Recently, Leon et al. (2012) have published a study using various lactation curve models in order to characterize Murciano-Granadina dairy goats using complete lactations. Apart from these few reports, to our knowledge no information exists regarding lactation curve characteristics describing the complete lactation in dairy small ruminants; much less exists from ewes under organic conditions.
The aim of this study was to compare the degree of fitness of four lactation curve models to F1 dairy sheep complete lactations under organic management, as well as to estimate the environmental factors affecting curve parameters.
MATERIALS AND METHODS
Flock management and milk records
Milk records were obtained from “Santa Marina” dairy farm, dedicated to produce mature and semi-mature sheep cheese with an organic certificate, located in Marquez Municipality in Queretaro State, Mexico (20° 31′ latitude North and 100° 24′ longitude West). Ewes were managed under a strip grazing system on mixed swards of ryegrass (Lolium multiflorum) and lucerne (Medicago sativa), supplemented with lucerne hay and corn grain at milking. Ewes were milked on the fifth day after lambing, and machine milked once daily (1200 h). Milk yield was recorded weekly on Fridays.
Pasture’s management, supplements, flock health, and reproduction were carried out following the guidelines for organic farm management.
Milk records
The original database consisted in 222 lactations of F1 ewes (father line East Friesian, mother line Pelibuey, Suffolk, and Black belly), lambing between January and December 2006. Lactations included in the analysis had the following information: ewe’s identification, lambing date, number of lambings (1st, 2nd, 3rd, 4th), type of lambing (single or twin), and the first milk yield recorded within the first month after lambing.
The final data set included 5,382 weekly milk yield records (WMYR), from 150 lactations with 33.2 weekly records average per lactation, 235 d of lactation length average, and 9.8 d averaged from lambing to first WMYR.
Calculated curve parameters
The observed total milk yield (TMY) per lactation was estimated using the Fleischmann’s method (FLS) (Ruiz et al., 2000). The general expression of the FLS method is:
Where: TMY = total milk yield per lactation, D1 = interval between lambing and first recording, Pi = yields of the record i and the record (i+1) (i = 1, …, k), and 15 = assumed number of days between the last recording and the dry-off.
Calculated TMY, peak time (PT), peak yield (PY) and persistency (Per), were estimated for each model using the mathematical functions as referred in the original papers.
Mathematical models
Four mathematical functions were used to fit lactation curves:
Wood’s gamma model (WD) (Wood, 1967):
Where: Y = milk yield at time t; a = initial milk yield; b and c are the parameters of inclining and declining slopes of lactation curve before and after the peak production, respectively
Exponential Wilmink (WL) (Wilmink, 1987):
Where a, b, and c are associated parameters with production level (a); milk production increased previous to peak (b); and decrease after peak (c) lactation. The k parameter assumes a fixed value derived from a preliminary analysis and is associated with the time at peak yield (Wilmink, 1987).
Pollott’s multiplicative two parameters model (POL2)(Pollott, 2000):
Pollott’s multiplicative three parameters model (POL3)(Pollott, 2000):
Where, Mt = milk production; MS = maximum secretion potential of the lactation; GR = relative proliferation rate of secretory cell numbers during early lactation; DR = relative decline in cell numbers as lactation progressed; t = d of lactation -150 and, a = (1-0.9999999)/0.9999999.
Pollott’s mechanistic models POL2 and POL3, are the reduced form of the original model with seven parameters, and were chosen due to the similar number of parameters as the empirical models.
The models were fitted to lactations using an iterative non-linear curve fitting procedure (NLIN) of the Statistic Analysis System (SAS, 2002). Curve parameters from each curve were estimated using the least square and the Marquardt methods in order to get the best fit solution, which was achieved when there was a less than 10−6 differences between the error sums of squares in successive iterations (Pollott and Gootwine, 2000).
Goodness of fit between models
As indicator of goodness of fit according to Pollott and Gootwine (2000), the residuals mean squares (RMS) were calculated individually for each lactation and then averaged for each of the models using the following equation:
Where: et = residual (difference between absolute values of observed milk production and estimated), in the t day of milk recorded, N = number of observations and P = number of parameters from each model.
The adjusted coefficient of determination (R2) to the number of parameters on each model was also estimated as goodness of fit according to formula Wasike et al. (2011):
Where: R2 = coefficient of determination (1-(ESS/TSS)), ESS = residual sum of squares, TSS = total sum of squares, N = sum of observations and, P = number of parameters of each model.
Correlation analyses (r) between FLS and calculated TMY were run in order to estimate the degree of association.
The GLM procedure in SAS (2002) was used in order to determine the environmental factors such as type of lambing, number of lambings and season of lambing, all affecting TMY were estimated using the following equation:
Where, Yijkl total milk yield; μ = overall mean; TLi = type of lambing (single or double); LNj = number of lambing (i = 1, 2, 3, 4); LSk = k (spring, summer, autumn, winter); and εijkl = error term.
RESULTS
Models goodness of fit
The goodness of fit statistics (RMS, R2, and r) for each model tested, are shown in Table 1. The models that better fitted curves according to the lowest RMS and higher R2 were WL>WD>POL2 and POL3. TMY by FLS and TMY by the different models were highly correlated among them, ranging from 0.95 to 0.97.
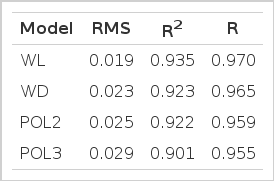
Comparison of the goodness of fit statistics: residual mean square (RMS), determination coefficient (R2), and correlation coefficient (R) of four models to describe the lactation curve of F1 ewes under organic management
Calculated parameters
Table 2 shows the curve parameters mean and standard deviation values for TMY, PY, and PT. A wide variation exists among parameters as can be observed by the size of the standard deviations (SD).

Mean and standard deviation of estimated and observed characteristics of lactation curves of F1 ewes under organic management using four lactation curve models
The average TMY by FLS was 89.9, where WL and POL3, provided the closest estimations with 1% difference above and under FLS values, respectively. Whereas, WD and POL2 over 4% and under 7%, estimated FLS values respectively.
PY was underestimated by all models with 8, 32, 32 and 43% WL, WD, POL2 and POL3, respectively. PT was closer estimated by POL2 and POL3 models, giving an underestimation of 8%; whereas WL and WD overestimated it by 41 and 43%, respectively.
Environmental factors
Table 3 shows the environmental factors affecting milk yields. TMY was higher when ewes lambed in autumn than those that lambed the rest of the seasons (p = 0.002). These ewes had a typical lactation curve showing an increasing phase, peak yields and decreasing phase (Figure 1). On the contrary, in the rest of the lambing seasons lactation curves did not present peaks, but instead progressively descended from the beginning of lactation at different rates.

Effects of lambing season, lambing number and type of lambing over mean total milk yield (kg) of F1 ewes under organic management

Different shapes of lactation curve according to the season of lambing (♦, spring; ▪, summer; ▴, autumn; ●, winter).
Twin lambing had a significantly (p = 0.005) higher TMY (12.6%) than single lambing. Higher milk yields were observed from the beginning of lactation until week 17th of lactation, when twice lambing showed higher milk yield production at the beginning of the lactation compared with single lambing (Figure 2). Lambing number (Figure 3) had a significant effect (p = 0.001) over TMY; second and third lambing ewes showed the highest milk yields, being superior around 20% to first and fourth lambing ewes. The lowest TMY was recorded for fourth lambing ewes.

Different shapes of lactation curves according to the type of lambing (♦, single; ▪, twins).

Different shapes of lactation curves according to number of lambing (♦, first; ▪, second; ▴, third and; ●, fourth).
DISCUSSION
Studies of the complete lactation curve of sheep are rare, due to the fact that on commercial dairy sheep systems, lambs stay with the ewes during the first month after lambing. This period coincides with the increase of milk from parturition to peak yield, and we have no records of milk yields within this period, making it difficult to estimate parameters from the early phase of lactation by curve models (Pollott and Gootwine, 2000).
Pollott and Gootwine (2000), tested several lactation curve models in order to study the complete lactation of Awassi sheep. Their conclusion was that Grossman and Koops (1988), Morant and Gnanasakthy (1989) and Pollott (2000) (in its additive and multiplicative forms) models outperform Wood’s model. Pollott’s models were the most accurate when using weekly instead of monthly records. The added value of Pollott’s models was that they provided parameters with a biological interpretation compared to the empirical models tested by them.
Models goodness of fit
The models of the lactation curve studied predicted TMY with a high level of accuracy judging by their RMS, R2, and r, suggesting an overall good fit to the data. The accuracy of models WD and WL were similar to that reported by Ruiz et al. (2000), who tested these models in their study. R2 values in this study from POL2 and POL3 were slightly higher than those reported by Pollott and Gootwine (2000).
Predicted TMY was overestimated by WD Gamma model (4%), which coincides with Pollott and Gootwine (2000) and Keskin and Dag (2006). Also, fitting dairy sheep curves underestimates PY as other authors have mentioned (Portolano et al., 1996; Macciotta et al., 2005), who analyzed sheep lactation curves and overestimated PT differing from those found by Portolano et al. (1996). Carta et al. (1995) and Ruiz et al. (2000) found that the WD Gamma model is not suitable for sheep within a feeding system on while grazing and Wolfavá et al. (2009) found deficiencies in milk production estimates by the WD Gamma model, especially when feed resources are limited.
Despite this, WD model was the second best according to the RMS values, implying its value as estimator of TMY. In previous studies, the accuracy of predicting TMY with different models has been shown to depend, among other factors, on the time between lambing and when the first milk yield is recorded. Consequently, their accuracy is compromised when the first record occurs between day 60 to 90 post-lambing (Silvestre et al., 2006). Or as shown by Sakul and Boylan (1992), that the underestimation of TMY was due to the fact that the first milk yield record was taken at 30 days after lambing, when the curve had already started to decline. In this study, milk recording started one week after lambing, therefore, there were enough records from early lactation before PY, explaining the good performance of the four models regarding TMY estimation.
According to the evaluation criteria set in this study, the equation proposed by Wilmink (1987) shows a better performance in terms of RMS, R2, and r, than the rest of the models applied; these data are consistent with Olori et al. (1999) who indicated a better prediction of WL model, with higher values of R2 and RMS compared with WD Gamma model, and Ünal et al. (2007) who related higher R2 values compared to other empirical models, including the WD Gamma model analyzing sheep lactations.
All the models underestimated PY, with the WL model providing the closest estimation. The good adjustment of lactation curve and close estimations of PY using the WL model are due to the substantial independence between the first and second part of lactation (low correlation between parameters b and c), which influences the number of atypical lactations detected by this model, showing higher flexibility (Macciotta et al., 2005). This situation differs from what happens to the Wood Gamma model in which there is a significant correlation (p<0.001) between the parameters, mainly between b and c (Table 4).

Parameters of lactation curves (Wood’s Gamma Model) and their correlation in organic dairy ewes system
In this study, the deficiencies of the predictions of lactation curve characteristics such as PY and PT by empirical models could be associated with (Figure 1) the difficulties of defining an atypical curve when there was an absence of PY data or on lactation close to lambing. Continuously decreasing yields from lambing to the end of the lactation curve caused b and c parameter values to be out of the biological range and created subsequent difficulty in calculating PY and PT (Pollott and Gootwine, 2000; Macciotta et al., 2005).
Atypical curves are reported to be related to low genetic merit of animals (Sakul and Boylan, 1992; Cappio-Borlino et al., 1997), as in this study, where the lactations came from a flock of ewe crosses of dairy breeds and meat breeds, which are expected to have a low production potential for milk yield and an atypical form of lactation curve. Besides this, intrinsic restrictions of organic systems such as no antibiotics and limited amount of supplements means that animals are not allowed to express their productive potential (Padel, 2000). Mechanistic models (POL2 and POL3) generated estimates of PT closest to the observed values, as well as did not overestimate TMY and PY; this coincides with Pollott and Gootwine (2000) who commented that mechanistic models have a greater power of adaptation and can be used in a wide range of situations where it is necessary to describe the lactation.
Environmental factors
A study by Carta et al. (1995) found that lambing season affected milk yield due to the low availability and low quality of forage in farms under grazing systems; similar in this study, where ewes lambing in winter, spring, and summer had lower milk yields compared to autumn, where there was a higher TMY (23.7%), which coincides with Franci et al. (1999).
Ewes lambing in autumn are pregnant during spring, when the availability of forages reaches its maximum, which has a positive effect on differentiation mammary secretory cells as well as build up body condition (Franci et al., 1999). Ewes lambing in autumn showed a typical curve (Figure 1), with an increasing phase from the setup of lactation to a peak around the sixth week, whereas the ewes lambing in a different season showed no peak, continually decreasing from the beginning of lactation. The peak yield showed by ewes lambing in autumn could be a consequence of the large availability of quality forage rather than the genetic merit of the ewes, coinciding with Walker et al. (2004).
As expected, ewes having twins yielded more milk than single lambing, agreeing with other authors (Cappio-Borlino et al., 1995; Cappio-Borlino et al., 1997). This is a consequence of ewes that carry twins during their gestation have a higher number of differentiated and active pre-lambing mammary gland cells (Cappio-Borlino et al., 1997), higher plasmatic levels of placental lactogen (Schoknecht et al., 1991; Gootwine, 2004) and a higher stimulus of mammary gland during suckling by lambs (Gabiña et al., 1993).
The placental lactogen has an influence only through the first 17 weeks of lactation (Figure 2), as observed by Gabiña et al. (1993) who reported significant differences in milk yields only during the first half of lactation. Cappio-Borlino et al. (1995) also reported higher milk yields from ewes with twins than single lambing ewes. Twin lambing ewes had higher milk yields during early lactation until peak yield and then showing no differences after the 10th lactation week from ewes with a single lambing.
Milk yield increases as number of lambings increase as mentioned by other researchers (Portolano et al., 1996), with the highest yields at the second and third lambings and descending afterwards, which coincides with Macciotta et al. (2005).
Milk production potential of the ewes from this study was lower when compared with milk yield of ewes from conventional dairy flocks, and flocks with specialized dairy breeds like the ones studied by Ruiz et al. (2000), reporting TMY ranging from 160 to 190 kg/lactation from Latxa dairy ewes; or Pollott and Gootwine (2000) reporting average yields of 506 kg from an improved Awassi flock under intensive management. However, milk yields reported in the present study agree with those of dairy sheep under organic management reported by Toro-Mujica et al. (2011), with an average of 94 kg, ranging from 68 to 125 kg; whereas Tzouramani et al. (2011) reported an average TMY of 84 kg/lactation.
Padel et al. (2000) and Rochi et al. (2003) mentioned that pasture management, control and prevention of parasitic diseases, and provision of fodder produced organically are factors that limited milk production in organic systems. Based on this, milk yield differences due to season are a result of variations of the availability and quality of fodder from the pastures grazed by ewes in this study.
Some argue that despite the higher milk yields obtained from conventional systems compared to yields from organic systems, higher yields do not justify the extra use of energy required to operate a conventional flock in comparison to an organic one (Refsgaard et al., 1998). Organic systems are an alternative to producing animal products that fulfill quality high standards, satisfying consumer’s social responsibility acquiring environmental friendly products.
CONCLUSIONS
WL and POL3 were the best at estimating TMY. However, both empirical models have difficulty calculating PY and/or PT; this due to the atypical lactation curve manifested by some animals of this study. Season of lambing, number of lambing, and type of lambing had a great influence over total milk yields shaping the lactation curve.
Acknowledgements
This Manuscript has been suported by Fundacion Produce State of Mexico, and UAEMex. Mr. J.C. Angeles was granted a CONACyT fellowship during his Master studies in the University Autonomous State of Mexico. We also thank Ing. Javier Perez Rocha M. for the facilities during the realization of the present study and Ms. Liz Hopper, LTC- University of North Texas for the critical review of the present manuscript.