Estimation of the Optimal Ratio of Standardized Ileal Digestible Threonine to Lysine for Finishing Barrows Fed Low Crude Protein Diets
Article information
Abstract
Two experiments were conducted to determine the standardized ileal digestible (SID) lysine (Lys) requirement and the ideal SID threonine (Thr) to Lys ratio for finishing barrows. In Exp. 1, 120 barrows with an average body weight of 72.8±3.6 kg were allotted to one of six dietary treatments in a randomized complete block design conducted for 35 d. Each diet was fed to five pens of pigs containing four barrows. A normal crude protein (CP) diet providing 15.3% CP and 0.71% SID Lys and five low CP diets providing 12% CP with SID Lys concentrations of 0.51, 0.61, 0.71, 0.81 and 0.91% were formulated. Increasing the SID Lys content of the diet resulted in an increase in weight gain (linear effect p = 0.04 and quadratic effect p = 0.08) and an improvement in feed conversion ratio (FCR) (linear effect p = 0.02 and quadratic effect p = 0.02). For weight gain and FCR, the estimated SID Lys requirement of finishing barrows were 0.71 and 0.71% (linear broken-line analysis), 0.79 and 0.78% (quadratic analysis), respectively. Exp. 2 was a 26 d dose-response study using SID Thr to Lys ratios of 0.56, 0.61, 0.67, 0.72 and 0.77. A total of 138 barrows weighing 72.5±4.4 kg were randomly allotted to receive one of the five diets. All diets were formulated to contain 0.61% SID Lys (10.5% CP), which is slightly lower than the pig’s requirement. Weight gain was quadratically (p = 0.03) affected by SID Thr to Lys ratio while FCR was linearly improved (p = 0.02). The SID Thr to Lys ratios for maximal weight gain and minimal FCR and serum urea nitrogen (SUN) were 0.67, 0.71 and 0.64 using a linear broken-line model and 0.68, 0.78 and 0.70 using a quadratic model, respectively. Based on the estimates obtained from the broken-line and quadratic analysis, we concluded that the dietary SID Lys requirement for both maximum weight gain and minimum FCR was 0.75%, and an optimum SID Thr to Lys ratio was 0.68 to maximize weight gain, 0.75 to optimize FCR and 0.67 to minimize SUN for finishing barrows.
INTRODUCTION
Feed costs and nitrogen excretion may be reduced by replacing a portion of the dietary crude protein in swine diets with crystalline amino acid (AA; Deng et al., 2007a ; Chen et al., 2011). Pigs fed low crude protein (CP) diets (protein level reduced by three to four percentage units) supplemented with CAA have been shown to achieve the same performance as those fed normal (formulated to meet CP requirements) protein levels (Kerr et al., 2003; Deng et al., 2007b), while the amount of protein ingredients used and feed costs were both reduced.
Threonine (Thr) is the third limiting AA in corn based diets for pigs (Grosbach et al., 1985), and the first limiting AA for growing pigs fed low CP diets containing crystalline lysine (Lys) when based on barley (Fuller et al., 1979) or grain sorghum (Hansen et al., 1993). Thr also plays very important role in animal mucosal mucins synthesis (Wang et al., 2007) and immune function (Li et al., 1999; Li et al., 2007; Kim et al., 2007). Knowledge of the appropriate Thr levels to use in low CP corn soybean meal-based diets is extremely important to the swine industry because of the relatively low concentration of Thr in corn and the high cost of supplementation with crystalline Thr.
For finishing pigs, several studies have conducted to estimate the apparent ileal digestible Thr requirement (Saldana et al., 1994; Schutte et al., 1997) or standardized ileal digestible (SID) Thr requirement (Ettle et al., 2004). There were only two studies that reported the optimal SID Thr to Lys ratio for finishing pigs fed normal CP diets (Pedersen et al., 2003; Plitzner et al., 2007), in which the optimal SID Thr to Lys ratio was estimated to be 0.62 to 0.64. However, less information was available on Thr to Lys ratio in finishing pigs fed reduced CP and AA supplemented diets.
To express the Thr requirement as a Thr to Lys ratio, Lys should be the second-limiting AA in the diet after Thr, and the requirements for the other essential AA were met or exceeded (Boisen, 2003). There are very few empirical studies have been conducted to determine the optimum SID Lys requirement. The SID Lys requirements of the selected studies in the National Research Council (NRC, 2012) were estimated from the diet composition at the defined requirement.
The objectives of the present experiments were to determine the optimal dietary SID Lys concentration and estimate the optimal SID Thr to Lys ratio for maximizing weight gain or minimizing FCR and serum urea nitrogen (SUN) of finishing pigs fed low CP diets supplemented with CAA.
MATERIALS AND METHODS
All experimental procedures and animal care were approved by the China Agricultural University Animal Care and Use Committee.
Experimental design, animals, housing and diets
Two experiments were conducted to determine the SID Lys requirement and the ideal SID Thr to Lys ratio for finishing barrows (Yorkshire×Landrace) fed low CP diets. In both experiments, pigs were placed in 3.0 m×4.0 m pens equipped with a single-sided five-hole feeder and two nipple drinkers. Feed and water were supplied ad libitum. Pigs were weighed after an overnight fast at the beginning and end of the experiment to determine weight gain. Feed disappearance was measured weekly to calculate feed intake.
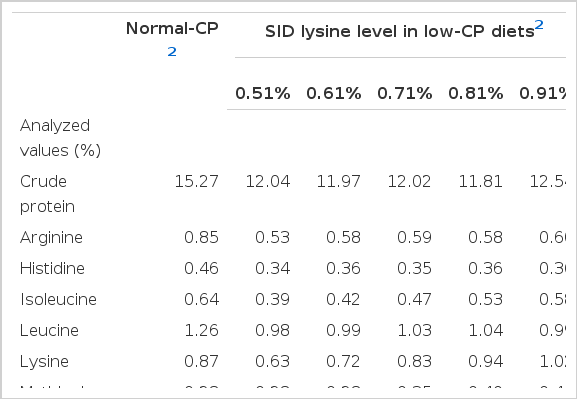
Exp. 1 was carried out to estimate the requirement for SID Lys in finishing barrows fed low CP, AA supplemented diets. In Exp. 1, 120 barrows with an average body weight of 72.8±3.6 kg were allotted to one of six dietary treatments with five pens per treatment and four pigs per pen in a randomized complete block design for 35 d. Diets consisted of corn, wheat bran, soybean meal and crystalline AAs (Table 1). A normal CP diet providing 15.3% CP and 0.71% SID Lys, as well as five diets providing 12% CP with SID Lys concentrations of 0.51, 0.61, 0.71, 0.81 and 0.91% were formulated. The reduction of nitrogen from the decreased essential AAs was offset by alanine to make the low CP diets isonitrogenous. SID ratios of the essential AAs to SID Lys were 110% of those recommended by the National Swine Nutrition Guide (NSNG, 2010).

Composition of experimental diets fed to determine the standardized ileal digestible (SID) lysine requirement and the optimum SID lysine (Lys) to threonine (Thr) ratio for finishing barrows (%, as-fed basis)
In Exp. 2, 138 barrows (72.5±4.4 kg) were randomly allotted into five replicate pens of five or six barrows per pen for a 26 d trial. Five diets were formulated to contain SID Thr to Lys ratios of 0.56, 0.61, 0.67, 0.72, and 0.77 (Table 2). All diets were formulated to contain 0.61% SID Lys (10.5% CP), which is slightly below the pig’s requirement. The different SID Thr to Lys ratios were created by replacing part of the corn with crystalline Thr (Table 1). SID values for the complete diets were estimated by multiplying the analyzed AA levels in corn, soybean meal and wheat bran by the SID of the corresponding AA in those feedstuffs (AminoDat 3.0. 2005; Evonik Degussa GmbH, Hanau, Germany). SID AA profiles for lysine, methionine+cystine, tryptophan, valine and isoleucine were formulated to meet the values recommended by NSNG (2010) for finishing barrows.
Collection and sampling
Representative feed samples were taken weekly. At the termination of the experiment, blood samples were taken from one pig per pen before the morning feeding via anterior vena cava puncture into 10-ml heparin-free vacutainer tubes (Becton Dickinson Vacutainer Systems, Franklin Lakes, NJ, USA) to determine the concentrations of SUN and serum AA. Pigs whose weight was nearest the average for each pen were selected for bleeding. Blood samples were centrifuged at 1,200×g (Heraeus Biofuge 22R Centrifuge, Hanau, Germany) for 15 min at room temperature and the serum was immediately stored at − 20°C for later analysis.
Chemical analysis
Crude protein was analyzed according to AOAC (2003) procedures. The AA contents in diets were analyzed by ion-exchange chromatography using a Hitachi L-8800 Amino Acid Analyzer (Tokyo, Japan) after acid hydrolysis with 6 N HCl (reflux for 23 h at 110°C). The cystine and methionine contents in the diets were measured after performic oxidation before hydrolysis and the tryptophan content in diets was determined after alkaline hydrolysis at 120°C for 16 h (AOAC, 2003), separated by reverse-phase HPLC (Waters 2690, Milford, MA).
Frozen serum samples were first thawed at 4°C and deproteinized by using 120 mg of salicylsulfonic acid/ml of serum. After sitting in an ice bath for 20 min, the reaction system was adjusted for pH by adding a lithium hydroxide solution (2 mol/L) and then centrifuged in an ultracentrifuge with a fixed angle rotor (Beckman Optima L80-XP, Beckman Coulter Inc., Fullerton, CA, USA) at 11,000×g for 30 min at 4°C. The supernatant was collected and then passed through a filter (0.1 μm). Serum AA concentrations of barrows were determined by ion-exchange chromatography with physiological fluid analysis conditions (S-433D Amino Acid Analyzer, Sykam, Germany). SUN concentrations were determined with a blood urea nitrogen color test kit (Nanjing Jiancheng Bioenineering Insitute, Nanjing, China).
Statistical analysis
Data for each response criterion were analyzed by PROC GLM of SAS (SAS Institute, Cary, NC, USA) with dietary SID Lys (Exp. 1) or SID Thr to Lys ratio (Exp. 2) and replicate included in the model. The pen was considered the experimental unit for all variables. The LSMEANS procedure of SAS was used to calculate mean values. Linear and quadratic comparisons were used to evaluate the effects of increasing SID Lys (Exp. 1) or SID Thr to Lys ratio (Exp. 2). Alpha levels of p≤0.05 and p<0.10 were the criterion for statistical significance and tendencies. The response to an increasing SID Thr supply was analyzed by linear broken-line analysis (Robbins et al., 2006), along with the asymptote of the quadratically fitted line using SAS.
RESULTS
In Exp. 1, the highest weight gain and the lowest FCR and SUN concentrations were found in barrows fed the 0.71, 0.81 and 0.81% SID Lys diets, respectively (Table 4). Increasing the SID Lys content of the diet resulted in an increase in weight gain (linear effect p = 0.04 and quadratic effect p = 0.08) and improvement in FCR (linear effect p = 0.02 and quadratic effect p = 0.02).

Using a linear broken-line model, the estimated SID Lys requirement of finishing barrows was 0.71% for both weight gain and FCR (Figures 1 and 2). When a quadratic analysis was conducted, the estimated SID Lys requirements were 0.79 and 0.78% to maximize weight gain and minimize FCR, respectively (Figures 1 and 2).
Fitted broken line (—) and quadratic (---) plot of weight gain plotted against standardized ileal digestible lysine (Exp. 1).
Fitted broken line (—) and quadratic (---) plot of feed conversion ratio plotted against standardized ileal digestible lysine (Exp. 1).
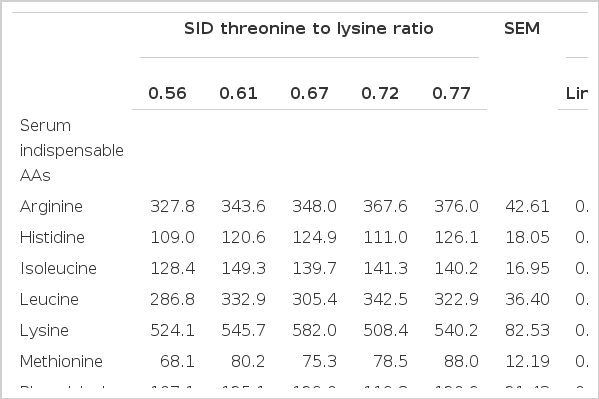
In Exp. 2, the highest weight gain and the lowest FCR and SUN concentrations were found in barrows fed SID Thr to Lys ratios of 0.67, 0.72 and 0.67, respectively (Table 5). Improvements in weight gain (quadratic effect p = 0.03), feed intake (quadratic effect p = 0.02) and FCR (linear effect p = 0.02 and quadratic effect p = 0.06) were observed with increasing SID Thr to Lys ratios. SUN concentrations were also significantly affected by increasing SID Thr to Lys ratios (linear effect p = 0.03 and quadratic effect p = 0.02). Supplementation with Thr increased the serum concentrations of Thr (linear effect p = 0.04 and quadratic effect p = 0.07) and glutamic acid (linear effect p = 0.02 and quadratic effect p = 0.07; Table 6).
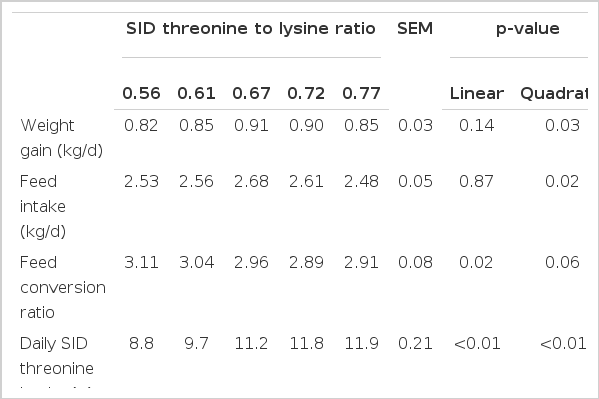
Using a linear broken-line model, the optimal SID Thr to Lys ratio to maximize weight gain (Figure 3), and optimize FCR (Figure 4) and SUN (Figure 5) were 0.67, 0.71 and 0.64. Using the quadratic model, the optimal SID Thr to Lys ratio to maximize weight gain (Figure 3), and optimize FCR (Figure 4) and SUN (Figure 5) were 0.68, 0.78 and 0.70.
Fitted broken line (—) and quadratic (---) plot of weight gain plotted against standardized ileal digestible threonine to lysine ratio (Exp. 2).
Fitted broken line (—) and quadratic (---) plot of feed conversion ratio plotted against standardized ileal digestible threonine to lysine ratio (Exp. 2).
Fitted broken line (—) and quadratic (---) plot of serum urea nitrogen plotted against standardized ileal digestible threonine to lysine ratio (Exp. 2).
DISCUSSION
Protein sources are among the most expensive ingredients in swine diets and therefore nutritionists attempt to formulate diets that will maximize the efficiency of growth and minimize the excretion of nitrogenous waste (Gabert et al., 2001). Two concepts widely utilized for the formulation of “efficient and environmentally friendly” diets are the ideal protein concept and the formulation of diets based on digestible or available nutrients (Chiba, 2001).
The most widely utilized estimates of the requirements of pigs for SID AA are those of the British Society of Animal Science (BSAS, 2003), Evonik Industries (Rademacher et al., 2009), the NSNG (2010) and NRC (2012). The NSNG (2010) estimates the SID Lys requirement of 81 to 102 kg pigs to be 0.72% for high lean gain lines of barrows, 0.62% for medium lean gain lines of barrows. Evonik Industries (Rademacher et al., 2009) estimates the Lys requirement of 70 to 105 kg pigs to be 0.71% SID Lys, NRC (2012) estimates the Lys requirement of 75 to 105 kg pigs to be 0.73% SID Lys while BSAS (2003) estimates the SID Lys requirement of 60 to 90 kg pigs to be 0.51% for slow growing pigs, 0.71% for intermediate pigs and 0.89% for fast growing pigs. However, it is important to realize that these estimates are typically determined using a prediction model and are not based on any empirical experiments (Hans Stein, University of Illinois; Personal Communication). It is important that the estimates of prediction models be validated with actual experimental data.
Exp. 1 was carried out to estimate the requirement for SID Lys in finishing barrows fed low CP, AA supplemented diets. Averaging the values from the broken-line and quadratic analysis, the dietary SID Lys requirement for both maximum weight gain and minimum FCR was 0.75%, which is in good agreement with previously published values. The results of Exp. 1 clearly demonstrate that pigs fed low CP diets supplemented with CAA can achieve the same performance as pigs fed normal CP levels. An advantage of feeding low CP diets supplemented with CAA is that nitrogen excretion and feed costs may be reduced (Kerr et al., 1995). Whether or not any cost savings are actually achieved will depend on the relative price of CAA compared with the protein ingredients they replace.
Another important means of achieving maximal efficiency of swine growth is to design AA patterns that contain neither deficiencies nor excesses of AA. A protein that contains a perfect balance of AA has been described as an ideal protein (Fuller and Wang, 1990; Baker et al., 1993; Cole and Van Lunen, 1994). The concept of the ideal protein allows for a rapid estimation of requirements for essential AA once the requirement for one AA, typically Lys, has been established. The concept of an ideal protein has largely been utilized to determine the optimum ratios for total AA in the diet and few attempts have been made to establish the optimum ratios of SID AA.
Exp. 2 was conducted to determine the ideal ratio of SID Thr to Lys for finishing barrows. For establishing the optimal ratio between two specific AAs, it is important that pigs are fed diets limiting in Lys (Boisen, 2003). To secondarily limit Lys, a level of 0.61% SID Lys was formulated in titration diet, which is about 20% lower than the present study for finishing pigs. Averaging the values from the broken-line and quadratic analysis, an optimum SID Thr to Lys ratio for finishing barrows is 0.68 to maximize weight gain, 0.75 to optimize FCR and 0.67 to minimize SUN.
Estimates of the required ratio of Thr to Lys in ideal protein vary from 0.60 to 0.75 (Fuller and Wang, 1990; Baker et al., 1993; Cole and van Lunen, 1994; Boisen et al., 2003). Based largely on these estimates of ideal protein, both BSAS (2003) and NSNG (2010) recommend an SID Thr to Lys ratio of 0.65, while Evonik Industries (Rademacher et al., 2009) recommends an SID Thr to Lys ratio of 0.70 and NRC (2012) recommends an SID Thr to Lys ratio of 0.63 for finishing pigs.
To date, very few empirical studies have been conducted to determine the optimum SID Thr to Lys ratio for finishing pigs and we are unaware of any previous experiments in which the optimum SID Thr to Lys ratio has been determined for finishing pigs fed low CP diets. Pedersen et al. (2003) demonstrated that the optimum SID Thr to Lys ratio for 60 to 110 kg pigs was found to be 0.62 to 0.64. Plitzner et al. (2007) also found a similar optimal SID Thr to Lys of 0.62 to 0.64 with 67 to 113 kg pigs and also suggested that the ratio rises as pigs move towards the late finishing stage. Therefore, the results of the present study are within the range of previously reported values for the optimum SID Thr to Lys ratio for finishing pigs, the results obtained tend to be on the high side of the range.
A potential explanation for this finding may relate to the CP level of the diet used. Support for this concept can be obtained from the work of Zhai and Adeola (2011) who reported that the CP level in corn soybean meal diets affected the SID of Thr, leucine and phenylalanine. Moreover, Li et al. (1999) found that relative to Lys of Thr required to maximize immune response is greater than that required for maximum weight gain and increasing dietary Thr levels increased plasma antibody concentration. Compared with most of the experiments conducted in a research setting, the data of current experiment were obtained under commercial conditions where pigs were confronted with many challenges. Therefore, further research should be conducted to determine whether or not the optimum SID Thr to Lys ratio is affected by dietary CP level.
In the present study, the optimum SID Thr to Lys ratio was dependent on whether weight gain, FCR or SUN was used as the response criteria. This finding agrees with the studies of Pedersen et al. (2003) who also reported that the optimum SID Thr to Lys ratio was dependent on the response criteria used. The reduction in plasma urea presumably reflected more efficient nitrogen utilization and less urea synthesis when the quality and quantity of AA approached the requirement of pigs (Verstegen and Jongbloed, 2003). Whang and Easter (2000) demonstrated that blood urea nitrogen values are highly correlated with lean gain and feed efficiency in pigs. However, the choice as to which ratio to use will ultimately depend upon producer objectives but as there is little economic incentive to minimizing SUN, it is likely that producers would choose between ratios generated using weight gain and FCR.
In a dose-response experiment, choice of a statistical model is critical to interpreting nutritional requirements (Pesti et al., 2009). Quadratic models are easy to fit to data (only three levels are needed) and can accurately model the increase and decrease in performance, which shape represents the response to graded concentrations of a nutrient up to the point when it becomes “safe” or “toxic”. Broken line models fit the ascending and plateau portions well, which as concentrations of a nutrient are increased in the diet, there is a change in response up to some point, which is the requirement (Pesti et al., 2009). Linear broken-line analysis is preferred by some studies because the requirement is taken to be the minimum intake needed for maximum retention (Fuller and Garthwaite, 1993). However, a linear broken-line response is predicted for an average pig and the requirement can be considered as the requirement for a theoretical average pig (Baker, 1986). For the purpose of safety and comparison, both models were chosen as the approach to determine the requirement of AA in the present experiment.
It is generally believed that a systemic blood AAs profile reflects tissue utilization and metabolism (Wiltafsky et al., 2009). In Exp. 2, an increased ratio of Thr to Lys in diets resulted in a linearly increase in serum Thr concentration (p = 0.04), which agrees with the results of Kendall et al. (2007), where serum concentration of the test AA increased linearly with the increased dietary test AA. Furthermore, changes in serum concentrations of test AA were used by Wiltafsky et al. (2009) to estimate the optimal AA needs of pigs, which was based on the hypothesis that an increasing dietary supply of an AA had little effect on serum concentrations until the requirement is met, but will linearly increase serum concentrations when the diet contains adequate or excess amounts. However, a sharp increase of serum AA concentration was not found in the present study, presumably caused by lower levels of dietary Thr and the different time of blood collection used by Wiltafsky et al. (2009).
CONCLUSION
Averaging the values from broken-line and quadratic analysis, we concluded that the dietary SID Lys requirement for both maximum weight gain and minimum FCR was 0.75%, and an optimum SID Thr to Lys ratio was 0.68 to maximize weight gain, 0.75 to optimize FCR and 0.67 to minimize SUN for finishing barrows, these ratios were higher than current recommendation of 0.63 for 75 to 100 kg finishing pigs (NRC, 2012).

Acknowledgements
This work was financially supported by the Modern Agro-Industry Technology Research System of Beijing and National Key Basic Research Program of China (No. 2012CB124702). The authors thank the Dacheng group, ChangChun, China and Health and Nutrition, Evonik Degussa GmbH, Germany, for providing supplemental AAs. We also thank P. A. Thacker for comments on the manuscript.