Effect of Crude Protein Levels in Concentrate and Concentrate Levels in Diet on In vitro Fermentation
Article information
Abstract
The effect of concentrate mixtures with crude protein (CP) levels 10%, 13%, 16%, and 19% and diets with roughage to concentrate ratios 80:20, 60:40, 40:60, and 20:80 (w/w) were determined on dry matter (DM) and organic matter (OM) digestibility, and fermentation metabolites using an in vitro fermentation technique. In vitro fermented attributes were measured after 4, 24, and 48 h of incubation respectively. The digestibility of DM and OM, and total volatile fatty acid (VFA) increased whereas pH decreased with the increased amount of concentrate in the diet (p<0.001), however CP levels of concentrate did not have any influence on these attributes. Gas production reduced with increased CP levels, while it increased with increasing concentrate levels. Ammonia nitrogen (NH3-N) concentration and microbial CP production increased significantly (p<0.05) by increasing CP levels and with increasing concentrate levels in diet as well, however, no significant difference was found between 16% and 19% CP levels. Therefore, 16% CP in concentrate and increasing proportion of concentrate up to 80% in diet all had improved digestibility of DM and organic matter, and higher microbial protein production, with improved fermentation characteristics.
INTRODUCTION
In developing countries, low cattle production may be caused by inadequate nutrient supply in a high-forage based ration (Suharti et al., 2011). Therefore, it is essential for cattle production systems to find new sources and technologies of feedstuffs. Recently, smallholder farmers have been using a variety of concentrate ingredients such as rice bran, maize meal and cassava powder as well as concentrate mixture from these concentrate feedstuffs in cattle production (Suharti et al., 2011). However, the benefit of using these available feeds is limited because of insufficient information about nutritive value, digestibility and rumen fermentation characteristics. Previous studies reported that concentrate feeds differ substantially in their rumen fermentation characteristics (Mills et al., 1999). This may be due to the differences in the physical and chemical characteristics of each concentrate (Ørskov, 1986). Concentrate containing high starch is important in ruminant nutrition because it is a practical and cost-effective source of energy and has been shown to influence the functioning of the rumen and nutrient digestion (Krause and Oetzel, 2006; Tahir et al., 2013).
Nutritive values are an important measure for evaluating ruminant feeds. It can be determined by several methods such as in vivo, in situ, and in vitro techniques. In vivo method is laborious and requires a relatively large number of animals (Zicarelli et al., 2011). While in situ method has the advantage that it uses the actual rumen environment to measure feed digestion, it also has the disadvantage that it is expensive in terms of labour and analytical costs, and measures feed disappearance but not the actual amount of fermented substrate (Tagliapietra et al., 2011), primary and secondary losses of particulate matter as well as the differences between the level of microbial activity inside the in situ bags and that in the rumen (Tahir et al., 2013). These factors can result in over-all underestimation of rumen digestibility of nutrients.
The in vitro methods provide less expensive and more rapid alternatives (Getachew et al., 2004), and these techniques have been widely used to assess the nutritive value of feeds not only because these methods are capable of measuring rate and extent of nutrients degradation with less expenditure, but also because DM digestibility and VFA production measured by in vitro gas production techniques highly correspond with data provided by in vivo experiments (Menke and Steingass, 1988; Theodorou et al., 1994; Getachew et al., 2004; Shuharti et al., 2011; Tahir et al., 2013). However, all the above authors used mainly a single feedstuffs and roughage as substrate for incubation. Few researches used concentrate mixtures or diets with different rations of roughage and concentrate as substrate.
The objective of this study was to evaluate the in vitro characteristics of four concentrate mixtures with four levels of CP, and four diets with different roughage to concentrate ratios.
MATERIALS AND METHODS
Rumen inoculum
Rumen fluid was collected before morning feeding from 3 fistulated dry dairy cows fed on grass ad libitum and 2 kg/d of concentrate. The rumen fluid was immediately transferred to the laboratory in a warmed thermos flask (39±0.5°C), and then filtered through 4 layers of cheesecloth to eliminate feed particles and then mixed with the buffer mineral solution in a 1 to 9 ration. All operations were made under anaerobic conditions by flushing with carbon dioxide. Buffer mineral solution according to Theodorou et al. (1994) was preheated in a water bath at 39°C and purged continuously with CO2 for 30 min.
Substrates and chemical analyses
Eight feeds were investigated, including four concentrate mixtures with four levels of CP (10%, 13%, 16%, and 19%), and four mixed feeds with different roughage to concentrate (16% CP) ratios (80:30, 60:40, 40:60, and 20:80 w/w). Feed samples were grounds to pass a 1 mm sieve using a hammer mill (Pullerisette 19, Fritsch GmbH, Laborgeratebau, Germany) and analyzed for their chemical composition. DM, ash and nitrogen (N) level using standard methods of AOAC (1990) after drying at 60°C. The concentration of CP was calculated as N×6.25. The GE of feeds were determined by bomb calorimetry (Bomb Calorimeter 6300, Parr Instrument Company, Moline, IL, USA), and NDF was determined according to the method of Van Soest et al. (1991) with addition of α-amylase but without sodium sulphite and results expressed with residual ash. Table 1 presents the feed ingredients and nutrient composition investigated in this experiment.
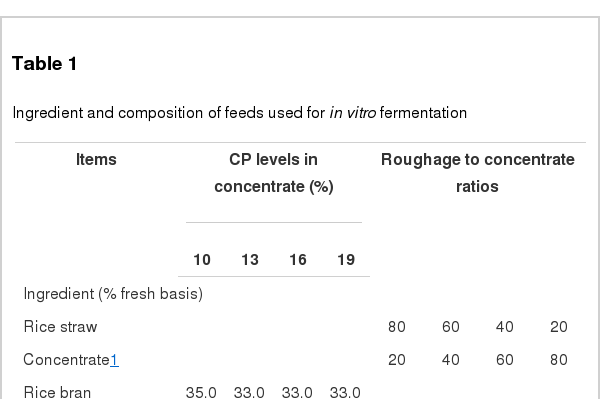
Ingredient and composition of feeds used for in vitro fermentation
In vitro fermentation and fermentation attributes analyses
One±0.001 g of the air dried feeds was incubated in 160 mL bottle which containing 90 mL of buffer mineral solution and 10 mL of rumen fluid (Theodorou et al., 1994) for 48 h at 39°C. During the incubation, the cumulative gas production was measured at 2, 4, 6, 8, 12, 18, 24, 30, 36, and 48 h using a manual pressure transducer (Theodorou et al., 1994).
Digestibility of DM and OM, pH, VFA production, microbial CP and NH3-N concentration were determined at three time points (4, 24, and 48 h after incubation). Each time, pH value was measured immediately by pH meter (Schott, Germany), and then approximately 10 mL of end liquids were sampled and divided into aliquots for downstream analyses, including VFA production, NH3-N concentration after being equally mixed with 0.2 M HCl and microbial CP. The rest of end liquids in each bottle were centrifuged at 10,000×g for 5 min, supernatant removed and dried at 105°C for 12 h and burning at 550°C for 4 h to determine DM and ash. Digestibility of DM and OM were calculated as difference weighing between before and after incubation, corrected by a blank which consisted of four flask containing only buffered rumen fluid.
To analyse VFA production, 0.2 mL of metaphosphoric crotonic sodium was added to 1 mL of end fermented liquid and stored at −20°C overnight, and then centrifuged twice at 12,000 rpm for 10 min at 4°C. VFAs were measured by gas chromatography using a fused silica capillary column (30 m×0.25 mm, 0.25 mm film thickness). Pure chemicals of acetate, propionate and butyrate purchased from Sigma-Aldrich were used as external standards. The area of each VFA response was compared with those of the external standards (Zicarelli et al., 2011).
For NH3-N concentration, 1 mL of end liquid preserved by 0.2 M HCl was firstly centrifuged at 12,000 rpm for 15 min at 7°C, then 0.01 mL of supernatant was transferred into a new tube, and 2.5 mL of phenol color reagent and 2.0 mL of hypochlorite reagent sodium were added. NH3-N concentration was measured by reading absorbance at 630 nanometers using spectrophotometer. The concentration of NH3-N is directly proportional to the absorbance of indophenol which is measured.
For microbial CP determination, 3 mL of subsample was centrifuged at 1,000 rpm for 8 min at 4°C, then 1 mL of supernatant was collected and centrifuged at 15,000 rpm for 15 min at 4°C, the supernatant was discarded, 3 mL of NaOH 0.25 N was added and heated in boiling water bath for 10 min. Contents then were centrifuged at 15,000 rpm for 30 min at 4°C, and 0.2 mL of supernatant was collected and 5 mL of coomasie brilliant blue G-250 dye was added to recovered protein. Microbial CP of 0.2 mL was determined by absorbance on a plate reader at 595 nanometers. Precipitated bovine serum albumin was standard sodium (Martin and Martin, 1982).
Statistical analysis
Data were analyzed using the GLM procedure of SPSS 16.0. The following model wasused to determine treatment mean differences using a least significant difference method:
Where Yij is the observation from bottle j, feed i; μ is the overall of mean; Si is the effect of feeds and eij is the residual effect. Polynomial contrasts were used to determine linear and quadratic effects of CP levels and concentrate levels on dependent variables. In all the analyses, significant effects were declared at p<0.05.
RESULTS
Chemical composition, gas production, and apparent in vitro DM and OM digestibility
The ingredient and chemical composition of feeds used in this experiment are presented in Table 1. The OM contents in feeds was variable, as the lowest to be in mixed feed with 80:20 of roughage to concentrate ratio and the highest in concentrate mixture with 10% of CP content. The CP content varied from 7.53% to 20.2%. The higher value for NDF was observed in mixed feeds instead of concentrate mixture.
The patterns of cumulative gas production of various feeds are presented in Figure 1. For concentrate mixtures, the cumulative gas production over 48 h was negatively correlated with their CP levels (Figure 1a). While for mixed feeds with ratios of roughage to concentrate, in vitro fermentation was faster with an increasing proportion of concentrate in diet (Figure 1b).
In vitro gas production for different CP levels in concentrate (a) and different roughage to concentrate ratios (b) incubated with rumen fluid.
Increasing CP levels in concentrate had no significant effect (p>0.05) on DM and OM digestibility, whereas increasing the proportion of concentrate resulted in raised (p<0.001) DM and OM digestibility (Table 2).
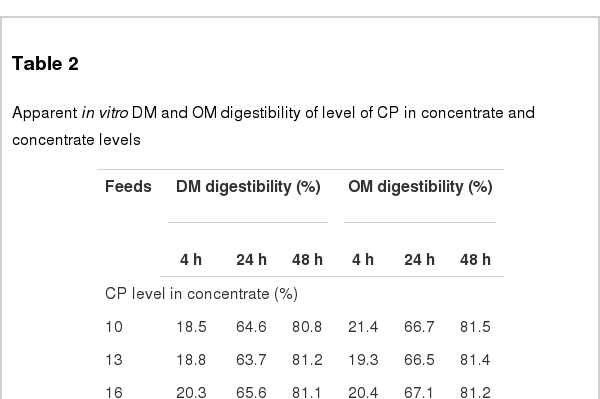
Apparent in vitro DM and OM digestibility of level of CP in concentrate and concentrate levels
pH, NH3-N concentration and microbial CP
For concentrate mixtures with different CP levels, there was no significant affect (p>0.05) on pH at different incubation periods, whereas NH3-N concentration and microbial CP were significantly affected (p<0.05) by CP levels (Table 3). However, no significant difference was found (p>0.05) between 16% and 19% CP in concentrate.

pH, NH3-N concentration (mg/100 mL) and microbial CP (mg/100 mL) at 4, 24, and 48 h after incubation
For mixed feeds with different ratios of roughage to concentrate, there were significant affects (p<0.05) on NH3-N concentration, pH during incubation time and microbial CP. The pH value decreased, whereas NH3-N and microbial CP concentration increased linearly with increasing concentrate in diet (Table 3).
Volatile fatty acid
For concentrates with different CP levels, there was no significant affect (p>0.05) on the total VFA and molar proportion of individual VFA production. A significant effect (p<0.05) on acetate to propionate ratio at 24 h after incubation was discernible between treatments (Table 4).
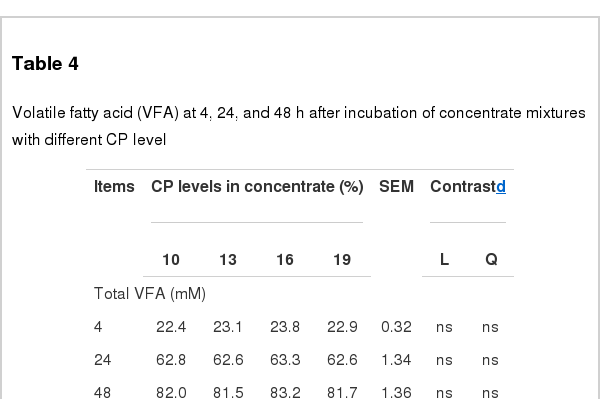
Volatile fatty acid (VFA) at 4, 24, and 48 h after incubation of concentrate mixtures with different CP level
For mixed feeds with different ratios of roughage to concentrate, there was a significant affect on (p<0.05) total VFA production and which increased linearly with an increasing proportion of concentrate. However, the proportion of individual VFA did not vary significantly with roughage to concentrate ratios (p>0.05), except for the proportion of acetate at 24 h incubation. Acetate to propionate ratios were comparable (p>0.05) among roughage and concentrate ratios (Table 5).
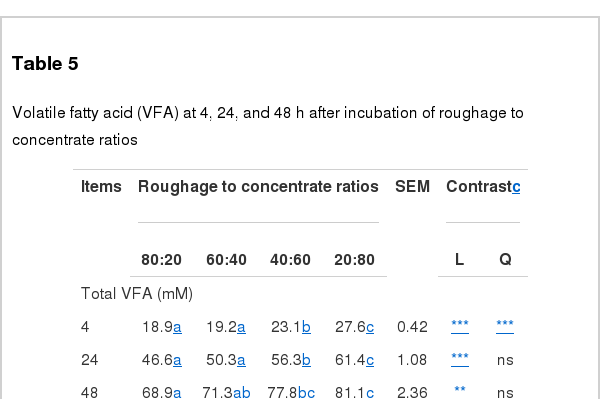
Volatile fatty acid (VFA) at 4, 24, and 48 h after incubation of roughage to concentrate ratios
DISCUSSION
Our results indicated that increasing CP in concentrate leads to less gas production, while raising the proportion of concentrate in diet leads to more gas production. The negative relationship between CP content of the substrate and gas production has already been shown in several researches (Rodríguez et al., 2010; Soltan et al., 2012), while the positive relationship between gas production rate and amount of concentrate in diet has also been confirmed by previous reports (Bannink et al., 2000; Zicarelli et al., 2011). The higher energy available for microbial populations supplied by the higher concentrate could offer an explanation for this observation. On the other hand, increasing concentrate in diet reduced NDF content, which factors into increase of gas production (Rodríguez et al., 2010; Zicarelii et al., 2011; Soltan et al., 2012). However, the total amount of gas production during in vitro fermentation is obtained when the fermentation of various substances occurred at the same time. Due to the different speed of fermentation of different substances in such a process, it is difficult to relate every affected division to each specific factor (Thang et al., 2011).
The results also showed that increasing CP level in concentrate had no significant effect on in vitro DM and OM digestibility. These observations are in agreement with previous in vivo reports in beef cattle (Chen et al., 2010; Yuangklang et al., 2010) and dairy cows (Ghorbani et al., 2011; Norrapoke et al., 2012). However, the present results did not agree with other researches of cattle (Paengkoum and Tatsapong, 2009) and buffalo (Shahzad et al., 2011; Chanthakhoun et al., 2012). These variations indicated that the effects of CP levels on the digestibility of nutrients varied and depended on factors such as levels and sources of protein (Milis and Liamadis, 2007; Chantiratikul et al., 2009). In vitro DM and OM digestibility rose as concentrate increased, which agrees with results from Kumar et al. (2013). That the higher concentrate level in diets contributed to a higher level of soluble substrates could be the reason for improving DM and OM digestibility. In present study, DM and OM digestibility trended to the highest level at 80% concentrate in diet treatment, which indicated that, increase in concentrate up to 80% in diet could improve nutrient digestibility.
It also showed that increasing in CP levels could raise the NH3-N concentration. The difference in NH3-N concentration may be related directly to CP concentration and degradability of protein in concentrate. These observations were similar to previous in vivo studies, which reported that NH3-N concentration rose with an increasing level of CP (Chen et al., 2010; Ghorbani et al., 2011). Similarly, several authors (Pina et al., 2009; Agle et al., 2010) suggested that NH3-N concentration was significantly affected by changing levels of concentrate. The levels of NH3-N concentration in the present study were above 5 mg/100 mL, which is required to support maximum growth rate of rumen bacteria for the optimal fermentation and maximized OM digestion in the rumen (McDonald et al., 1995). Values of microbial CP concentration in our study were lower than NH3-N concentration. This would indicate that protein degradation is more than synthesis. This finding was similar to that by Chantiratikul et al. (2009) and Chumpawadee et al. (2009). The pH value measurement can be used as a tool to evaluate the fermentation process in the rumen (Kumar et al., 2013). The pH in present study is similar among CP levels, this observation is in agreement with previous in vivo studies (Promkot and Wanapat, 2005; Chantiratikul et al., 2009; Chen et al., 2010), which reported that pH was not significantly affected by increasing CP level. The pH value decreased as the amount of concentrate in diet increased, which was similar to findings from Kumar et al. (2013). The pH values in present study were relatively stable at 6.06 to 6.77, and were greater than the 5.0 to 5.5 range suggested by Hoover (1986) which the ruminal microbial activity was negatively affected. The numerically higher NH3-N concentration could indicate a higher rate of CP degradation (Crawford et al., 1978). Therefore, feeds in our study with higher CP levels could also have contributed to higher CP degradation which may have caused a greater NH3-N concentration. However, in present study no significant difference was found between 16% and 19% CP in concentrate regarding NH3-N and microbial CP concentration. While increasing concentrate above 80% would result in NH3-N and microbial CP being higher as compared to other levels. Based on the results of our experiment, 16% CP in concentrate and 80% concentrate in diet is recommendable.
The total VFA and molar proportion of individual VFA (acetate, propionate and butyrate) were not significantly affected by increased CP level. Some in vivo studies (Chen et al., 2010; Chanthakhoun et al., 2012; Norrapoke et al., 2012) reported that increasing CP had no significant effected on the VFA which was similar to our observations. Whereas, difference of roughage to concentrate ratios significantly affected total VFA production which increased linearly with the proportion of concentrate’s increase. However, the proportion of individual VFA did not vary significantly with roughage to concentrate ratios, except for proportion of acetate at 24 h incubation. These results are in agreement with that of Suharti et al. (2011) and Kumar et al. (2013) who reported that total VFA production was significantly affected by forage to concentrate ratio in the diet, but not molar proportion of individual VFA or acetate to propionate ratio. Production of total VFA increased when the level of concentrate in the ration increased. Zicarelli et al. (2011) also found that there were no differences among ration of roughage and concentrate in molar proportion of acetate, propionate and butyrate. McDonald et al. (1995) also found that a higher fermentable carbohydrate in the diet could have led to lower level of acetate. When rumen fermentation conditions are optimal, the acetate to propionate ratio should be greater than 2.1:1 (McDonald et al., 1995). In our study, acetate to propionate ratios was within the conditions of optimal fermentation. The average of acetate, propionate and butyrate concentrations in this study were 52.6%–66.6%, 19.4%–25.3%, and 9.2%–12.9% of total VFA, respectively, which is similar to those reported in several previous studies (Chumpawadee et al., 2009; Chanthakhoun et al., 2012; Norrapoke et al., 2012).
In conclusion, for concentrate mixtures with different CP levels, increasing CP levels had no significant effect on DM and OM digestibility, whereas NH3-N and microbial CP concentration were improved by increasing CP levels. However, no significant difference was found between 16% and 19% CP levels. For mixed feeds with different ratios of roughage to concentrate, in vitro DM, OM digestibility, NH3-N, microbial CP and total VFA concentration were increased as proportion of concentrate in diet increased. These observations suggest that 16% of CP in concentrate and concentrate up to 80% in diet may be recommended for in vitro fermentation.