Growth, Feed Utilization and Blood Metabolic Responses to Different Amylose-amylopectin Ratio Fed Diets in Tilapia (Oreochromis niloticus)
Article information
Abstract
A feeding trial was conducted in tilapia to determine the growth performance, nutrient digestibility, digestive enzymes, and postprandial blood metabolites in response to different dietary amylose-amylopectin ratios. Five isonitrogenous and isolipidic diets containing an equal starch level with different amylose-amylopectin ratios of 0.11 (diet 1), 0.24 (diet 2), 0.47 (diet 3), 0.76 (diet 4) and 0.98 (diet 5) were formulated using high-amylose corn starch (as the amylose source) and waxy rice (as the amylopectin source). Each diet was hand-fed to six tanks of 15 fish each, three times a day over a 6-wk period. After the growth trial, a postprandial blood metabolic test was carried out. Fish fed diet 2 exhibited the highest percent weight gain and feed efficiency and protein efficiency ratio, whereas fish fed with diet 5 showed the lowest growth and feed utilization among treatments. The digestibility for starch in fish fed diet 1 and 2 was higher than those in fish fed with other diets (p<0.05). The highest activities for protease, lipase and amylase were found in fish fed the diet 2, diet 1, and diet 1 respectively among dietary treatments, while the lowest values for these indexes were observed in fish fed the diet 3, diet 5 and diet 4, respectively. The liver glycogen concentrations in fish fed diets 4 and 5 were found higher than in fish fed other diets (p<0.05). The feeding rate, hepatosomatic index, condition factor, and plasma parmeters (glucose, triglyceride, total cholesterol, high-density lipoprotein cholesterol, and low-density lipoprotein cholesterol) did not differ across treatments. In terms of postprandial blood responses, peak blood glucose and triglycerides were lower after 3 or 6 h in the fish fed with diets 3–5 than in the fish fed diet 1, but delayed peak blood total amino acid time was observed in fish fed with the diets 1 or 2. The lowest peak values for each of the three blood metabolites were observed in fish fed diet 5. The results indicate that high-dietary amylose-amylopectin ratio could compromise growth, but help in reducing the blood glucose stress on fish caused by postprandial starch load.
INTRODUCTION
Carbohydrate and particular cereal starch are the main sources for energy production of most terrestrial warm-blooded animals including human beings, but its impact is less in fish (Wilson, 1994). Although fish have the same carbohydrate metabolic pathways as mammals, they have a lower carbohydrate tolerance than mammals, as evidenced by a prolonged postprandial hyperglycemia after feeding carbohydrate-rich diets (Wilson, 1994; Moon, 2001). As a result, the use of carbohydrate for energy is limited and a high dietary inclusion level of carbohydrates could lead to growth retardation in fish (Wilson, 1994). Fish depend more than most other animals on amino acids as precursors to glucose for tissue protein and glucose synthesis as well as energy (Mommsen and Plisetskaya, 1991; Moon, 2001). Nevertheless, from an economic point of view, it is desirable to reduce the protein and lipid use for energy consumption by increasing the carbohydrate use in the aquafeeds where carbohydrates are more readily available and less expensive than other macro-nutrients. The nutritional value of starches varies widely depending on its sources (Granfeldt et al., 1994; Gutierrez Del Alamo et al., 2009; Glencross et al., 2012), processing (Mahadevamma and Tharanathan, 2007), hardness (Denardin et al., 2012), non-starch polysaccharides (Glencross et al., 2012) and fish species (Wilson, 1994) as well as its complexity (Jun et al., 2010). Furthermore, previous studies have shown that the metabolic responses induced by dietary starches differ (Hemre et al., 2002; Stone, 2003; Enes et al., 2009). Starch is composed of two types of glucose polymers, amylose, a linear chain of glucose units joined by α-1,4-glucosidic linkages, and amylopectin, a highly branched amylose in which the branches are tied by α-1,6 bonds (Zobel, 1988). Amylopectin-rich starches are easily digested, which may induce a faster and higher glycemic and insulinemic responses compared to those high in amylose (Behall et al., 1989; Weststrate and van Amelsvoort, 1993; Granfeldt et al., 1995; Behall et al., 2002; Rawles and Lochmann, 2003). Although these metabolic responses were previously observed both in mammals and fish, the mechanisms behind these responses are not well understood.
In terms of growth effects in relation to starch type, most of the research has focused on terrestrial animals, but contradictory results have occurred in different studies. The positive effects on growth in response to dietary amylose were observed in pigs (Cohen and Tanksley, 1973), poultry (Pirgozliev at al., 2000; Gutierrez Del Alamo et al., 2009) and goats (Kyuma and Ishida, 1989), but the negative effects were observed in rats (Aziz et al., 2009; Denardin et al., 2012), pigs (Perez and Aumaitre, 1979; Camp et al., 2003), and poultry (Ertl and Dale, 1997; Bergh et al., 1999; Pirgozliev et al., 2002; Collins et al., 2003; Pirgozliev at al., 2010). No effect of starch type on growth was also observed in rats (Mongeau et al., 1995; Zhou and Kaplan, 1997; Kabir et al., 1998) and pigs (Shelton et al., 2004). In fish, Rawles and Lochmann (2003) first investigated the starch utilization related to starch type and observed an enhanced growth of sunshine bass (Morone chrysops ♀×M. saxatilis ♂) when fed with a diet at the higher ratio of amylose-amylopectin starch. To the best of our knowledge, the impact of dietary amylose-amylopectin ratio in the starch fraction of the diet on other fish species has not yet been determined. The omnivorous fish such as tilapia (Oreochromis niloticus) have greater ability to digest starch than carnivorous fish (Krogdahl et al., 2005). We hypothesized that the tilapia fed diets with increasing amylose-amylopectin ratio would exhibit better growth. Therefore, we investigated the effects of dietary amylose-amylopectin ratio on the growth, feed utilization, digestibility, digestive enzyme activity, and blood intermediary metabolites in the tilapia.
MATERIALS AND METHODS
Diets
High-amylose corn starch (Hi-Maize 260, National Starch and Chemical Co., Ltd., China, 66.9% amylose) and waxy rice (the local glutinous rice, 81.0% amylopectin and 0.1% amylose) were used as the main amylose and amylopectin sources, respectively. Steam dried fish meal was obtained from Shine Biotech Co., Ltd., China. Fish oil, soybean oil, and other feed ingredients were obtained from Baisuihang Feed Co. Ltd., China. Based on the proximate composition of feed ingredients, five isonitrogenous (32% crude protein) and isolipidic (6.5% crude fat) diets containing an equal starch level (35% starch) were formulated. Diets differing in ratios of amylose-amylopectin (diet 1, 0.11; diet 2, 0.24; diet 3, 0.47; diet 4, 0.76; and diet 5, 0.98) were achieved by adjusting the proportion of corn starch to waxy rice, i.e. by incremental levels of amylose from 2.58% to 14.12% at the expense of amylopectin. The ingredients and proximate composition of the experimental diets are shown in Table 1. The coarse dry ingredients were ground using a hammer mill and then passed through a 60 mesh sieve, weighed and blended together into a homogeneous mixture. The liquid ingredients (mixed oil and water) were then added, and the mixture was made into a mash. The dough was pelleted through a 2.5-mm die using multifunctional spiral extrusion machinery (CD4XITS, South China University of Technology, China). The pellets were dried in a forced-air oven at 50°C for 24 h and then sealed in plastic bags and kept at −20°C until further use for feeding.
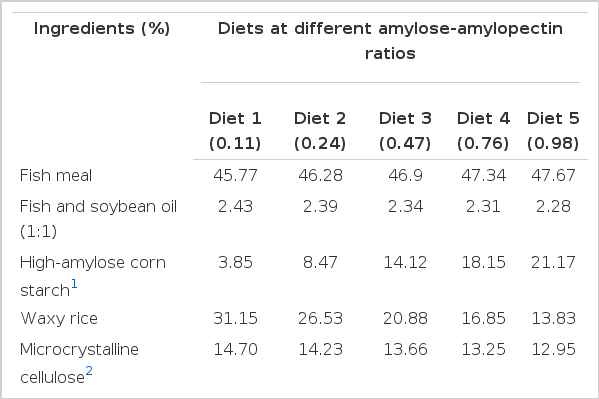
Ingredients and composition of the experimental diets (as-fed basis)
Feeding procedures
The tilapia juveniles obtained from a local commercial farm in Xiamen were transported to the aquaculture laboratory of Jimei University. The fish were stocked into a closed recirculating system consisting of two circular fiber glass tanks (0.85 m height×1.22 m upper diameter, 1.04 m lower diameter) with a polygeyser bead filter (Aquaculture Systems Technologies, LLC., USA) and were initially maintained on a commercial tilapia feed for 15 d. A total of four hundred and fifty animals, initially weighing an average of 9.81±0.42 g (means±SD) were randomly divided into five experimental groups, each with six replicate 100–l tanks at a density of 15 fish per tank. During a feeding period of 42 d, the fish in each group were hand-fed on one of the diets to satiation at 08:00, 13:00 and 18:00 h per day under a natural photoperiod. After 7 d of feeding, feces were collected from wk 2, until the end of the feeding trial. Excess feed was collected one hour after each feeding and then feces were collected by siphoning. To minimize the nutrient leaching in feces, only fresh and intact feces were collected. Feces collected from a single tank were pooled each day and dried at 70°C. Dissolved oxygen was measured daily and nitrite-N was monitored twice a week with a multi-parameter photome (HI83200, Hanna Instruments, USA). During the feeding trial, the water temperature, dissolved oxygen and nitrite-N ranged from 27.5 to 32°C, 4.9 to 5.6 mg/L and 0 to 0.2 mg/L, respectively.
Sampling procedures
At the termination of the feeding trial, fish in each tank were bulk weighed and counted after 24 h starvation. Three fish were randomly taken from each of four replicate tanks per treatment and killed with an overdose of MS 222 (tricaine methanesulfonate) solution, pooled, weighed, minced and then dried at 70°C for whole-body composition analysis. Additionally, sixteen fish from four replicate tanks in each treatment were randomly sampled, anesthetized (MS 222, 100 mg/L) and weighed individually. Blood was collected via venipuncture using a heparinized syringe and immediately centrifuged at 3,000×g for 10 min at 4°C. Plasma samples from each tank were pooled and stored at −80°C for subsequent analysis of blood biochemical parameters. After blood collection, the liver and intestine were immediately removed and weighed. Liver and intestine samples were frozen in liquid nitrogen and stored at −80°C before use. The remaining fish in each treatment were used for the subsequent postprandial blood response test.
Postprandial blood metabolic response test
After sample collection, the remaining fish in each treatment were readjusted and distributed into the same tanks as used in the growth trial with three tanks of 22 fish per tank. Fish were continued to be maintained on their respective diets for 7 d. The next morning, fish received a single meal to apparent satiety within 30 min. Blood samples were collected from three fish in each tank with a total of nine fish for each treatment at each sampling time, according to the above described method and blood were collected at 0, 1, 3, 6, 9, 12 and 24 h after a meal. Plasma aliquots were stored at −80°C for subsequent analysis of blood biochemical parameters.
Plasma components and liver glycogen analysis
Plasma glucose, triglyceride (TG), total cholesterol (T-CHO), high-density lipoprotein cholesterol (HDL-C) and low-density lipoprotein cholesterol (LDL-C) were measured by using kits (BioSino Bio-technology and Science, Inc., China). All the blood parameters were determined by using an automatic biochemical analyzer (Hitachi 7020, Japan) as described by Ye et al. (2011). Total plasma amino acid and liver glycogen were analyzed using the L-amino acid assay kit and glycogen assay kit, respectively (Nanjing Jiancheng Bioengineering Institute, China) according to the manufacturer’s protocols by using UV-2800S spectrophotometer (UNICO Instruments Co., Ltd., China).
Digestive enzyme analysis
The pooled intestines of each sample were homogenized in chilled saline at a ratio of 1:9 (w/v) for 10 min. The supernatant was collected after centrifugation at 6,261×g for 15 min at 4°C. Aliquots of the supernatant, designated as the crude extract, were used to estimate the activities of amylase and protease, according to the procedure described by Ye et al. (2011), and the lipase activity was assayed with the lipase activity assay kit (NJBI, China) using a UV-2800S spectrophotometer.
Proximate composition analysis
Crude protein, crude fat, moisture and ash contents in feed ingredients, diets, feces and whole-body fish samples were determined according to the methods of the Association of Official Chemists (AOAC, 1995). Crude protein content was determined by the Kjeldahl method (N×6.25) using Kjeltec™ 8400 Auto Sample Systems (Foss Tecator AB, Sweden). Crude fat content was determined by the Soxhlet method by using Soxtec Avanti 2050 (Foss Tecator AB). Moisture content was determined by the drying method, using an oven at 105°C. Ash content was determined by the combustion method, using a muffle furnace at 550°C. Acid-insoluble ash content was determined by using the same muffle furnace at 550°C, after acid digestion. Acid-insoluble ash was used as an endogenous indicator, instead of chromium oxide as an exogenous marker, to determine the nutrient digestibility because the dietary chromium oxide as a glucose tolerance factor is believed to affect starch utilization (Shiau and Chen, 1993). The total starch content in corn starch, waxy rice, diets and feces was calorimetrically determined by using the total starch assay kit (Megazyme International Ireland Ltd., Ireland). Using the amylose assay kit (Megazyme International Ireland Ltd., Ireland), the amylose content in high-amylose corn starch, sticky rice and diets was analyzed.
Calculations
Percent weight gain, feed conversion ratio, protein efficiency ratio, feeding rate, survival, hepatosomatic index and condition factor were calculated as follows:
The apparent digestibility coefficients (ADCs) of the experimental diets for dry matter, crude protein, crude fat, ash and starch were calculated according to the following equation (Spyridakis et al., 1989):
where Nf is the percentage of a specific nutrient in feces, Nd is the percentage of the same nutrient in the diet, Md is the percentage of acid-insoluble ash in the diet and Mf is the percentage of acid-insoluble ash in feces.
Statistical analysis
Data are presented as mean±SD. The normality and variance’s homogeneity of all data were systematically checked before applying One-way ANOVA, and the mean values were compared by using the Student-Neuman-Keuls multiple comparison tests, at the 5% level of significance. The results of the measured variables were examined by regression. A repeated measures ANOVA was carried out to examine mean differences in postprandial concentrations of blood glucose, TG and total amino acids among treatments at time intervals. All statistical tests were calculated using SPSS13.0 software (SPSS Inc., Chicago, USA).
RESULTS
Growth performance
The fish in each treatment exhibited proper growth and survived across the feeding period. Fish fed diet 2 exhibited significantly (p<0.05)higher WG (%), FE (%) and PER compared with fish fed diet 5 (Table 2). A strong negative correlation was observed between WG%, FE% and PER and dietary amylose-amylopectin ratio (R = −0.8907, −0.9347 and −0.9031, respectively) and the values for WG (%), FE (%) and PER in fish fed diet 2 were significantly higher than those in fish fed diet 5 (p<0.05). Although HSI (%) did not differ across treatments, the parameter was linearly (R = −0.9728) correlated with dietary amylose-amylopectin ratio. No influences of dietary amylose-amylopectin ratio on FR% and CF could be detected (p>0.05).

Effects of dietary amylose-amylopectin ratios on the growth performance of tilapia over a feeding period of 6 wks
Nutrient digestibility
As shown in Table 3, the digestibility values for dry matter, crude protein and lipid did not differ among dietary treatments (p>0.05). However, there was a negatively linear correlation between dry matter digestibility and dietary amylose-amylopectin ratio (R = −0.8948; p = 0.0403). The starch digestibility showed a decreasing trend with the increase in dietary amylose-amylopectin ratio (R = −0.9893, p = 0.0013), and the values of fish fed diets 1–2 were significantly (p<0.05) higher than those of fish fed with other diets. When considering WG%, FE% and PER in relation to nutrient digestibility, the FE% and PER were linearly correlated with the values for dry matter (R = 0.973, p = 0.005; R = 0.928, p = 0.023, respectively) and for starch (R = 0.956, p = 0.011; R = 0.903, p = 0.036, respectively). The WG% was also correlated linearly with apparent digestibility of starch (R = 0.911, p = 0.031), but protein and lipid digestibility did not show this relationship (Table 3).
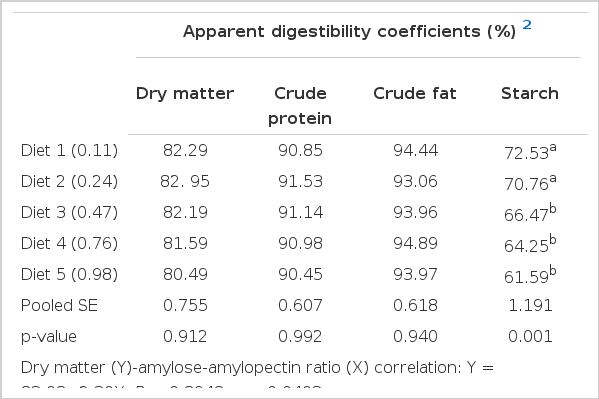
Effects of dietary amylose-amylopectin ratios on nutrient digestibility for tilapia over a feeding period of 6 wks.
Digestive enzyme activity
Highest protease activity was observed in fish fed diet 2, and was significantly (p<0.05) higher than those in fish fed the other diets (Table 4). A decreasing trend of lipase (R = −0.9080, p = 0.0330) and amylase (R = −0.8617, p = 0.0604) activities was observed as dietary amylose-amylopectin ratio increased and the values of amylase and lipase in fish fed with diet 1 were significantly (p<0.05) higher than those of fish fed other diets. The amylase activity was linearly correlated (R = 0.910; p = 0.032) with starch digestibility in response to dietary amylose-amylopectin ratio (Table 4).
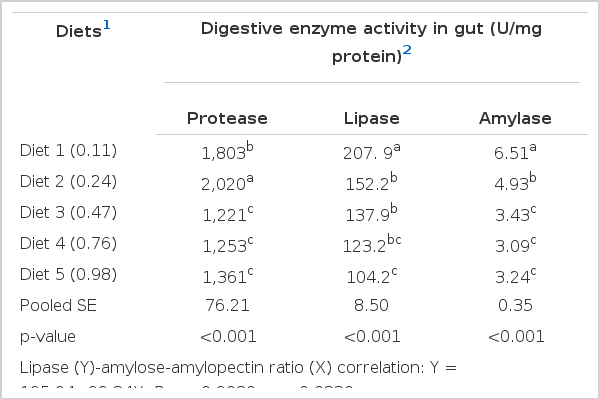
Effects of dietary amylose-amylopectin ratios on digestive enzyme activity in the gut of tilapia over a feeding period of 6 wks
Whole-body composition
The values of moisture, crude protein, crude fat and ash of the fish did not vary across dietary treatments (Table 5). In case of the relationship between body lipid and dietary amylose-amylopectin ratio, lipid retention was inversely related to the ratio (R = −0.9642, p = 0.0081).

Effects of different dietary amylose-amylopectin ratios on whole body composition of tilapia over a feeding period of 6 wks
Plasma components and liver glycogen
There were no significant differences in plasma glucose, TG, T-CHO, LDL-C, and HDL-C concentrations between dietary treatments (Table 6). However, liver glycogen content showed significant difference between different dietary treatments (p<0.05), and the highest value was seen in fish fed diet 4 and lowest in fish fed diet 3.
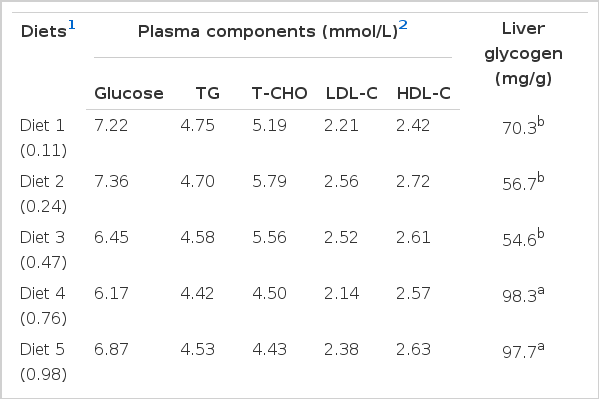
Effects of dietary amylose-amylopectin ratios on the concentrations of plasma components and liver glycogen in tilapia over a feeding period of 6 wks
Postprandial blood metabolic response
Plasma glucose concentrations of fish fed diets 1, 2 and 5 reached a peak 3 h after a meal (Figure 1), but the peak was reached in fish fed diets 3–4 only at 6 h, and thereafter the values gradually decreased to about the preprandial levels till 24 h. However, the fish fed diet 1 exhibited a significant difference (p<0.05), when compared with the lower peaks achieved in diets 3–5.

Effect of amylose-amylopectin ratios on the plasma glucose concentrations in the fish at different diets. Plasma glucose concentrations were measured at various time intervals after a meal in fish fed diets varying in amylose-amylopectin ratios (0.11, 0.24, 0.47, 0.76 and 0.98, respectively) over the 6-wk feeding period. Data are means±SD (n = 3), represents three replicate tanks used at each sampling time. Plasma samples of three fish were pooled for tank. Plasma glucose was significantly affected by dietary treatments and time after a meal.
A decreasing trend was observed with the increase in dietary amylose-amylopectin ratio, and the fish fed diet 1, showed the highest value, which was significantly different (p<0.05) from the fish fed diets 3–5 at 1, 3 or 9 h, while lowest value was observed in the fish fed diet 5. Highest peak was observed in fish fed diets 1–3 and diet 5 3 h after a meal, but it reached its peak in fish fed diet 4 only after 6 h (Figure 2). However, the peak in fish fed diet 1 was significantly (p<0.05) higher than fish fed diets 3 and 5 at 3 h. The values in fish fed diet 1 maintained at a higher level than those of fish fed other diets for the 9 h after a meal. The values across all treatments were reduced to below the preprandial value till 24 h.
Effect of amylose-amylopectin ratios on the plasma triglyceride concentrations in the fish at different diets. Plasma triglyceride concentrations were measured at various time intervals after a meal in fish fed diets varying in amylose-amylopectin ratios (0.11, 0.24, 0.47, 0.76 and 0.98, respectively) over the 6-wk feeding period. Data are means±SD (n = 3), represents three replicate tanks used at each sampling time. Plasma samples of three fish were pooled for tank. Plasma triglyceride was significantly affected by dietary treatments and time after a meal.
Contrary to the plasma glucose changes, total amino acid concentrations of fish fed diets 1 and 2 reached a peak 6 h after a meal, whereas the peak of fish fed diets 3–5 was reached at 3 h (Figure 3). The peak of fish fed diet 5 at 3 h was at the lowest and was not different from the initial value and those at other sampling times.

Effect of amylose-amylopectin ratios on the plasma total amino acid concentrations in the fish at different diets. Plasma total amino acid concentrations were measured at various time intervals after a meal in fish fed diets varying in amylose-amylopectin ratios (0.11, 0.24, 0.47, 0.76 and 0.98, respectively) over the 6-wk feeding period. Data are means±SD (n = 3), represents three replicate tanks used at each sampling time. Plasma samples of three fish were pooled for tank. Plasma total amino acid was significantly affected by dietary treatments and time after a meal.
DISCUSSION
The results of our study demonstrated that amylose-amylopectin ratio in the starch fraction of the diet affects the growth performance of the tilapia. The fish fed with the diet containing amylose-amylopectin at ratio of 0.24 had superior performance (WG% and FE%) relative to those fed the diets at higher or lower ratio, which was not accordance with the results of Rawles and Lochmann (2003) who observed enhanced growth of sunshine bass that were fed a 70% amylose diet. Our finding is consistent with what has been reported for broilers (Dai et al., 2008) and piglets (Deng et al., 2010) wherein the dietary amylose-amylopectin ratio at 0.23 is suitable for this production. The observation in our study and the previous reports are closer to the average value of amylose-amylopectin in cereal starch fraction (Shibanuma et al., 1994; Hruby, 2005). The digestion of starch depends on its amylose-amylopectin ratio and their molecular weight (Granfeldt et al., 1994; Englyst and Hudson, 1996). Amylose has more hydrogen bonds and undergoes more rapid retrogradation than does amylopectin (Zhou and Kaplan, 1997), while the amylopectin, having a branched chain, allows a greater access to digestive enzymes. For this reason, amylose is more resistant to hydrolytic enzymes compared with amylopectin (Kabir et al., 1998; Weurding et al., 2001), which may be partly attributed to the presence or development of resistance starch (Behall and Hallfrisch, 2002). Therefore, the ratio of amylose to amylopectin affects the digestion of starch and other macronutrients and its metabolic responses (Le Leu et al., 2009; Deng et al., 2010; Fugui et al., 2010; Jun et al., 2010). In the present study, a linear correlation was found between amylase activity and starch digestibility in response to dietary amylose-amylopectin ratio, which reflects the direct impact of dietary amylose-amylopectin ratio on starch digestion at a higher level. Furthermore, FE%, PER or/and WG% correlated linearly with the apparent digestibility of dry matter and starch. Our results agreed with what was reported by Denardin et al. (2012) for rats. However, the mismatch between protease activity and protein digestibility and between lipase activity and lipid digestibility in response to dietary amylose-amylopectin ratio indicated that protein and lipid digestibility was less affected by starch type compared with starch digestibility. This indicates that nutrient digestibility is not the only reason for the differences in starch utilization in terms of starch type. Previous studies showed that rats and poultry were able to adapt to dietary changes by increasing their feed intake and dietary energy consumption to compensate the lower digestibility values of diets caused by starch type (Zhou and Kaplan, 1997; Pirgozliev et al., 2010). Similar responses also exist in some carnivorous fish (Bergot, 1979; Yamamoto et al., 2001; Boujard et al., 2004), that is, such fish have the ability to compensate for imbalances in nutrient density through increasing feed intake. The tilapia, however, exhibited a partial ability in this regard in our current study, because although the feed intake increased with an increasing dietary ratio of amylose-amylopectin, the fish fed higher amylose still exhibited lower nutrient digestibility and growth. Berger and Halver (1987) showed that liver enlargement is associated with increased lipid or glycogen deposition. An increased HSI was found in high amylose-fed rats (Zhou and Kaplan, 1997). However, the opposite result was observed in high amylose-fed sunshine bass (Rawles and Lochmann, 2003), consistent with our current results. This indicates that liver was in a good state, though liver glycogen concentration was higher in fish fed a diet at a high amylose-amylopectin ratio compared with those at the low ratio. In the present study, liver glycogen deposition indicates that starch not used for energy may accumulate in the liver of the tilapia fed higher-amylose-amylopectin ratio diets, supporting the observations for rainbow trout Oncorhynchus mykiss (Brauge et al., 1994). These observations may partly account for the inferior growth and feed utilization of fish that were fed higher-amylose diets.
The whole-body composition was not affected by dietary treatments, which was similar to the observations by Solomon et al. (2007). Although not significant, there was a progressive reduction in whole-body lipid retention to dietary amylose-amylopectin ratio. The inverse relationship between dietary amylose-amylopectin ratio and whole-body lipid retention appears interesting, since an increased dietary amylose level did not lead to undesirable lipid accumulation in the body of the fish, though the whole-body protein retention was not related with the dietary amylose-amylopectin ratio.
Rawles and Lochmann (2003) reported a reduced liver glycogen deposit in higher amylose-fed sunshine bass. The opposite response was observed in our current study and in previous work with gibel carp (Carassius auratus gibelio; Tan et al., 2006). Regardless of starch type, high dietary starch levels could elevate liver glycogen deposits in rainbow trout (Bergot, 1979; Suárez et al., 2002), eel (Angilla Anguilla; Suárez et al., 2002) and Atlantic cod (Gadus morhua; Hemre et al., 1993), indicating the relative low ability of these carnivorous fish to use glucose by the glycolytic pathway. The variations may be caused by the difference in fish species.
The plasma intermediary metabolites were not affected by dietary treatments, which is consistent with those of Camp et al. (2003), who reported no effect of starch type on plasma metabolites (TG, LDL-C and HDL-C) in growing pigs. However, decreased serum T-CHO and TG levels in mammals was observed by Behall et al. (1988) and Denardin et al. (2012), whereas the opposite effect was observed by Yin et al. (2011) in weaned pigs after the consumption of a diet rich in amylose compared to a diet rich in amylopectin. The reason for this difference is unclear in that the dietary starch level was identical for each experiment besides protein and lipid level. Some previous studies have also shown that starch type is not the sole determinant factor affecting starch digestion and postprandial glycemic responses (Zhou and Kaplan, 1997) as well as growth performance (Pirgozliev et al., 2010), but there are other physiochemical characteristics of cereals like genotype (Granfeldt et al., 1994; Gutierrez Del Alamo et al., 2009), processing (Mahadevamma and Tharanathan, 2007; Glencross et al., 2012), hardness (Denardin et al., 2012) and non-starch polysaccharides (Glencross et al., 2012), which could also exert some effect on the growth.
Because of the high enzyme resistance of amylose, mammals ingesting high dietary amylose have low glycemic and insulinemic postprandial responses compared with amylopectin (Granfeldt et al., 1994; Noakes et al., 1996; Zhou and Kaplan, 1997; Behall and Hallfrisch, 2002; Aziz et al., 2009). This effect is beneficial for the control of diabetes and also to reduce the risk of diabetes development (Behall and Hallfrisch, 2002; Aziz et al., 2009). Contrary to terrestrial animals, tolerance to carbohydrate is somewhat lower in fish (Wilson, 1994; Enes et al., 2010), and its underlying mechanism remains unclear (Moon, 2001; Polakof et al., 2010). Few studies have observed fish glycemic changes in response to amylose-amylopectin ratio. In the present study, we measured the postprandial changes in several blood intermediary metabolites of fish fed diets varying in amylose-amylopectin ratios. The weak peak level of blood glucose in the tilapia in our study and in sunshine bass in the previous study conducted by Rawles and Lochmann (2003) was observed after the high-amylose load when compared with those with the low-amylose load, a fact suggesting that feeding higher-amylose diet might lead to higher tolerance to starch. Meanwhile, peak blood TG paralleled with the glucose change of the tilapia in response to dietary amylose-amylopectin ratio. In contrast with peak blood glucose, peak total amino acid time was delayed when fish were fed the low-amylose diet when compared with those fed the high-amylose diet. We also observed that the highest dietary amylose-amylopectin ratio produced the weakest metabolic responses, regardless of blood glucose, TG or total amino acids. The lowered metabolic responses in the presence of high-amylose starch could be associated with a lowered rate of amylolysis and this may be due to the increased time of gastrointestinal transit after ingestion of high-amylose (Goddardet al., 1984; Granfeldt et al., 1994; Weurding et al., 2001).
CONCLUSIONS
There is considerable variation in growth and feed utilization with the dietary use of starch type in terrestrial animals and fish. Our results in the present study showed that there were negative linear relationships between percent weight gain, feed efficiency, protein efficiency ratio, starch digestibility, the activities of protease, lipase and amylase and the dietary amylose-amylopectin ratio. After a meal, peak blood glucose and TG were lower in fish fed higher-amylose diets than those in fish fed lower-amylose diets, and peak total amino acid time was delayed in the fish fed the low-amylose diet when compared with those fed the high-amylose diet. The decreased growth performance, along with the lower-peak blood glucose and TG as well as the delayed peak total amino acid time in fish fed higher-amylose-amylopectin diets let us to conclude that higher dietary amylose compromises the growth but helps in reducing the blood glucose stress on the fish caused by postprandial starch load.
Acknowledgements
This study was funded by the Fujian Provincial Natural Science Foundation (2012J01141), the Foundation for Innovative Research Team of Jimei University (2011A001), and the Research Foundation of Jimei University (F04008).